<?xml version="1.0" encoding="utf-8"?><feed xmlns="http://www.w3.org/2005/Atom" ><generator uri="https://jekyllrb.com/" version="3.10.0">Jekyll</generator><link href="https://azev77.github.io/feed.xml" rel="self" type="application/atom+xml" /><link href="https://azev77.github.io/" rel="alternate" type="text/html" /><updated>2024-12-25T22:13:45-08:00</updated><id>https://azev77.github.io/feed.xml</id><title type="html">Home</title><subtitle>Assistant Professor of Finance, Fowler College of Business</subtitle><author><name>Albert Alex Zevelev</name></author><entry><title type="html">Future Post Machine Learning for Causal Inference: Synthetic Control and Double Machine Learning</title><link href="https://azev77.github.io/posts/2021/04/ML-Causality/" rel="alternate" type="text/html" title="Future Post Machine Learning for Causal Inference: Synthetic Control and Double Machine Learning" /><published>2021-08-11T00:00:00-07:00</published><updated>2021-08-11T00:00:00-07:00</updated><id>https://azev77.github.io/posts/2021/04/blog-post-4</id><content type="html" xml:base="https://azev77.github.io/posts/2021/04/ML-Causality/"><![CDATA[<p>This post is inspired by Frank Diebold’s</p>

<ul>
  <li><a href="https://fxdiebold.blogspot.com/2017/01/all-of-machine-learning-in-one.html">All of Machine Learning in One Expression</a></li>
  <li><a href="https://fxdiebold.blogspot.com/2016/10/machine-learning-vs-econometrics-i.html">ML vs E 1</a></li>
  <li><a href="https://fxdiebold.blogspot.com/2016/10/machine-learning-vs-econometrics-ii.html">ML vs E 2</a></li>
  <li><a href="https://fxdiebold.blogspot.com/2016/10/machine-learning-vs-econometrics-iii.html">ML vs E 3</a></li>
  <li><a href="https://fxdiebold.blogspot.com/2016/10/machine-learning-vs-econometrics-iv.html">ML vs E 4</a></li>
  <li><a href="https://fxdiebold.blogspot.com/2017/02/machine-learning-and-econometrics-v.html">ML vs E 5</a></li>
  <li><a href="https://fxdiebold.blogspot.com/2017/03/machine-learning-and-econometrics-vi.html">ML vs E 6</a></li>
  <li><a href="https://fxdiebold.blogspot.com/2017/03/ml-and-metrics-vii-cross-section-non.html">ML vs E 7</a></li>
</ul>]]></content><author><name>[&quot;Author One&quot;, &quot;Author Two&quot;]</name></author><category term="Causality" /><category term="Econometrics" /><category term="Machine Learning" /><category term="Statistics" /><summary type="html"><![CDATA[This post is inspired by Frank Diebold’s]]></summary></entry><entry><title type="html">Future Post Machine Learning in Julia using MLJ.jl</title><link href="https://azev77.github.io/posts/2021/04/blog-post-3/" rel="alternate" type="text/html" title="Future Post Machine Learning in Julia using MLJ.jl" /><published>2021-07-11T00:00:00-07:00</published><updated>2021-07-11T00:00:00-07:00</updated><id>https://azev77.github.io/posts/2021/04/blog-post-3</id><content type="html" xml:base="https://azev77.github.io/posts/2021/04/blog-post-3/"><![CDATA[]]></content><author><name>Albert Alex Zevelev</name></author><category term="cool posts" /><category term="category1" /><category term="category2" /><summary type="html"><![CDATA[]]></summary></entry><entry><title type="html">Future Post Random Variables in Julia compared to MATLAB/R/STATA/Mathematica/Python</title><link href="https://azev77.github.io/posts/2021/04/blog-post-2/" rel="alternate" type="text/html" title="Future Post Random Variables in Julia compared to MATLAB/R/STATA/Mathematica/Python" /><published>2021-06-11T00:00:00-07:00</published><updated>2021-06-11T00:00:00-07:00</updated><id>https://azev77.github.io/posts/2021/04/blog-post-2</id><content type="html" xml:base="https://azev77.github.io/posts/2021/04/blog-post-2/"><![CDATA[<p>This post compares the way random variables are handled in Julia/MATLAB/R/STATA/Mathematica/Python.
It was inspired by Bruce Hansen’s 
<a href="https://www.ssc.wisc.edu/~bhansen/probability/">recent textbook</a>
which compares statistical commands in Matlab/R/STATA on 
page <a href="https://www.ssc.wisc.edu/~bhansen/probability/Intro2Metrics.pdf#page=114">114</a>. 
This post will focus on the main methods for working with random variables in a language: 
e.g. 
<a href="https://github.com/JuliaStats/Distributions.jl">Distributions.jl</a> is the flagship Julia package for random variables, 
<a href="https://www.mathworks.com/help/stats/probability-distributions-1.html">MATLAB’s</a> internal distributions, 
<a href="https://cran.r-project.org/web/views/Distributions.html">Base R</a>,
<a href="https://www.stata.com/manuals/fnstatisticalfunctions.pdf">Base STATA</a>,
<a href="https://reference.wolfram.com/language/guide/RandomVariables.html">Mathematica</a>,
and
Python’s <a href="https://docs.scipy.org/doc/scipy/reference/stats.html">SciPy</a>.</p>

<h1 id="1-tables-comparing-syntax">1: Tables Comparing Syntax</h1>

<p>CDF:</p>

<table>
  <thead>
    <tr>
      <th>RV</th>
      <th>Julia</th>
      <th>MATLAB</th>
      <th>Base R</th>
      <th>STATA</th>
      <th>Mathematica</th>
      <th>Python <a href="https://docs.scipy.org/doc/scipy/reference/stats.html">SciPy</a></th>
    </tr>
  </thead>
  <tbody>
    <tr>
      <td>$N(0,1)$</td>
      <td>cdf(Normal(0,1),x)</td>
      <td>normcdf(x)</td>
      <td>pnorm(x)</td>
      <td>normal(x)</td>
      <td>CDF[NormalDistribution[0, 1],x]</td>
      <td>norm.cdf(x)</td>
    </tr>
    <tr>
      <td>$\chi^2_{r}$</td>
      <td>cdf(Chisq(r),x)</td>
      <td>chi2cdf(x,r)</td>
      <td>pchisq(x,r)</td>
      <td>chi2(r,x)</td>
      <td>CDF[ChiSquareDistribution[r],x]</td>
      <td>chi2.cdf(x, r)</td>
    </tr>
    <tr>
      <td>$t_r$</td>
      <td>cdf(TDist(r),x)</td>
      <td>tcdf(x,r)</td>
      <td>pt(x,r)</td>
      <td>1-ttail(r,x)</td>
      <td>CDF[StudentTDistribution[r],x]</td>
      <td>t.cdf(x, r)</td>
    </tr>
    <tr>
      <td>$F_{r,k}$</td>
      <td>cdf(FDist(r,k),x)</td>
      <td>fcdf(x,r,k)</td>
      <td>pf(x,r,k)</td>
      <td>F(r,k,x)</td>
      <td>CDF[FRatioDistribution[r,k],x]</td>
      <td>f.cdf(x, r, k)</td>
    </tr>
    <tr>
      <td>$D(\theta)$</td>
      <td>cdf(D(θ),x)</td>
      <td>Dcdf(x,θ)</td>
      <td>pD(x,θ)</td>
      <td>?</td>
      <td>CDF[D[θ],x]</td>
      <td>D.cdf(x,θ)</td>
    </tr>
  </tbody>
</table>

<p>Inverse Probabilities (quantiles):</p>

<table>
  <thead>
    <tr>
      <th>RV</th>
      <th>Julia</th>
      <th>MATLAB</th>
      <th>Base R</th>
      <th>STATA</th>
      <th>Mathematica</th>
      <th>Python <a href="https://docs.scipy.org/doc/scipy/reference/stats.html">SciPy</a></th>
    </tr>
  </thead>
  <tbody>
    <tr>
      <td>$N(0,1)$</td>
      <td>quantile(Normal(0,1),p)</td>
      <td>norminv(p)</td>
      <td>qnorm(p)</td>
      <td>invnormal(p)</td>
      <td>Quantile[NormalDistribution[],p]</td>
      <td>norm.ppf(p)</td>
    </tr>
    <tr>
      <td>$\chi^2_{r}$</td>
      <td>quantile(Chisq(r),p)</td>
      <td>chi2inv(p,r)</td>
      <td>qchisq(p,r)</td>
      <td>invchi2(r,p)</td>
      <td>Quantile[ChiSquareDistribution[r],p]</td>
      <td>chi2.ppf(p, r)</td>
    </tr>
    <tr>
      <td>$t_r$</td>
      <td>quantile(TDist(r),p)</td>
      <td>tinv(p,r)</td>
      <td>qt(p,r)</td>
      <td>invttail(r,1-p)</td>
      <td>Quantile[StudentTDistribution[r],p]</td>
      <td>t.ppf(p, r)</td>
    </tr>
    <tr>
      <td>$F_{r,k}$</td>
      <td>quantile(FDist(r,k),p)</td>
      <td>finv(p,r,k)</td>
      <td>qf(p,r,k)</td>
      <td>invF(r,k,p)</td>
      <td>Quantile[FRatioDistribution[r,k],p]</td>
      <td>f.ppf(p, r, k)</td>
    </tr>
    <tr>
      <td>$D(\theta)$</td>
      <td>quantile(D(θ),p)</td>
      <td>Dinv(p,θ)</td>
      <td>qD(p,θ)</td>
      <td>invD(p,θ)</td>
      <td>Quantile[D[θ],p]</td>
      <td>D.ppf(p,θ)</td>
    </tr>
  </tbody>
</table>

<p>Other Properties:</p>

<table>
  <thead>
    <tr>
      <th>Property</th>
      <th>Julia</th>
      <th>MATLAB</th>
      <th>Base R</th>
      <th>STATA</th>
      <th>Mathematica</th>
      <th>Python <a href="https://docs.scipy.org/doc/scipy/reference/stats.html">SciPy</a></th>
    </tr>
  </thead>
  <tbody>
    <tr>
      <td>cdf</td>
      <td>cdf(D(θ),x)</td>
      <td>Dcdf(x,θ)</td>
      <td>pD(x,θ)</td>
      <td>?</td>
      <td>CDF[D[θ],x]</td>
      <td>D.cdf(x,θ)</td>
    </tr>
    <tr>
      <td>pdf/pmf</td>
      <td>pdf(D(θ),x)</td>
      <td>Dcdf(x,θ)</td>
      <td>dD(x,θ)</td>
      <td>?</td>
      <td>PDF[D[θ],x]</td>
      <td>D.pdf(x,θ)</td>
    </tr>
    <tr>
      <td>quantile</td>
      <td>quantile(D(θ),p)</td>
      <td>Dinv(p,θ)</td>
      <td>qD(p,θ)</td>
      <td>invD(p,θ)</td>
      <td>Quantile[D[θ],p]</td>
      <td>D.ppf(p,θ)</td>
    </tr>
    <tr>
      <td>random</td>
      <td>rand(D(θ),N)</td>
      <td>Dinv(p,θ)</td>
      <td>rD(N)</td>
      <td>invD(p,θ)</td>
      <td>RandomVariate[D[θ],N]</td>
      <td>D.ppf(p,θ)</td>
    </tr>
    <tr>
      <td>mean</td>
      <td>mean(D(θ))</td>
      <td>-</td>
      <td>-</td>
      <td>-</td>
      <td>Mean[D[θ]]</td>
      <td>-</td>
    </tr>
    <tr>
      <td>entropy</td>
      <td>entropy(D(θ))</td>
      <td>-</td>
      <td>-</td>
      <td>-</td>
      <td>-</td>
      <td>-</td>
    </tr>
    <tr>
      <td>fit</td>
      <td>fit(D, data)</td>
      <td>-</td>
      <td>-</td>
      <td>-</td>
      <td>FindDistributionParameters[data,D]</td>
      <td>-</td>
    </tr>
  </tbody>
</table>

<h1 id="2-random-variables-as-types">2: Random Variables as Types</h1>
<p>A key distinction between the way the packages above handle random variables
is that in 
Julia and Mathematica
<a href="https://computationalthinking.mit.edu/Spring21/random_variables_as_types/">a random variable is itself a type</a>. 
On the other hand e.g. in R you cannot refer to the underlying randomv variable, you can only compute properties 
such as <code class="language-plaintext highlighter-rouge">chi2cdf(x,r)</code>.</p>

<p>General syntax in Julia:
<br />
Distributions.jl distinguishes between a Random Variable’s parameters and property variables. 
A random variable is a <code class="language-plaintext highlighter-rouge">type</code> such as <code class="language-plaintext highlighter-rouge">Chisq(r)</code> or <code class="language-plaintext highlighter-rouge">D(θ)</code>. 
A property of a random variable such as CDF or mean is (typically) a functional
which takes random variable as its argument along with any necesarry property specific variables.
<br />
Note: some properties don’t have any arguments such as <code class="language-plaintext highlighter-rouge">mean(D(θ))</code>.
<br />
Note: the <code class="language-plaintext highlighter-rouge">fit(D, data)</code> function requires a distribution type without parameters <code class="language-plaintext highlighter-rouge">D</code> as opposed to <code class="language-plaintext highlighter-rouge">D(θ)</code>.</p>

<h1 id="3-random-variables-in-distributionsjl">3: Random Variables in Distributions.jl</h1>
<p><br /><br />
In general a random variables package does three things: 
<br /></p>
<ul>
  <li><strong>Creates</strong> random variables: built-in/fit/transform</li>
  <li><strong>Sample</strong> random variables</li>
  <li><strong>Compute</strong> properties: probabilities/moments/cumulants/entropies etc</li>
</ul>

<p><br /><br />
Here is an overview of current features:</p>
<ol>
  <li>Creating Random Variables:
    <ul>
      <li>Built in random variables: <code class="language-plaintext highlighter-rouge">D(θ)</code>, <code class="language-plaintext highlighter-rouge">Chisq(r)</code>, <code class="language-plaintext highlighter-rouge">FDist(r,k)</code> etc</li>
      <li>Combining and transforming random variables:</li>
    </ul>
    <ul>
      <li><strong>Mixture</strong> models: <code class="language-plaintext highlighter-rouge">MixtureModel([Normal(0,1),Cauchy(0,1)], [0.5,0.5])</code></li>
      <li><strong>Truncated</strong> random variables: <code class="language-plaintext highlighter-rouge">Truncated(Cauchy(0,1), 0.25, 1.8)</code></li>
      <li><strong>Convolution</strong> of random variables: <code class="language-plaintext highlighter-rouge">convolve(Cauchy(0,1), Cauchy(5,2))</code></li>
      <li><strong>Cartesian product</strong> of random variables: <code class="language-plaintext highlighter-rouge">product_distribution([Normal(),Cauchy()])</code></li>
      <li>Other packages for creating random variables: <a href="https://github.com/mmikhasenko/AlgebraPDF.jl">AlgebraPDF.jl</a> etc</li>
    </ul>
  </li>
  <li>Sampling: <code class="language-plaintext highlighter-rouge">rand(D(θ),N)</code>, <code class="language-plaintext highlighter-rouge">rand(Cauchy(0,1), 100)</code></li>
  <li>Fitting:
    <ul>
      <li>parametric: <code class="language-plaintext highlighter-rouge">fit(D, data)</code></li>
      <li>non-parametric: <code class="language-plaintext highlighter-rouge">fit(Histogram, data)</code></li>
    </ul>
  </li>
  <li>Other properties: <code class="language-plaintext highlighter-rouge">property(D(θ))</code> or <code class="language-plaintext highlighter-rouge">property(D(θ),x)</code> 
where θ is the vector of distribution parameters and x is the vector of <code class="language-plaintext highlighter-rouge">property</code> variables.
    <ul>
      <li>example: <code class="language-plaintext highlighter-rouge">d=LogNormal()</code></li>
      <li><code class="language-plaintext highlighter-rouge">mean(d), median(d), mode(d), var(d), std(d)</code></li>
      <li><code class="language-plaintext highlighter-rouge">skewness(d), kurtosis(d), entropy(d)</code></li>
      <li><code class="language-plaintext highlighter-rouge">pdf(d, 2), cdf(d, 2), quantile(d, .9), gradlogpdf(d, 2)</code></li>
      <li>Most properties above are implemented in closed form. 
There are POC <a href="https://github.com/JuliaStats/Distributions.jl/blob/master/src/functionals.jl">tools</a> from numerical expectation etc    <br />
<code class="language-plaintext highlighter-rouge">Distributions.expectation(LogNormal(), cos)</code> computes $E[cos(X)]$ where $X\sim LogNormal(0,1)$.</li>
    </ul>
  </li>
</ol>

<h1 id="4-future-and-other-and-general-tranformations-of-random-variables">
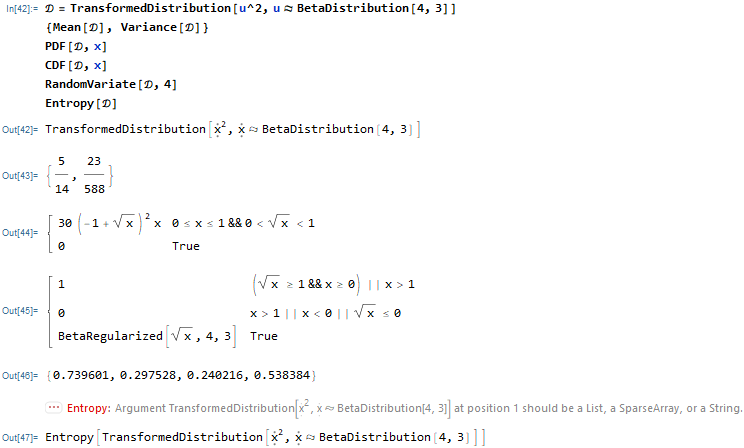
4: Future and other and general tranformations of random variables</h1>
<p><br /><br /><br /><br />
Numerical vs Symbolic:<br />
<img src="https://user-images.githubusercontent.com/7883904/114791686-e5042580-9d54-11eb-863b-3a6430e93d9b.png" alt="image" />
<br />
<img src="https://user-images.githubusercontent.com/7883904/114791715-f3524180-9d54-11eb-8be3-6b55ca9ebcf3.png" alt="image" />
<br /> <br />
I discussed the following examples on <a href="https://discourse.julialang.org/t/define-a-distribution-from-a-given-distribution/48220/10?u=albert_zevelev">Discourse</a>.
<br />
Distributions.jl currently doesn’t operate on transformations of random variables.
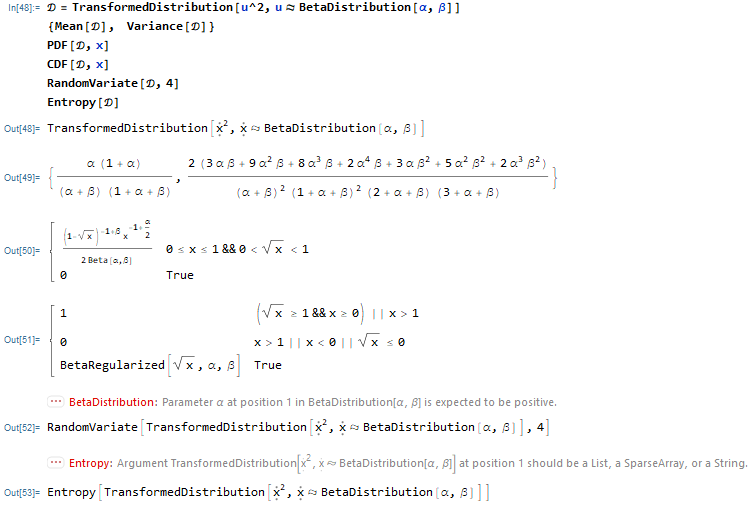
Mathematica can handle transformations of a distribution when it can solve the problem symbolically.
<br />
<img src="https://user-images.githubusercontent.com/7883904/114792182-d79b6b00-9d55-11eb-8d3d-313ac9ca9d90.png" alt="image" />
<br />
Now consider the same distribution with symbolic parameters <code class="language-plaintext highlighter-rouge">BetaDistribution[α,β]</code>
<br />
<img src="https://user-images.githubusercontent.com/7883904/114792411-555f7680-9d56-11eb-8b66-376563f7e3ba.png" alt="image" /></p>

<p>From <a href="https://arxiv.org/pdf/1907.08611.pdf">paper</a>:
<br />
Type hierarchy
<br /></p>
<ol>
  <li>Sampling interface
<br /></li>
  <li>Distribution interface and types
<br />
R equivalent <code class="language-plaintext highlighter-rouge">p-d-q-r</code> in Julia:
<img src="https://user-images.githubusercontent.com/7883904/114790686-298ec180-9d53-11eb-8016-ca515a33d921.png" alt="image" /></li>
  <li>
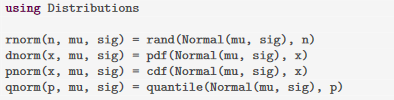
Distribution fitting and estimation
<br />
parametric: <code class="language-plaintext highlighter-rouge">fit(D, data)</code>
<br />
non-parametric: <code class="language-plaintext highlighter-rouge">fit(Histogram, data)</code>
<br /></li>
  <li>Modeling mixtures of distributions
<br /></li>
</ol>

<p>The table below adds Julia, Mathematica, and Python.</p>

<p>Python: https://github.com/QuantEcon/rvlib
<br />
R: https://github.com/alan-turing-institute/distr6
<br />
Compare syntax: https://hyperpolyglot.org/scripting</p>]]></content><author><name>Albert Alex Zevelev</name></author><summary type="html"><![CDATA[This post compares the way random variables are handled in Julia/MATLAB/R/STATA/Mathematica/Python. It was inspired by Bruce Hansen’s recent textbook which compares statistical commands in Matlab/R/STATA on page 114. This post will focus on the main methods for working with random variables in a language: e.g. Distributions.jl is the flagship Julia package for random variables, MATLAB’s internal distributions, Base R, Base STATA, Mathematica, and Python’s SciPy.]]></summary></entry><entry><title type="html">Simpson’s Paradox is a Special Case of Omitted Variable Bias</title><link href="https://azev77.github.io/posts/2021/04/Simpson-OVB/" rel="alternate" type="text/html" title="Simpson’s Paradox is a Special Case of Omitted Variable Bias" /><published>2021-04-11T00:00:00-07:00</published><updated>2021-04-11T00:00:00-07:00</updated><id>https://azev77.github.io/posts/2021/04/blog-post-1</id><content type="html" xml:base="https://azev77.github.io/posts/2021/04/Simpson-OVB/"><![CDATA[<p>The goal of this post is to illustrate a point made in a 
recent <a href="https://twitter.com/AmitEcon/status/1368990015536119813?s=20">tweet</a> 
by Amit Ghandi 
that <a href="https://en.wikipedia.org/wiki/Simpson%27s_paradox">Simpson’s Paradox</a> 
is a special case of 
<a href="https://en.wikipedia.org/wiki/Omitted-variable_bias">omitted variable bias</a>.</p>

<p>Let’s start with some definitions:
<br />
<strong>Simpson’s Paradox</strong>: a statistical phenomenon where an association between two variables in a population emerges, disappears or reverses when the population is divided into subpopulations.
<br />
<strong>Omitted Variable Bias (OVB)</strong>: when a statistical model leaves out one or more variables that is <em>both</em> correlated with the treatment and the outcome. 
<br />
<b>Case Fatality Rate (CFR)</b>: 
the proportion of people who die from a specified disease among all individuals diagnosed with the disease over a certain period of time.</p>

<h1 id="example-covid-19-in-china-versus-italy">Example: COVID-19 in China versus Italy</h1>
<p>Let’s use an example from 
<a href="https://www.youtube.com/watch?v=t-Ci3FosqZs">How Simpson’s paradox explains weird COVID19 statistics</a>. 
(This example is for illustrative purposes only. This post is about interpreting statistics, not COVID-19). 
The video compares those diagnosed with COVID-19 in China and Italy between March and May 2020. 
<br />
<u>CFR by country</u>: people infected with COVID-19 were more likely to die in Italy than China. 
<br />
<u>CFR by country-age group</u>: at each age bracket, people infected with COVID-19 were more likely to die in China than Italy.</p>

<h2 id="simulate-data">Simulate Data</h2>
<p>Let’s illustrate this with a simulation in <a href="https://julialang.org/">the Julia Language</a>.
<br />
The variables are defined in the table below:
<br /></p>

<math xmlns="http://www.w3.org/1998/Math/MathML" display="block">
  <mtable columnalign="left left left" columnspacing="1em" rowspacing="4pt" columnlines="solid solid" rowlines="solid none" frame="solid">
    <mtr>
      <mtd>
        <mtext>Outcome:&#xA0;</mtext>
        <msub>
          <mi>Y</mi>
          <mrow>
            <mi>i</mi>
          </mrow>
        </msub>
      </mtd>
      <mtd>
        <mtext>Treatment:&#xA0;</mtext>
        <msub>
          <mi>X</mi>
          <mrow>
            <mi>i</mi>
          </mrow>
        </msub>
      </mtd>
      <mtd>
        <mtext>Confounder:&#xA0;</mtext>
        <msub>
          <mi>Z</mi>
          <mrow>
            <mi>i</mi>
          </mrow>
        </msub>
      </mtd>
    </mtr>
    <mtr>
      <mtd>
        <msub>
          <mi>Y</mi>
          <mrow>
            <mi>i</mi>
          </mrow>
        </msub>
        <mo>&#x2261;</mo>
        <mn>0</mn>
        <mtext>&#xA0;if person i survives</mtext>
      </mtd>
      <mtd>
        <msub>
          <mi>X</mi>
          <mrow>
            <mi>i</mi>
          </mrow>
        </msub>
        <mo>&#x2261;</mo>
        <mn>0</mn>
        <mtext>&#xA0;if person i is in China</mtext>
      </mtd>
      <mtd>
        <msub>
          <mi>Z</mi>
          <mrow>
            <mi>i</mi>
          </mrow>
        </msub>
        <mo>&#x2261;</mo>
        <mn>0</mn>
        <mtext>&#xA0;if person i's age&#xA0;</mtext>
        <mo>&#x2264;</mo>
        <mn>59</mn>
      </mtd>
    </mtr>
    <mtr>
      <mtd>
        <msub>
          <mi>Y</mi>
          <mrow>
            <mi>i</mi>
          </mrow>
        </msub>
        <mo>&#x2261;</mo>
        <mn>1</mn>
        <mtext>&#xA0;if person i dies</mtext>
      </mtd>
      <mtd>
        <msub>
          <mi>X</mi>
          <mrow>
            <mi>i</mi>
          </mrow>
        </msub>
        <mo>&#x2261;</mo>
        <mn>1</mn>
        <mtext>&#xA0;if person i is in Italy</mtext>
      </mtd>
      <mtd>
        <msub>
          <mi>Z</mi>
          <mrow>
            <mi>i</mi>
          </mrow>
        </msub>
        <mo>&#x2261;</mo>
        <mn>1</mn>
        <mtext>&#xA0;if person i's age&#xA0;</mtext>
        <mo>&gt;</mo>
        <mn>59</mn>
      </mtd>
    </mtr>
  </mtable>
</math>

<p>Let’s assume the true data generating process (DGP) is: 
$Y_{i} = \beta_{0} + \beta_{xy} X_{i} + \beta_{zy} Z_{i} + \varepsilon_{i}$
<br />
Under the true DGP, $\text{CFR}\left(X_i, Z_i \right) = P\left(Y_i =1 | X_i, Z_i \right) =E\left[Y_i =1 | X_i, Z_i \right]$. 
<br /><br />
Assume $\beta_{0}=10, \beta_{xy} = -5, \beta_{zy} = 10$ (coefficients are in %). 
<br />
China-Young: $\text{CFR}\left(0, 0\right) = P\left(Y_i =1 | X_i=0, Z_i=0 \right) = \beta_{0} = 10\%$
<br />
China-Old: $\text{CFR}\left(0, 1\right) = P\left(Y_i =1 | X_i=0, Z_i=1 \right) = \beta_{0} + \beta_{zy} = 20\%$
<br />
Italy-Young: $\text{CFR}\left(1, 0\right) = P\left(Y_i =1 | X_i=1, Z_i=0 \right) = \beta_{0} + \beta_{xy} = 5\%$
<br />
Italy-Old: $\text{CFR}\left(1, 1\right) = P\left(Y_i =1 | X_i=1, Z_i=1 \right) = \beta_{0} + \beta_{xy} + \beta_{zy} = 15\%$
<br /><br />
Let’s generate artificial data consistent with the DGP. 
<br />
Suppose we have N=200 observations (half China, half Italy). 
<br />
Suppose 80% of China’s population is young $Z_{i} =0$ and 20% is old $Z_{i} = 1$.
<br />
Suppose 20% of Italy’s population is young $Z_{i} =0$ and 80% is old $Z_{i} = 1$.</p>

<figure class="highlight"><pre><code class="language-julia" data-lang="julia">  <span class="k">using</span> <span class="n">DataFrames</span><span class="x">,</span> <span class="n">Plots</span><span class="x">,</span> <span class="n">Statistics</span>
  <span class="n">N</span> <span class="o">=</span> <span class="mi">200</span><span class="x">;</span> <span class="c">#200 obs = 100 in China + 100 in Italy.</span>
  <span class="n">β_0</span> <span class="o">=</span> <span class="mf">10.0</span><span class="x">;</span> <span class="n">β_Italy</span> <span class="o">=</span> <span class="o">-</span><span class="mf">5.0</span><span class="x">;</span> <span class="n">β_Age</span> <span class="o">=</span> <span class="mf">10.0</span><span class="x">;</span>
  <span class="c">#</span>
  <span class="n">df</span> <span class="o">=</span> <span class="n">DataFrame</span><span class="x">(</span>
      <span class="n">Y</span>        <span class="o">=</span> <span class="x">[</span>
                  <span class="n">ones</span><span class="x">(</span><span class="mi">8</span><span class="x">);</span><span class="n">zeros</span><span class="x">(</span><span class="mi">80</span><span class="o">-</span><span class="mi">8</span><span class="x">);</span>   <span class="c">#China-Young: 8/80 die</span>
                  <span class="n">ones</span><span class="x">(</span><span class="mi">4</span><span class="x">);</span><span class="n">zeros</span><span class="x">(</span><span class="mi">20</span><span class="o">-</span><span class="mi">4</span><span class="x">);</span>   <span class="c">#China-Old:  4/20 die</span>
                  <span class="n">ones</span><span class="x">(</span><span class="mi">1</span><span class="x">);</span><span class="n">zeros</span><span class="x">(</span><span class="mi">20</span><span class="o">-</span><span class="mi">1</span><span class="x">);</span>   <span class="c">#Italy-Young: 1/20 die</span>
                  <span class="n">ones</span><span class="x">(</span><span class="mi">12</span><span class="x">);</span><span class="n">zeros</span><span class="x">(</span><span class="mi">80</span><span class="o">-</span><span class="mi">12</span><span class="x">);</span> <span class="c">#Italy-Old: 12/80 die</span>
                  <span class="x">],</span> 
      <span class="n">Intercept</span> <span class="o">=</span> <span class="n">ones</span><span class="x">(</span><span class="n">N</span><span class="x">),</span> 
      <span class="n">Italy</span>     <span class="o">=</span> <span class="x">[</span><span class="n">zeros</span><span class="x">(</span><span class="mi">100</span><span class="x">);</span> <span class="n">ones</span><span class="x">(</span><span class="mi">100</span><span class="x">)],</span> 
      <span class="n">Age</span>       <span class="o">=</span> <span class="x">[</span><span class="n">zeros</span><span class="x">(</span><span class="mi">80</span><span class="x">);</span><span class="n">ones</span><span class="x">(</span><span class="mi">100</span><span class="o">-</span><span class="mi">80</span><span class="x">);</span> 
                   <span class="n">zeros</span><span class="x">(</span><span class="mi">20</span><span class="x">);</span><span class="n">ones</span><span class="x">(</span><span class="mi">100</span><span class="o">-</span><span class="mi">20</span><span class="x">);],</span>
      <span class="x">)</span>
  <span class="n">y</span> <span class="o">=</span> <span class="n">df</span><span class="o">.</span><span class="n">Y</span><span class="x">;</span>    </code></pre></figure>

<h2 id="estimate-cfr-conditional-on-nothingcountrycountry--age">Estimate CFR conditional on: nothing/country/country &amp; age</h2>
<p>1) Let’s estimate the <b>unconditional</b> probability of death from COVID-19 in this data: 
<br /> 
\(Y_{i} = \beta_{0} + \varepsilon_{i}\)</p>

<figure class="highlight"><pre><code class="language-julia" data-lang="julia"><span class="n">X</span> <span class="o">=</span> <span class="n">hcat</span><span class="x">(</span><span class="n">df</span><span class="o">.</span><span class="n">Intercept</span><span class="x">);</span>
<span class="n">β</span> <span class="o">=</span> <span class="n">X</span> <span class="o">\</span> <span class="n">y</span>   <span class="c"># 12.5%</span>
<span class="n">mean</span><span class="x">(</span><span class="n">y</span><span class="x">)</span>     <span class="c"># 12.5% </span></code></pre></figure>

<math xmlns="http://www.w3.org/1998/Math/MathML" display="block">
  <mtable columnalign="left left left" columnspacing="1em" rowspacing="4pt" columnlines="solid solid" rowlines="" frame="solid">
    <mtr>
      <mtd>
        <mi>P</mi>
        <mrow data-mjx-texclass="INNER">
          <mo data-mjx-texclass="OPEN">(</mo>
          <mtext>Death from COVID-19</mtext>
          <mo data-mjx-texclass="CLOSE">)</mo>
        </mrow>
        <mo>=</mo>
        <mn>12.5</mn>
        <mi mathvariant="normal">%</mi>
      </mtd>
    </mtr>
  </mtable>
</math>

<p>2) Let’s estimate the probability of death from COVID-19 <b>conditional only on country</b>: 
<br /> 
\(Y_{i} = \beta_{0} + \beta_{xy} X_{i} + \varepsilon_{i}\)</p>

<figure class="highlight"><pre><code class="language-julia" data-lang="julia"><span class="n">X</span> <span class="o">=</span> <span class="n">hcat</span><span class="x">(</span><span class="n">df</span><span class="o">.</span><span class="n">Intercept</span><span class="x">,</span> <span class="n">df</span><span class="o">.</span><span class="n">Italy</span><span class="x">);</span>
<span class="n">β</span> <span class="o">=</span> <span class="n">X</span> <span class="o">\</span> <span class="n">y</span>   
<span class="n">β</span><span class="x">[</span><span class="mi">1</span><span class="x">]</span>         <span class="c"># 12% = CFR in China</span>
<span class="n">β</span><span class="x">[</span><span class="mi">1</span><span class="x">]</span> <span class="o">+</span> <span class="n">β</span><span class="x">[</span><span class="mi">2</span><span class="x">]</span>  <span class="c"># 13% = CFR in Italy</span></code></pre></figure>

<math xmlns="http://www.w3.org/1998/Math/MathML" display="block">
  <mtable columnalign="left left left" columnspacing="1em" rowspacing="4pt" columnlines="solid solid" rowlines="solid" frame="solid">
    <mtr>
      <mtd>
        <mi>P</mi>
        <mrow data-mjx-texclass="INNER">
          <mo data-mjx-texclass="OPEN">(</mo>
          <mtext>Death from COVID-19&#xA0;</mtext>
          <mrow>
            <mo stretchy="false">|</mo>
          </mrow>
          <mtext>&#xA0;China</mtext>
          <mo data-mjx-texclass="CLOSE">)</mo>
        </mrow>
        <mo>=</mo>
        <mn>12</mn>
        <mi mathvariant="normal">%</mi>
      </mtd>
    </mtr>
    <mtr>
      <mtd>
        <mi>P</mi>
        <mrow data-mjx-texclass="INNER">
          <mo data-mjx-texclass="OPEN">(</mo>
          <mtext>Death from COVID-19&#xA0;</mtext>
          <mrow>
            <mo stretchy="false">|</mo>
          </mrow>
          <mtext>&#xA0;Italy</mtext>
          <mo data-mjx-texclass="CLOSE">)</mo>
        </mrow>
        <mo>=</mo>
        <mn>13</mn>
        <mi mathvariant="normal">%</mi>
      </mtd>
    </mtr>
  </mtable>
</math>
<p><br /></p>

<p>3) Let’s estimate the probability of death from COVID-19 <b>conditional on country and age</b>: 
<br /> 
\(Y_{i} = \beta_{0} + \beta_{xy} X_{i} + \beta_{zy} Z_{i} + \varepsilon_{i}\)</p>

<figure class="highlight"><pre><code class="language-julia" data-lang="julia"><span class="n">X</span> <span class="o">=</span> <span class="n">hcat</span><span class="x">(</span><span class="n">df</span><span class="o">.</span><span class="n">Intercept</span><span class="x">,</span> <span class="n">df</span><span class="o">.</span><span class="n">Italy</span><span class="x">,</span> <span class="n">df</span><span class="o">.</span><span class="n">Age</span><span class="x">);</span>
<span class="n">β</span> <span class="o">=</span> <span class="n">X</span> <span class="o">\</span> <span class="n">y</span>   
<span class="n">β</span><span class="x">[</span><span class="mi">1</span><span class="x">]</span>                <span class="c"># 10% = CFR for China-Young</span>
<span class="n">β</span><span class="x">[</span><span class="mi">1</span><span class="x">]</span> <span class="o">+</span> <span class="n">β</span><span class="x">[</span><span class="mi">3</span><span class="x">]</span>         <span class="c"># 20% = CFR for China-Old</span>
<span class="n">β</span><span class="x">[</span><span class="mi">1</span><span class="x">]</span> <span class="o">+</span> <span class="n">β</span><span class="x">[</span><span class="mi">2</span><span class="x">]</span>         <span class="c">#  5% = CFR for Italy-Young</span>
<span class="n">β</span><span class="x">[</span><span class="mi">1</span><span class="x">]</span> <span class="o">+</span> <span class="n">β</span><span class="x">[</span><span class="mi">2</span><span class="x">]</span> <span class="o">+</span> <span class="n">β</span><span class="x">[</span><span class="mi">3</span><span class="x">]</span>  <span class="c"># 15% = CFR for Italy-Old</span></code></pre></figure>

<p>Summarize $P\left( \text{Death from COVID-19 } | \text{ Country, Age} \right)$ in the following table:</p>
<math xmlns="http://www.w3.org/1998/Math/MathML" display="block">
  <mtable columnalign="left left left" columnspacing="1em" rowspacing="4pt" columnlines="solid solid" rowlines="solid solid" frame="solid">
    <mtr>
      <mtd></mtd>
      <mtd>
        <mtext>Young&#xA0;</mtext>
        <mo stretchy="false">(</mo>
        <msub>
          <mi>Z</mi>
          <mrow>
            <mi>i</mi>
          </mrow>
        </msub>
        <mo>=</mo>
        <mn>0</mn>
        <mo stretchy="false">)</mo>
      </mtd>
      <mtd>
        <mtext>Old&#xA0;</mtext>
        <mo stretchy="false">(</mo>
        <msub>
          <mi>Z</mi>
          <mrow>
            <mi>i</mi>
          </mrow>
        </msub>
        <mo>=</mo>
        <mn>1</mn>
        <mo stretchy="false">)</mo>
      </mtd>
    </mtr>
    <mtr>
      <mtd>
        <mtext>China&#xA0;</mtext>
        <mo stretchy="false">(</mo>
        <msub>
          <mi>X</mi>
          <mrow>
            <mi>i</mi>
          </mrow>
        </msub>
        <mo>=</mo>
        <mn>0</mn>
        <mo stretchy="false">)</mo>
      </mtd>
      <mtd>
        <mn>10</mn>
        <mi mathvariant="normal">%</mi>
      </mtd>
      <mtd>
        <mn>20</mn>
        <mi mathvariant="normal">%</mi>
      </mtd>
    </mtr>
    <mtr>
      <mtd>
        <mtext>Italy&#xA0;</mtext>
        <mo stretchy="false">(</mo>
        <msub>
          <mi>X</mi>
          <mrow>
            <mi>i</mi>
          </mrow>
        </msub>
        <mo>=</mo>
        <mn>1</mn>
        <mo stretchy="false">)</mo>
      </mtd>
      <mtd>
        <mn>5</mn>
        <mi mathvariant="normal">%</mi>
      </mtd>
      <mtd>
        <mn>15</mn>
        <mi mathvariant="normal">%</mi>
      </mtd>
    </mtr>
  </mtable>
</math>
<p><br /> 
Without conditioning on age, patients in Italy have a <b>1% higher</b> probability of Death than China (13% vs 12%). 
<br /> 
Conditioning on age, patients in Italy have a <b>5% lower</b> probability of Death than China within both age brackets.</p>

<h1 id="ovb">OVB</h1>
<p>Next we will show how Simpson’s paradox is a special case of OVB. 
<br />
Suppose the true model is:
\(Y_{i} = \beta_{0} + \beta_{xy} X_{i} + \beta_{zy} Z_{i} + \nu_{i}\)
<br />
Suppose you omit $Z_{i}$ and instead estimate:
\(Y_{i} = \beta_{0} + \beta_{xy} X_{i} + u_{i} \Rightarrow u_{i} = \beta_{zy} Z_{i} + \nu_{i}\)
<br />
Suppose $X_{i}$ predicts $Z_{i}$:
\(Z_{i} = \delta_{xz} X_{i} + w_{i} \Rightarrow \delta_{xz} = \frac{\sigma_{xz}}{\sigma_{x}^2} = \rho_{xz}\times \frac{\sigma_{z}}{\sigma_{x}}\)
<br />
Denote the OLS estimate (from the equation that omits age) $\hat{\beta}_{xy}$. 
<br />
We have: 
$E\left[ \hat{\beta}_{xy} | X_{i} \right] = \beta_{xy} + \underbrace{\delta_{xz} \beta_{zy}}_{\text{Bias}}$  (derivation below<sup id="fnref:bignote" role="doc-noteref"><a href="#fn:bignote" class="footnote" rel="footnote">1</a></sup>)
<br />
$
\text{Bias} = \delta_{xz} \beta_{zy} = \left( \rho_{xz}\times \frac{\sigma_{z}}{\sigma_{x}} \right)
\times 
\left( \rho_{zy}\times \frac{\sigma_{y}}{\sigma_{z}} \right) = \rho_{xz}\times \rho_{zy} \times \frac{\sigma_{y}}{\sigma_{x}} 
$
<br />
The bias is the product of 
(1) the impact of the treatment on the OV $\delta_{xz}$ 
and
(2) the impact of the OV on the outcome $\beta_{zy}$.
<br />
The estimate will be unbiased if either (1) the treatment is uncorrelated w/ the OV, 
or 
(2) the OV is uncorrelated w/ the outcome.</p>

<p>Simpson’s reversal occurs 
when the sign of the estimated coefficient switches after including the confounder
(when the bias is big enough in the opposite direction of the true effect): 
$\text{sign}\left( \hat{\beta}_{xy} \right) \neq \text{sign}\left( \beta_{xy} \right)$
$\Leftrightarrow$
$\text{sign}\left( \beta_{xy} + \delta_{xz} \beta_{zy}  \right) \neq \text{sign}\left( \beta_{xy} \right)$.</p>

<p>In our case, the true effect $\beta_{xy} = -5\%$ and the bias $\delta_{xz} \beta_{zy}=6\%$, the OVB is big enough to cause a reversal: 
<br />
    \(\begin{align*}
    \hat{\beta}_{xy}                         &amp;=  1\%                    &amp; \text{Non-causal effect, estimated when excluding Z}
    \\
    \beta_{xy}                               &amp;=  -5\%                   &amp; \text{Causal effect, estimated when including Z}
    \\
    \delta_{xz} \beta_{zy}                   &amp;= 60\% \times 10\% =6\%   &amp;= \text{Bias}
    \\
    \beta_{xy} + \delta_{xz} \beta_{zy}      &amp;= -5\% + 60\% \times 10\% &amp;= 1\%                     
    \\
    \end{align*}\)</p>

<h1 id="levels-of-interpretation">Levels of Interpretation</h1>
<p>Suppose we estimate: \(Y_{i} = \beta_{0} + \beta_{xy} X_{i} + \varepsilon_{i}\)
<br /><br />
<strong>Non-causal interpretation</strong> $\hat{\beta}_{xy} = 1\%$: the probability of a diagnosed patient 
dying from COVID-19 is 1% higher in Italy than China.
<br />
<strong>Assumption 1</strong>: the Chinese and Italian data was correctly measured and reported.
<br />
Note: the assumption required for the non-causal interpretation is relatively mild. 
<br /> <br />
<strong>Causal interpretation</strong> $\hat{\beta}_{xy} = 1\%$: 
if we <strong><em>intervene</em></strong> and move a diagnosed patient from China to Italy,
the probability of the patient dying from COVID-19 will be 1% higher in Italy.
<br />
<strong>Assumption 1</strong>: the Chinese and Italian data was correctly measured and reported.
<br />
<strong>Assumption 2</strong>: the “treatment” (China vs Italy) is uncorrelated with unobserved determinants of survival. 
This is the famous CMI assumption: $E\left[ \varepsilon | X \right] = 0$.
<br />
Note: the identifying assumption (CMI) required for a causal interpretation is very strong. 
In general treatments are often correlated with variables which are also correlated with the outcome. 
In this case, the confounder is age, Italy’s population is older than China’s. 
<br /> <br />
In general each reader can decide how convinced he is with the identifying assumption and thus how to interpret an estimate. 
Importantly, non-causal estimates are often still very useful in contexts where our goal is to make predictions.</p>

<h1 id="additional-practice">Additional Practice</h1>
<p>The true DGP above assumed the treatment effect was the same across age bins:
\(Y_{i} = \beta_{0} + \beta_{xy} X_{i} + \beta_{zy} Z_{i} + \nu_{i}\)
<br /> 
Thus the CFR was $\beta_{xy} = -5\%$ lower for both young and old patients in Italy. 
<br /> 
Suppose there was treatment effect heterogeneity and the true DGP was: 
<br />
\(Y_{i} = \beta_{0} + \beta_{xy} X_{i} + \beta_{zy} Z_{i} + \beta_{xzy} X_{i} Z_{i} + \nu_{i}\)
<br />
In this case, estimating the model omitting the interaction effect (omitted non-linearity) 
would also cause OVB.</p>

<div class="footnotes" role="doc-endnotes">
  <ol>
    <li id="fn:bignote" role="doc-endnote">
      <p>To derive the bias, 
slightly abuse notation by stacking a column of ones and $X_{i}$ into a matrix “X”, 
and stack $\beta_{0}$ and $\beta_{xy}$ into $\beta$:     <br />
\(\begin{align*}
\hat{\beta} &amp;= (X'X)^{-1} X'Y                                                      \\
            &amp;= (X'X)^{-1} X'(X\beta + Z\beta_{zy} + \nu_{i})                       \\
            &amp;= \beta + (X'X)^{-1} X'Z \beta_{zy} + (X'X)^{-1} X'Z \nu_{i}          \\
\delta_{xz} &amp;\equiv  (X'X)^{-1} X'Z                                                \\
\hat{\beta} &amp;= \beta + \delta_{xz} \beta_{zy} + \delta_{xz} \nu_{i}                \\
E\left( \hat{\beta} | X \right) &amp;= \beta + \delta_{xz} \beta_{zy}                  \\
                                &amp;  
\end{align*}\) 
<br /> <a href="#fnref:bignote" class="reversefootnote" role="doc-backlink">&#8617;</a></p>
    </li>
  </ol>
</div>]]></content><author><name>Albert Alex Zevelev</name></author><category term="Causality" /><category term="Econometrics" /><category term="Statistics" /><summary type="html"><![CDATA[The goal of this post is to illustrate a point made in a recent tweet by Amit Ghandi that Simpson’s Paradox is a special case of omitted variable bias.]]></summary></entry></feed>