forked from shibing624/python-tutorial
-
Notifications
You must be signed in to change notification settings - Fork 0
Expand file tree
/
Copy pathmnist_label.py
More file actions
207 lines (136 loc) · 6.46 KB
/
mnist_label.py
File metadata and controls
207 lines (136 loc) · 6.46 KB
1
2
3
4
5
6
7
8
9
10
11
12
13
14
15
16
17
18
19
20
21
22
23
24
25
26
27
28
29
30
31
32
33
34
35
36
37
38
39
40
41
42
43
44
45
46
47
48
49
50
51
52
53
54
55
56
57
58
59
60
61
62
63
64
65
66
67
68
69
70
71
72
73
74
75
76
77
78
79
80
81
82
83
84
85
86
87
88
89
90
91
92
93
94
95
96
97
98
99
100
101
102
103
104
105
106
107
108
109
110
111
112
113
114
115
116
117
118
119
120
121
122
123
124
125
126
127
128
129
130
131
132
133
134
135
136
137
138
139
140
141
142
143
144
145
146
147
148
149
150
151
152
153
154
155
156
157
158
159
160
161
162
163
164
165
166
167
168
169
170
171
172
173
174
175
176
177
178
179
180
181
182
183
184
185
186
187
188
189
190
191
192
193
194
195
196
197
198
199
200
201
202
203
204
205
206
207
#!/usr/bin/env python
# coding: utf-8
# # 准备工作
# In[1]:
# 若要在binder中执行这个notebook,请先执行下面的指令来安装依赖包
# !pip install scikit-learn numpy pandas matplotlib
# 假设我们正要完成手写数字识别的任务。我们可以使用著名的mnist数据集来训练这样的机器学习模型。
# In[2]:
import numpy as np
import pandas as pd
import matplotlib.pyplot as plt
np.random.seed(1) # reproduce the result
import warnings
warnings.filterwarnings("ignore")
from sklearn.datasets import load_digits
# In[3]:
digits = load_digits()
print(digits.data.shape)
# 总共有1797个数字,每个数字使用一个64维的向量表示
# In[6]:
plt.gray()
plt.matshow(digits.images[8])
plt.show()
# In[7]:
x = digits.data
y = digits.target
# # 效果检验
# 先来看看使用完全数据集训练的模型能够达到什么样的效果(这里暂不区分训练测试集)
# In[8]:
from sklearn.linear_model import LogisticRegression
clf = LogisticRegression()
clf.fit(x, y)
clf.score(x, y)
# 然而,要想得到完全数据,我们需要标注1797个数字,这是比较吃力的。这还只是一个很小的玩具数据集,对于更大的数据集,数量级数以百万计,我们又怎能标的过来?
#
# 那么,我们能不能**只标注一小部分数据**,比如说3%(50个数字左右),让它也达到不错的效果?看看效果如何。
# In[9]:
clf2 = LogisticRegression()
chosen_ids = np.random.choice(range(len(x)), 50, replace=False)
clf2.fit(x[chosen_ids], y[chosen_ids])
clf2.score(x, y)
# 效果下降了很多,这还只是一个简单的任务,对于更难的任务模型的表现还会更差,那么我们就没有办法节省劳动力(偷懒)了吗?
#
# 非也,我们还有**主动学习**。
# # 主动学习
# 何谓主动学习?这里我采用一种通俗的讲法:
#
# 想象你面对百万大军,要想打败他们未必需要将其全部剿灭,有时只需要斩其**上将**首级即可。
#
# 主动学习做的,就是帮助我们找到那个“上将”,解决重点问题,达到事半功倍的效果。看下面的图:
# 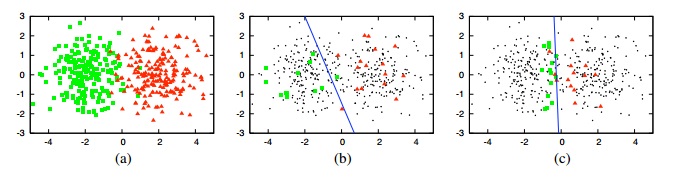
# 左图中红绿代表两种数据。现在我们只能标注其中有限个数据来训练分类器。中间的图显示的就是随机标注的样本和得到的分界线,准确率大约为70%。而右图就是主动学习方法找到的标注点,因为这些点几乎构成了完美分界线的边界,所以使用与中图同样的样本数,它能够取得90%左右的准确率!
# 那么我们怎么找到这些关键的点呢?让我们从上例来考虑,上面找到的标注点都在中间区域,实际上都是相对比较**容易混淆的、难以确定类别的**样本。我们的目标就是找到这些样本。**分类器的预测概率**就可以帮助我们衡量这些特性,于是就有了下面的寻找策略:
# - **RS策略**:随机选择,作为对照。
# - **LC策略**:寻找分类器最没有信心的预测样本,即预测的最可能类别的概率也很低的样本。
# - **BT策略**:寻找分类器最“左右为难”的预测样本,即预测的最可能的两个类别的概率很接近的样本。
# 下面用代码实验和验证这些策略的效果:
#
# 我们进行10批5个样本的标注,对于不同策略选出的样本,使用直接抽取已知标签的方法来模拟手动标注。来看看随着标注的进行,模型的表现如何改善,以及其最终的效果。
#
# In[11]:
batch_size = 5
rounds = 10
# In[12]:
def RS(proba, batch_size):
return np.random.choice(range(proba.shape[0]), batch_size, replace=False)
def LC(proba, batch_size):
return np.argsort(np.max(proba, axis=1))[:batch_size]
def BT(proba, batch_size):
sorted_proba = np.sort(proba, axis=1)
return np.argsort(sorted_proba[:, -1] - sorted_proba[:, -2])[:batch_size]
# In[13]:
strategies = {"RS": RS, "LC": LC, "BT": BT}
results = {"RS": [], "LC": [], "BT": []}
for type0 in strategies:
clf = LogisticRegression()
anno_batch = RS(x, batch_size) # 第一批标注样本只能随机选取
x_train = x[anno_batch]
y_train = y[anno_batch]
for i in range(rounds - 1):
clf.fit(x_train, y_train)
prec = clf.score(x, y)
results[type0].append(prec)
proba = clf.predict_proba(x)
stategy0 = strategies[type0] # 后面采用不同策略
anno_batch = stategy0(proba, batch_size)
x_train = np.concatenate([x_train, x[anno_batch]])
y_train = np.concatenate([y_train, y[anno_batch]])
prec = clf.score(x, y)
results[type0].append(prec)
# In[14]:
pd.DataFrame(results).plot()
plt.ylabel("Accuracy")
plt.xlabel("epoches")
plt.show()
# 以上只是一次随机实验的结果,会受每一批的具体样本影响而有一些波动。不过进行多次实验也可以看到,两种主动学习方法利用同样多的样本,却能够达到接近90%的准确率。确实比RS更胜一筹,我们可以使用这个技术来降低达到一定准确度所需的标注量。妈妈再也不用担心我手动标注数据的辛苦了!
# # 体验手动标注
# 下面我也写了一段真正手动标注数据的代码,有兴趣的也不妨亲身尝试一下,用可以接受的时间量标注,打造出一个表现良好的模型:
# In[15]:
from IPython import display
def human_annotate(batch_ids):
ret = []
plt.gray()
for id0 in batch_ids:
fig0 = plt.figure(figsize=(1, 1))
plt.matshow(digits.images[id0], fignum=0)
plt.show()
ret.append(int(input("请输入这个样本的标签:")))
display.clear_output(wait=True) # 动态刷新输出
return np.array(ret)
# In[16]:
batch_size = 5
rounds = 3
results = []
clf = LogisticRegression()
anno_batch = RS(proba, batch_size)
x_train = x[anno_batch]
y_train = human_annotate(anno_batch)
for i in range(rounds - 1):
clf.fit(x_train, y_train)
prec = clf.score(x, y)
print(f"round {i}, prec:{prec}")
results.append(prec)
proba = clf.predict_proba(x)
sorted_proba = np.sort(proba, axis=1)
anno_batch = BT(proba, batch_size)
x_train = np.concatenate([x_train, x[anno_batch]])
y_train = np.concatenate([y_train, human_annotate(anno_batch)])
clf.fit(x_train, y_train)
prec = clf.score(x, y)
print(f"round {rounds}, prec:{prec}")
results.append(prec)
pd.Series(results).plot()
plt.ylabel("Accuracy")
plt.xlabel("human label round")
plt.show()