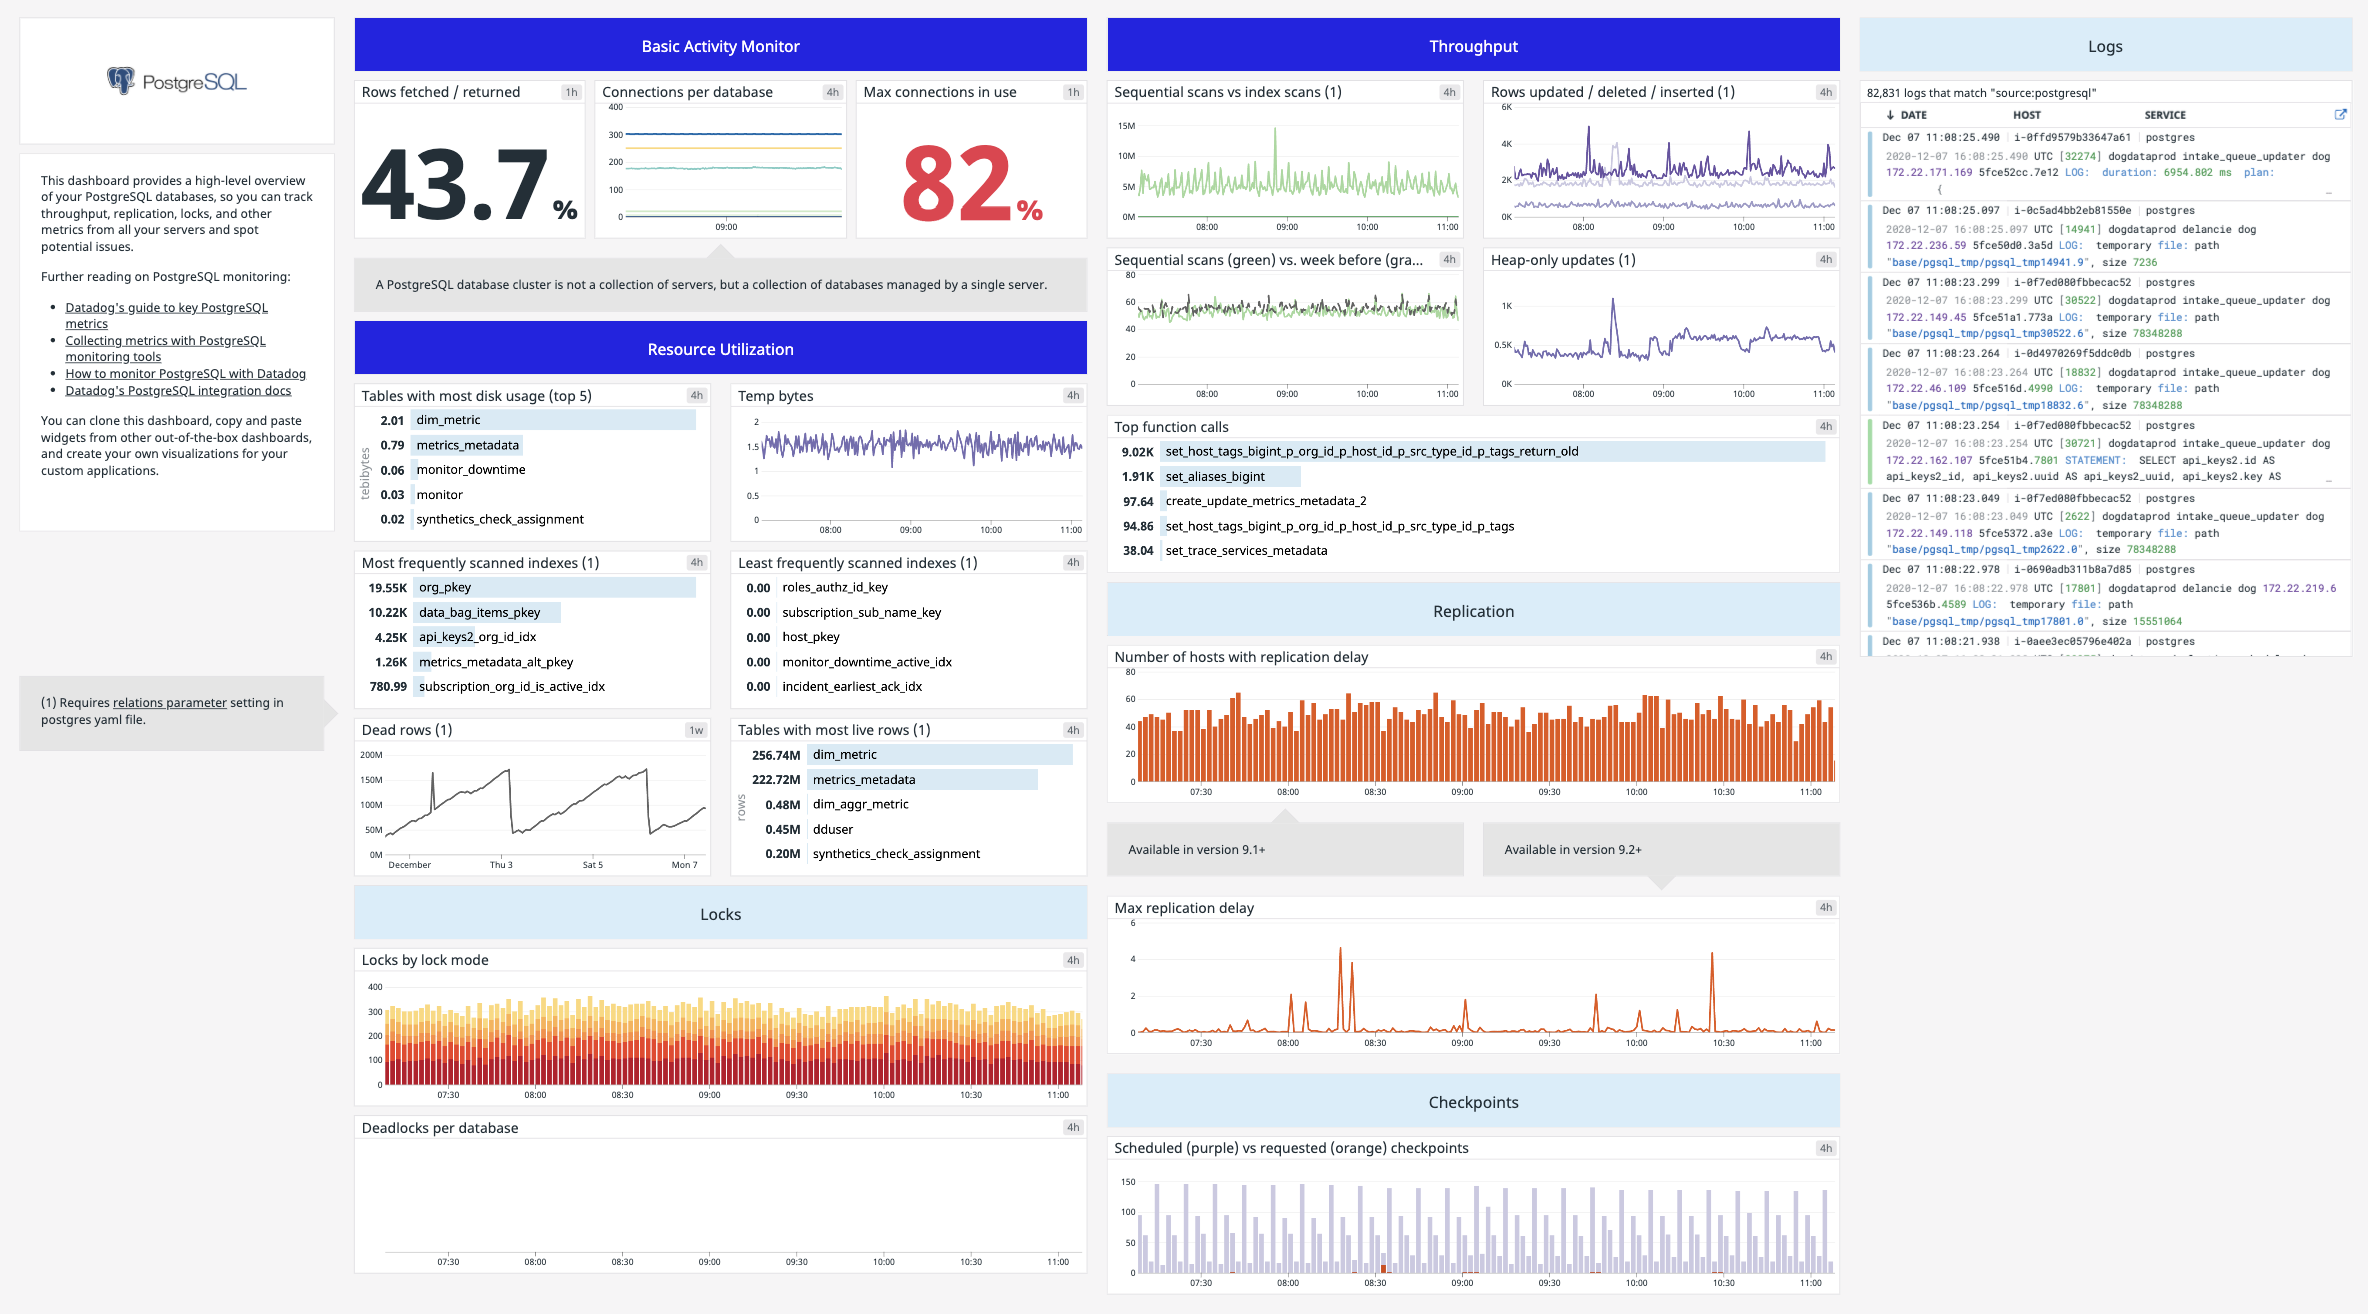
Get metrics from the PostgreSQL service in real time to:
- Visualize and monitor PostgreSQL states
- Received notifications about PostgreSQL failovers and events
The PostgreSQL check is packaged with the Agent. To start gathering your PostgreSQL metrics and logs, install the Agent.
Edit the postgres.d/conf.yaml file, in the conf.d/ folder at the root of your Agent's configuration directory to start collecting your PostgreSQL metrics and logs. See the sample postgres.d/conf.yaml for all available configuration options.
To get started with the PostgreSQL integration, create a read-only datadog user with proper access to your PostgreSQL server. Start psql on your PostgreSQL database and run:
For PostgreSQL version 10 and above:
create user datadog with password '<PASSWORD>';
grant pg_monitor to datadog;
For older PostgreSQL versions:
create user datadog with password '<PASSWORD>';
grant SELECT ON pg_stat_database to datadog;
Note: When generating custom metrics that require querying additional tables, you may need to grant the CONNECT permission on those tables to the datadog user.
To verify the permissions are correct, run the following command:
psql -h localhost -U datadog postgres -c \
"select * from pg_stat_database LIMIT(1);" \
&& echo -e "\e[0;32mPostgres connection - OK\e[0m" \
|| echo -e "\e[0;31mCannot connect to Postgres\e[0m"
When it prompts for a password, enter the one used in the first command.
- Edit the
postgres.d/conf.yamlfile to point to your server / port and set the masters to monitor. See the sample postgres.d/conf.yaml for all available configuration options.
| Option | Required | Description |
|---|---|---|
username |
No | The user account used to collect metrics, created in the Installation section above. |
password |
No | The password for the user account. |
dbname |
No | The name of the database you want to monitor. |
ssl |
No | Defaults to False. Indicates whether to use an SSL connection. |
use_psycopg2 |
No | Defaults to False. Setting this option to True forces the Datadog Agent to collect PostgreSQL metrics using psycopg2 instead of pg8000. Note: pyscopg2 does not support SSL connections. |
tags |
No | A list of tags applied to all metrics collected. Tags may be simple strings or key-value pairs. |
relations |
No | By default, all schemas are included. Add specific schemas here to collect metrics for schema relations. Each relation generates 10 metrics and an additional 10 metrics per index. |
collect_function_metrics |
No | Collect metrics regarding PL/pgSQL functions from pg_stat_user_functions. |
collect_count_metrics |
No | Collect count metrics. The default value is True for backward compatibility, but this might be slow. The recommended value is False. |
collect_activity_metrics |
No | Defaults to False. Collect metrics regarding transactions from pg_stat_activity. Make sure the user has sufficient privileges to read from pg_stat_activity before enabling this option. |
collect_database_size_metrics |
Yes | Collect database size metrics. Default value is True but this might be slow with large databases. |
collect_default_database |
No | Defaults to False. Include statistics from the default database postgres in the check metrics. |
For PostgreSQL versions 9.6 and below, run the following and create a SECURITY DEFINER to read from pg_stat_activity.
CREATE FUNCTION pg_stat_activity() RETURNS SETOF pg_catalog.pg_stat_activity AS
$$ SELECT * from pg_catalog.pg_stat_activity; $$
LANGUAGE sql VOLATILE SECURITY DEFINER;

CREATE VIEW pg_stat_activity_dd AS SELECT * FROM pg_stat_activity();
grant SELECT ON pg_stat_activity_dd to datadog;
- Restart the Agent to start sending PostgreSQL metrics to Datadog.
PostgreSQL default logging is to stderr and logs do not include detailed information. It is recommended to log into a file with additional details specified in the log line prefix.
-
Edit your PostgreSQL configuration file
/etc/postgresql/<version>/main/postgresql.confand uncomment the following parameter in the log section:logging_collector = on log_directory = 'pg_log' # directory where log files are written, # can be absolute or relative to PGDATA log_filename = 'pg.log' #log file name, can include pattern log_statement = 'all' #log all queries log_line_prefix= '%m [%p] %d %a %u %h %c ' log_file_mode = 0644 ## For Windows #log_destination = 'eventlog' -
Collecting logs is disabled by default in the Datadog Agent, enable it in
datadog.yaml:logs_enabled: true -
Add this configuration block to your
postgres.d/conf.yamlfile to start collecting your PostgreSQL logs:
logs:
    - type: file
      path: /var/log/pg_log/pg.log
      source: postgresql
      sourcecategory: database
      service: myapp
      #To handle multi line that starts with yyyy-mm-dd use the following pattern
      #log_processing_rules:
      #  - type: multi_line
      #    pattern: \d{4}\-(0?[1-9]|1[012])\-(0?[1-9]|[12][0-9]|3[01])
      #    name: new_log_start_with_date
-
Change the
serviceandpathparameter values to configure for your environment. See the sample postgres.d/conf.yaml for all available configuration options.
Learn more about log collection in the log documentation
Run the Agent's status subcommand and look for postgres under the Checks section.
Some of the metrics listed below require additional configuration, see the sample postgres.d/conf.yaml for all configurable options.
See metadata.csv for a list of metrics provided by this integration.
The PostgreSQL check does not include any events.
postgres.can_connect
Returns CRITICAL if the Agent is unable to connect to the monitored PostgreSQL instance. Returns OK otherwise.
Additional helpful documentation, links, and articles: