This post isn’t a dunk. It’s a practical map of where Kibana reporting shines, where it predictably breaks, and what teams do when they hit the wall.
What Kibana Reporting actually is (so expectations are accurate)
Kibana’s PDF/PNG reporting is built around rendering what you see on screen into an export. Under the hood, reports are generated on the Kibana server as background jobs coordinated through Elasticsearch documents.
And the rendering itself is based on headless Chromium (Kibana manages Chromium binaries and drives the browser for screenshotting / PDF exports).
This architecture implies two important truths:
- Reporting inherits UI fragility. If the UI struggles to render a view reliably, reporting will struggle too.
- Reporting is “what’s on the screen,” not “what’s true.” It’s a presentation capture mechanism, not a semantic reporting engine.
Reporting inherits UI fragility. If the UI struggles to render a view reliably, reporting will struggle too.
Reporting is “what’s on the screen,” not “what’s true.” It’s a presentation capture mechanism, not a semantic reporting engine.
That’s fine—until your use case is not a screenshot.
The first failure: reporting is static, but operations are comparative
Most reporting needs are comparative:
- “Did error rate change since last week?”
- “Is this spike new or just seasonality?”
- “Only notify if the KPI moved materially.”
- “Send the PDF only if something significant changed.”
“Did error rate change since last week?”
“Is this spike new or just seasonality?”
“Only notify if the KPI moved materially.”
“Send the PDF only if something significant changed.”
Kibana reporting doesn’t have a native concept of diffing between runs, conditional delivery, or “what changed since last export.” It creates a PDF/PNG of the current dashboard state.
Elastic’s own wording around reporting reinforces this “what you see” model: PDF reports are tied directly to what is seen on screen.
Why this matters: In real teams, attention is the scarce resource. Static scheduled PDFs quickly become noise—people stop reading them because they don’t answer the question “why am I being pinged?”
The second failure: large dashboards don’t export cleanly
If your dashboards are small and tidy, Kibana reporting can be smooth. But real dashboards aren’t always small and tidy—especially in mid-market orgs where dashboards become living shared artifacts.
Elastic’s own troubleshooting guidance acknowledges that large pixel counts (big dashboards, lots of panels) can demand more memory/CPU and suggests splitting dashboards into smaller artifacts.
In practice, teams run into:
- PDFs with unusable pagination or layout
- Panels stretched, clipped, or missing
- “For printing” exports that time out or format awkwardly
PDFs with unusable pagination or layout
Panels stretched, clipped, or missing
“For printing” exports that time out or format awkwardly
These aren’t hypothetical. Community reports describe large dashboards producing a single giant unprintable page or poorly paginated PDFs with cut-off / stretched visualizations.
And for truly huge canvases or dashboards, people end up increasing memory and timeouts dramatically and still failing—because you’re essentially asking a headless browser to deterministically render a complex app view into a document.
The third failure: timeouts and “max attempts reached” become your operational burden
When reporting fails, Kibana surfaces errors like “Max attempts reached.” Elastic documents two common causes:
- The export spans a large amount of data and Kibana hits xpack.reporting.queue.timeout
- Reverse-proxy / server settings are not configured correctly
The export spans a large amount of data and Kibana hits xpack.reporting.queue.timeout
Reverse-proxy / server settings are not configured correctly
This reveals a hidden cost: your team becomes the operator of a rendering farm.
Instead of “schedule report,” your backlog becomes:
- tuning queue timeouts
- tuning capture timeouts
- resizing dashboards
- splitting dashboards
- debugging reverse proxy edge cases
- chasing nondeterministic Chromium issues
tuning queue timeouts
tuning capture timeouts
resizing dashboards
splitting dashboards
debugging reverse proxy edge cases
chasing nondeterministic Chromium issues
That’s not reporting. That’s maintaining an internal PDF renderer.
The fourth failure: “reporting” and “alerting” don’t naturally fit together
Kibana alerting is solid for what it’s built to do: create rules against Elasticsearch data and send actions through connectors. Elastic positions it as a consistent interface across use cases, with integrations and scripting available.
But alerting and reporting live in different mental models:
- Alerts are about signals: something crossed a threshold, a rule matched, an anomaly score tripped.
- Reports are about communication: what changed, what it means, and what to do.
Alerts are about signals: something crossed a threshold, a rule matched, an anomaly score tripped.
Reports are about communication: what changed, what it means, and what to do.
You can send an alert to Slack. You can attach a PDF. But Kibana doesn’t give you a first-class, built-in way to reliably produce human-ready, contextual, change-aware narratives (because its primitives are rules and screenshots).
So teams either:
- spam alerts (and burn attention), or
- schedule reports (and hope people read them), or
- manually add context (and burn engineering time)
spam alerts (and burn attention), or
schedule reports (and hope people read them), or
manually add context (and burn engineering time)
The fifth failure: compliance and audit evidence needs “immutability,” not “a screenshot today”
For compliance, the question is rarely “what does the dashboard look like right now?”
It’s:
- “What was true on that date?”
- “Can you prove it wasn’t tampered with?”
- “Can you show consistent evidence collection over time?”
“What was true on that date?”
“Can you prove it wasn’t tampered with?”
“Can you show consistent evidence collection over time?”
Kibana reporting can generate PDFs, but it’s not designed as a compliance evidence pipeline. If you’re in a regulated environment, you’ll feel the gap quickly: lack of run-to-run comparison, lack of explicit evidence controls, and the ease with which dashboards change after the fact.
(If you’re already collecting screenshots into a GRC folder manually, you know exactly what this costs.)
Common workarounds teams use (and what they cost)
These are the patterns that appear again and again once Kibana reporting doesn’t fit.
1) “Split the dashboard”
This is even recommended in Elastic troubleshooting guidance.
Cost: redesign work and fractured storytelling. People lose the “single pane” view that made the dashboard valuable.
2) “Tune timeouts / memory / reverse proxy”
Elastic explicitly points at timeout settings like xpack.reporting.queue.timeout when exports fail.
Cost: ongoing ops toil. Reporting becomes another service to babysit.
3) “Use Canvas for paginated layouts”
Some teams rebuild reports in Canvas because it gives more control over page-like layouts (and community responses often point users there).
Cost: now you’re maintaining two artifacts: operational dashboards and report layouts.
4) “Write custom Puppeteer scripts”
This works—because Kibana itself uses a headless browser approach.
Cost: brittle scripts, auth headaches, constant UI changes breaking automation.
5) “Buy a reporting add-on”
There’s a whole ecosystem of third-party Kibana reporting tools that exist for a eason: teams want scheduled delivery, fewer license constraints, and more control.
Cost: additional platform, integration, and security review—plus you still often end up with static screenshots.
A decision framework: when Kibana reporting is enough vs. when it isn’t
Kibana reporting is usually enough if:
- You export small-to-medium dashboards
- You’re okay with static PDFs/PNGs
- You don’t need cross-tool reporting
- “Send every Monday” is acceptable even when nothing changed
You export small-to-medium dashboards
You’re okay with static PDFs/PNGs
You don’t need cross-tool reporting
“Send every Monday” is acceptable even when nothing changed
You’ve outgrown Kibana reporting if:
- Stakeholders ask “what changed?” more than “what is it?”
- Reports are frequently failing on large dashboards (timeouts/layout)
- You need conditional delivery (only notify on meaningful change)
- You need compliance-ready evidence artifacts
- Your reality is multi-tool (Kibana + Grafana + SaaS + internal UIs)
Stakeholders ask “what changed?” more than “what is it?”
Reports are frequently failing on large dashboards (timeouts/layout)
You need conditional delivery (only notify on meaningful change)
You need compliance-ready evidence artifacts
Your reality is multi-tool (Kibana + Grafana + SaaS + internal UIs)
This isn’t a moral failing of Kibana. It’s just not what Kibana reporting was designed to be.
What a “modern reporting layer” needs (the missing primitives)
If you’re designing for real-world reporting needs, these primitives matter:
- Conditional reporting“Only send if KPI moved by X”“Only send if visual changed”
- “Only send if KPI moved by X”
- “Only send if visual changed”
- Run-to-run diffdetect change, summarize deltas, highlight what matters
- detect change, summarize deltas, highlight what matters
- Narrative contextexplain “why this matters,” not just present charts
- explain “why this matters,” not just present charts
- Multi-source supportauthenticated web UIs + APIs, not just one stack
- authenticated web UIs + APIs, not just one stack
- Operational reliabilityreporting should not require you to become a Chromium SRE
- reporting should not require you to become a Chromium SRE
Conditional reporting
- “Only send if KPI moved by X”
- “Only send if visual changed”
“Only send if KPI moved by X”
“Only send if visual changed”
Run-to-run diff
- detect change, summarize deltas, highlight what matters
detect change, summarize deltas, highlight what matters
Narrative context
- explain “why this matters,” not just present charts
explain “why this matters,” not just present charts
Multi-source support
- authenticated web UIs + APIs, not just one stack
authenticated web UIs + APIs, not just one stack
Operational reliability
- reporting should not require you to become a Chromium SRE
reporting should not require you to become a Chromium SRE
Kibana reporting gives you the screenshot. Many teams need the communication system.
The missing layer: change-aware reporting
What Kibana lacks isn’t another export format.It’s a layer that understands change over time.
Teams that move past screenshot-based reporting introduce a thin reporting layer that:
- captures dashboards or data at regular intervals
- compares current state to previous runs
- generates reports only when something meaningfully changes
- adds minimal narrative context for humans
captures dashboards or data at regular intervals
compares current state to previous runs
generates reports only when something meaningfully changes
adds minimal narrative context for humans
Crucially, this layer does not replace Kibana.
Kibana remains the system of exploration.The reporting layer becomes the system of communication.
Once teams adopt this pattern, reporting stops being noisy—and starts being trusted.
]]>- Capture the Kibana Discover's hits count integer value of the last hour
- Capture the same, but for the last 24 hours
- Use the "calculate" action to obtain the hourly mean hit count over the past 24h
- Use the "conditional block" action to compare the last hour reading to the 24h mean
- If the difference is less than 20%, don't send the alert
Capture the Kibana Discover's hits count integer value of the last hour
Capture the same, but for the last 24 hours
Use the "calculate" action to obtain the hourly mean hit count over the past 24h
Use the "conditional block" action to compare the last hour reading to the 24h mean
If the difference is less than 20%, don't send the alert
This example is by default included in the job templates in any new installation of Anaphora.
]]>Example1: send a report after comparing values from two websites
- Capture a string/numeric value from a website
- Capture numeric/string value from another website
- Compare the two
- Skip sending the report if condition is met
Capture a string/numeric value from a website
Capture numeric/string value from another website
Compare the two
Skip sending the report if condition is met
Example2: alert if a numeric reading is above/below a threshold
This is useful for brute force attack detection, or any other alerts about high log event count over time.
- Capture Kibana discovery query results “count” for the last hour
- Compare if this value is > 1 million
- Send the report (notify the system admin)
Capture Kibana discovery query results “count” for the last hour
Compare if this value is > 1 million
Send the report (notify the system admin)
]]>- Save time by anticipating some common tasks
- Pre-bake some company-branded PDF templates
- Reuse the boilerplate of a login process to a particular website
Save time by anticipating some common tasks
Pre-bake some company-branded PDF templates
Reuse the boilerplate of a login process to a particular website
You can create unlimited templates. You can also promote a job to become a template.


Make your PDF report look professional
You can now make your PDF prettier by adding a page background (PNG, SVG, solid colors, gradients, etc). Trick: use lower opacity to watermark the background!
]]>A space is a virtual container of Jobs and Delivery Interfaces. Users and roles can be associated to a number of spaces via permissions of any access levels between read-only, read-write, or Admin.

Moving resources across spaces
Users that have admin access level to 2 or more spaces can copy resources across between spaces
Navigate to settings > system settings to find all the available authentication and authorization connectors configurations.

LDAP
We support LDAP from the major open source LDAP server implementations like OpenLDAP or LemonLDAP, but also Microsoft Active Directory Domain Services (AD DS), IBM Security Directory Server, etc.
SAML
SAML SSO 2.0 is available to connect to your enterprise centralised authentication, it works with Keycloak, Azure ADFS, Okta, One Login, and many others.
OIDC
OpenID Connect support is finally added! Keycloak is our reference implementation, but this one is a real passepartout for the world of the internet.
You can also get the debug files containing the browser internal state, so it’s easier for us to support you when things are hard to debug.

No danger of getting spammed, as a maximum notification frequency can be set.
Alternatively, you can use the REST API to monitor the green, yellow, red state of each job.
]]>Common Failure Scenarios
1. Blank Screen Captures
Symptoms:
  - White/black screen in output
  - Missing dashboard elements
  - Incomplete rendering

Solutions:
  - Increase wait time
  - Check viewport size
  - Verify CSS selectors
2. Authentication Issues
- Session timeouts
- Invalid credentials
- SAML/SSO problems
- Cookie management
3. Performance Problems
- Browser memory limits
- Network timeouts
- Resource constraints
- Concurrent job limits
Diagnostic Steps
-
Check Browser Logs
// Example log pattern [ERROR] Failed to load resource: net::ERR_CONNECTION_TIMED_OUT -
Verify Network Access
- Dashboard accessibility
- Proxy settings
- Firewall rules
- SSL certificates
-
Review Resource Usage
- Memory consumption
- CPU utilization
- Network bandwidth
- Disk space
Advanced Troubleshooting
Browser Configuration
chromium_flags:
  - --disable-gpu
  - --no-sandbox
  - --disable-dev-shm-usage
  - --window-size=1920,1080
Network Settings
- Connection timeouts
- Retry attempts
- Keep-alive settings
- DNS resolution
Memory Management
- Clear browser cache
- Adjust memory limits
- Monitor swap usage
- Optimize concurrent jobs
Common Solutions
For Blank Screens
- Increase page load timeout
- Add explicit wait conditions
- Check JavaScript errors
- Verify CSS selectors
For Authentication
- Update credentials
- Check SSO configuration
- Manage cookie persistence
- Verify token expiration
For Performance
- Optimize dashboard
- Reduce capture frequency
- Adjust resource limits
- Scale infrastructure
Prevention Tips
Regular Maintenance
- Update browser versions
- Clear temporary files
- Monitor system resources
- Test authentication
Best Practices
- Use explicit selectors
- Set appropriate timeouts
- Monitor job queues
- Implement retry logic
Debug Mode
Enable debug mode for detailed logs:
docker run -e DEBUG=true beshultd/anaphora
Debug output includes:
- Browser console logs
- Network requests
- Resource timing
- Error stack traces
Getting Support
If issues persist:
- Collect debug logs
- Document reproduction steps
- Check system requirements
- Contact our support team
Need more help? Join our community forum for expert assistance.
]]>Anaphora provides powerful tools to monitor your reporting jobs. This guide covers everything you need to know about job monitoring and management.
The Jobs Dashboard
The Jobs dashboard is your command center for monitoring all reporting activities:
- Active Jobs: Currently running reports
- Scheduled Jobs: Upcoming automated reports
- Completed Jobs: Successfully delivered reports
- Failed Jobs: Reports that encountered errors
Understanding Job States
Jobs in Anaphora can be in several states:
PENDING: Waiting to start
RUNNING: Currently executing
COMPLETED: Successfully finished
FAILED: Encountered an error
PAUSED: Temporarily suspended
Monitoring Features
Real-time Status
- Live progress indicators
- Current step visualization
- Time elapsed/remaining estimates
Job Details
- Capture configuration
- Delivery settings
- Schedule information
- Resource usage
Health Metrics
- Success/failure rates
- Average completion time
- Resource utilization
- Delivery performance
Setting Up Alerts
Configure notifications for:
- Job completion
- Execution failures
- Performance issues
- Resource constraints
Best Practices
Regular Monitoring
- Check the dashboard daily
- Review failure patterns
- Monitor resource usage
- Track delivery success rates
Performance Optimization
- Stagger job schedules
- Set appropriate timeouts
- Monitor memory usage
- Optimize capture settings
Troubleshooting Tips
- Check job logs
- Verify configurations
- Test network connectivity
- Validate credentials
Advanced Monitoring
API Integration
# Example API call to check job status
response = requests.get(
    'https://your-anaphora/api/v1/jobs/status',
    headers={'Authorization': 'Bearer YOUR_TOKEN'}
)
Custom Dashboards
Create personalized views:
- Team-specific metrics
- Department reports
- Client dashboards
Maintenance Tasks
Regular maintenance ensures smooth operation:
- Archive old reports
- Clean up failed jobs
- Update schedules
- Rotate credentials
Need help? Check our troubleshooting guide or contact support.
]]>Prerequisites
Before we begin, make sure you have:
- Docker installed
- Access to Kibana (you can use the demo instance of Kibana at https://demo.elastic.co/)
Installation
Getting started with Anaphora is simple:
docker run --name=anaphora -p 3000:3000 --rm -d beshultd/anaphora
Then visit http://localhost:3000 and log in with:
- Username:
admin - Password:
admin
Creating Your First Report
- Click "New Job" in the Anaphora dashboard
- Choose a job template or start with a plain one
- Select "Visualizations" as your snapshot capture type
- Click "Test Capture" to preview
- Proceed to the compose screen to customize your report
Next Steps
Go to composer and start creating your first report!
Here you can rows and columns to your report.

Pages can have custom backgrounds, like a logo or a large image.
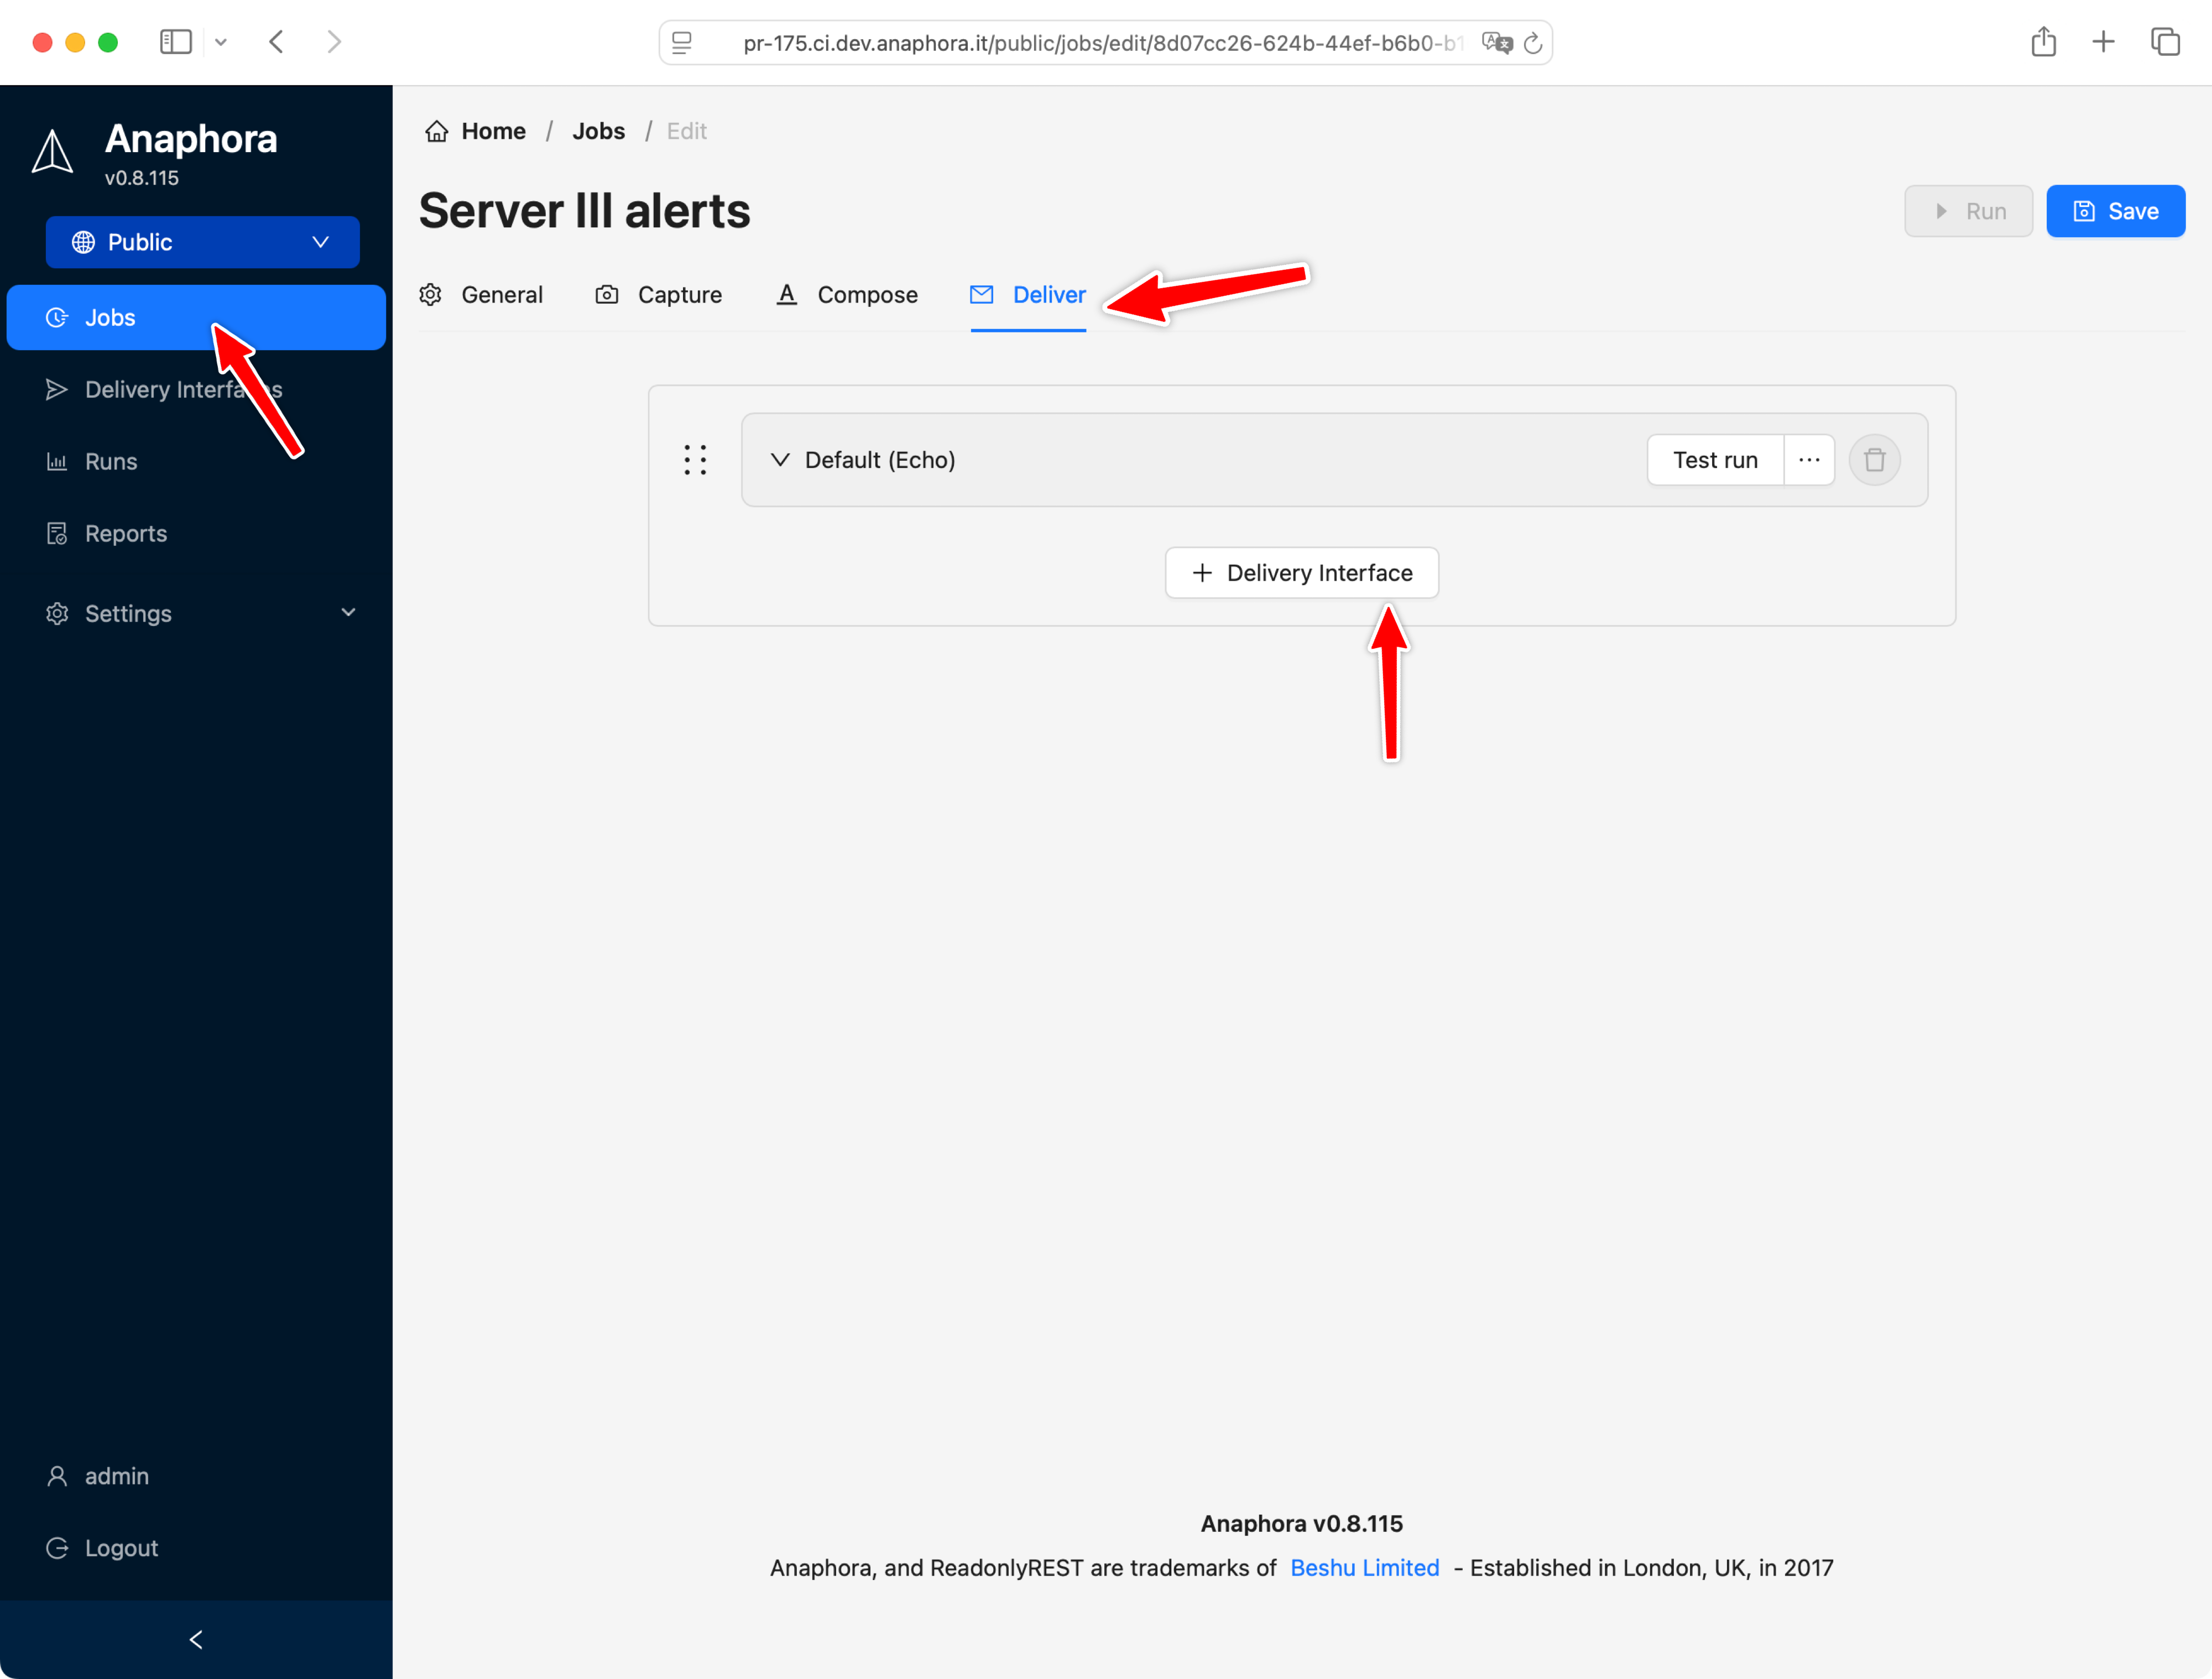
Next, let's go to the deliver screen, where you can specify where to send your report.
Testing without a real delivery interface
By default a newly created Job will have assigned a dummy delivery interface. This is very useful for testing, and creating jobs right away without first going through configuring the details of a real delivery interface.
Creating a real delivery interface
Anaphora supports many delivery protocols, SMTP, S3, Webhook (i.e. for Mattermost chat), Slack, Mailgun, and more to come.
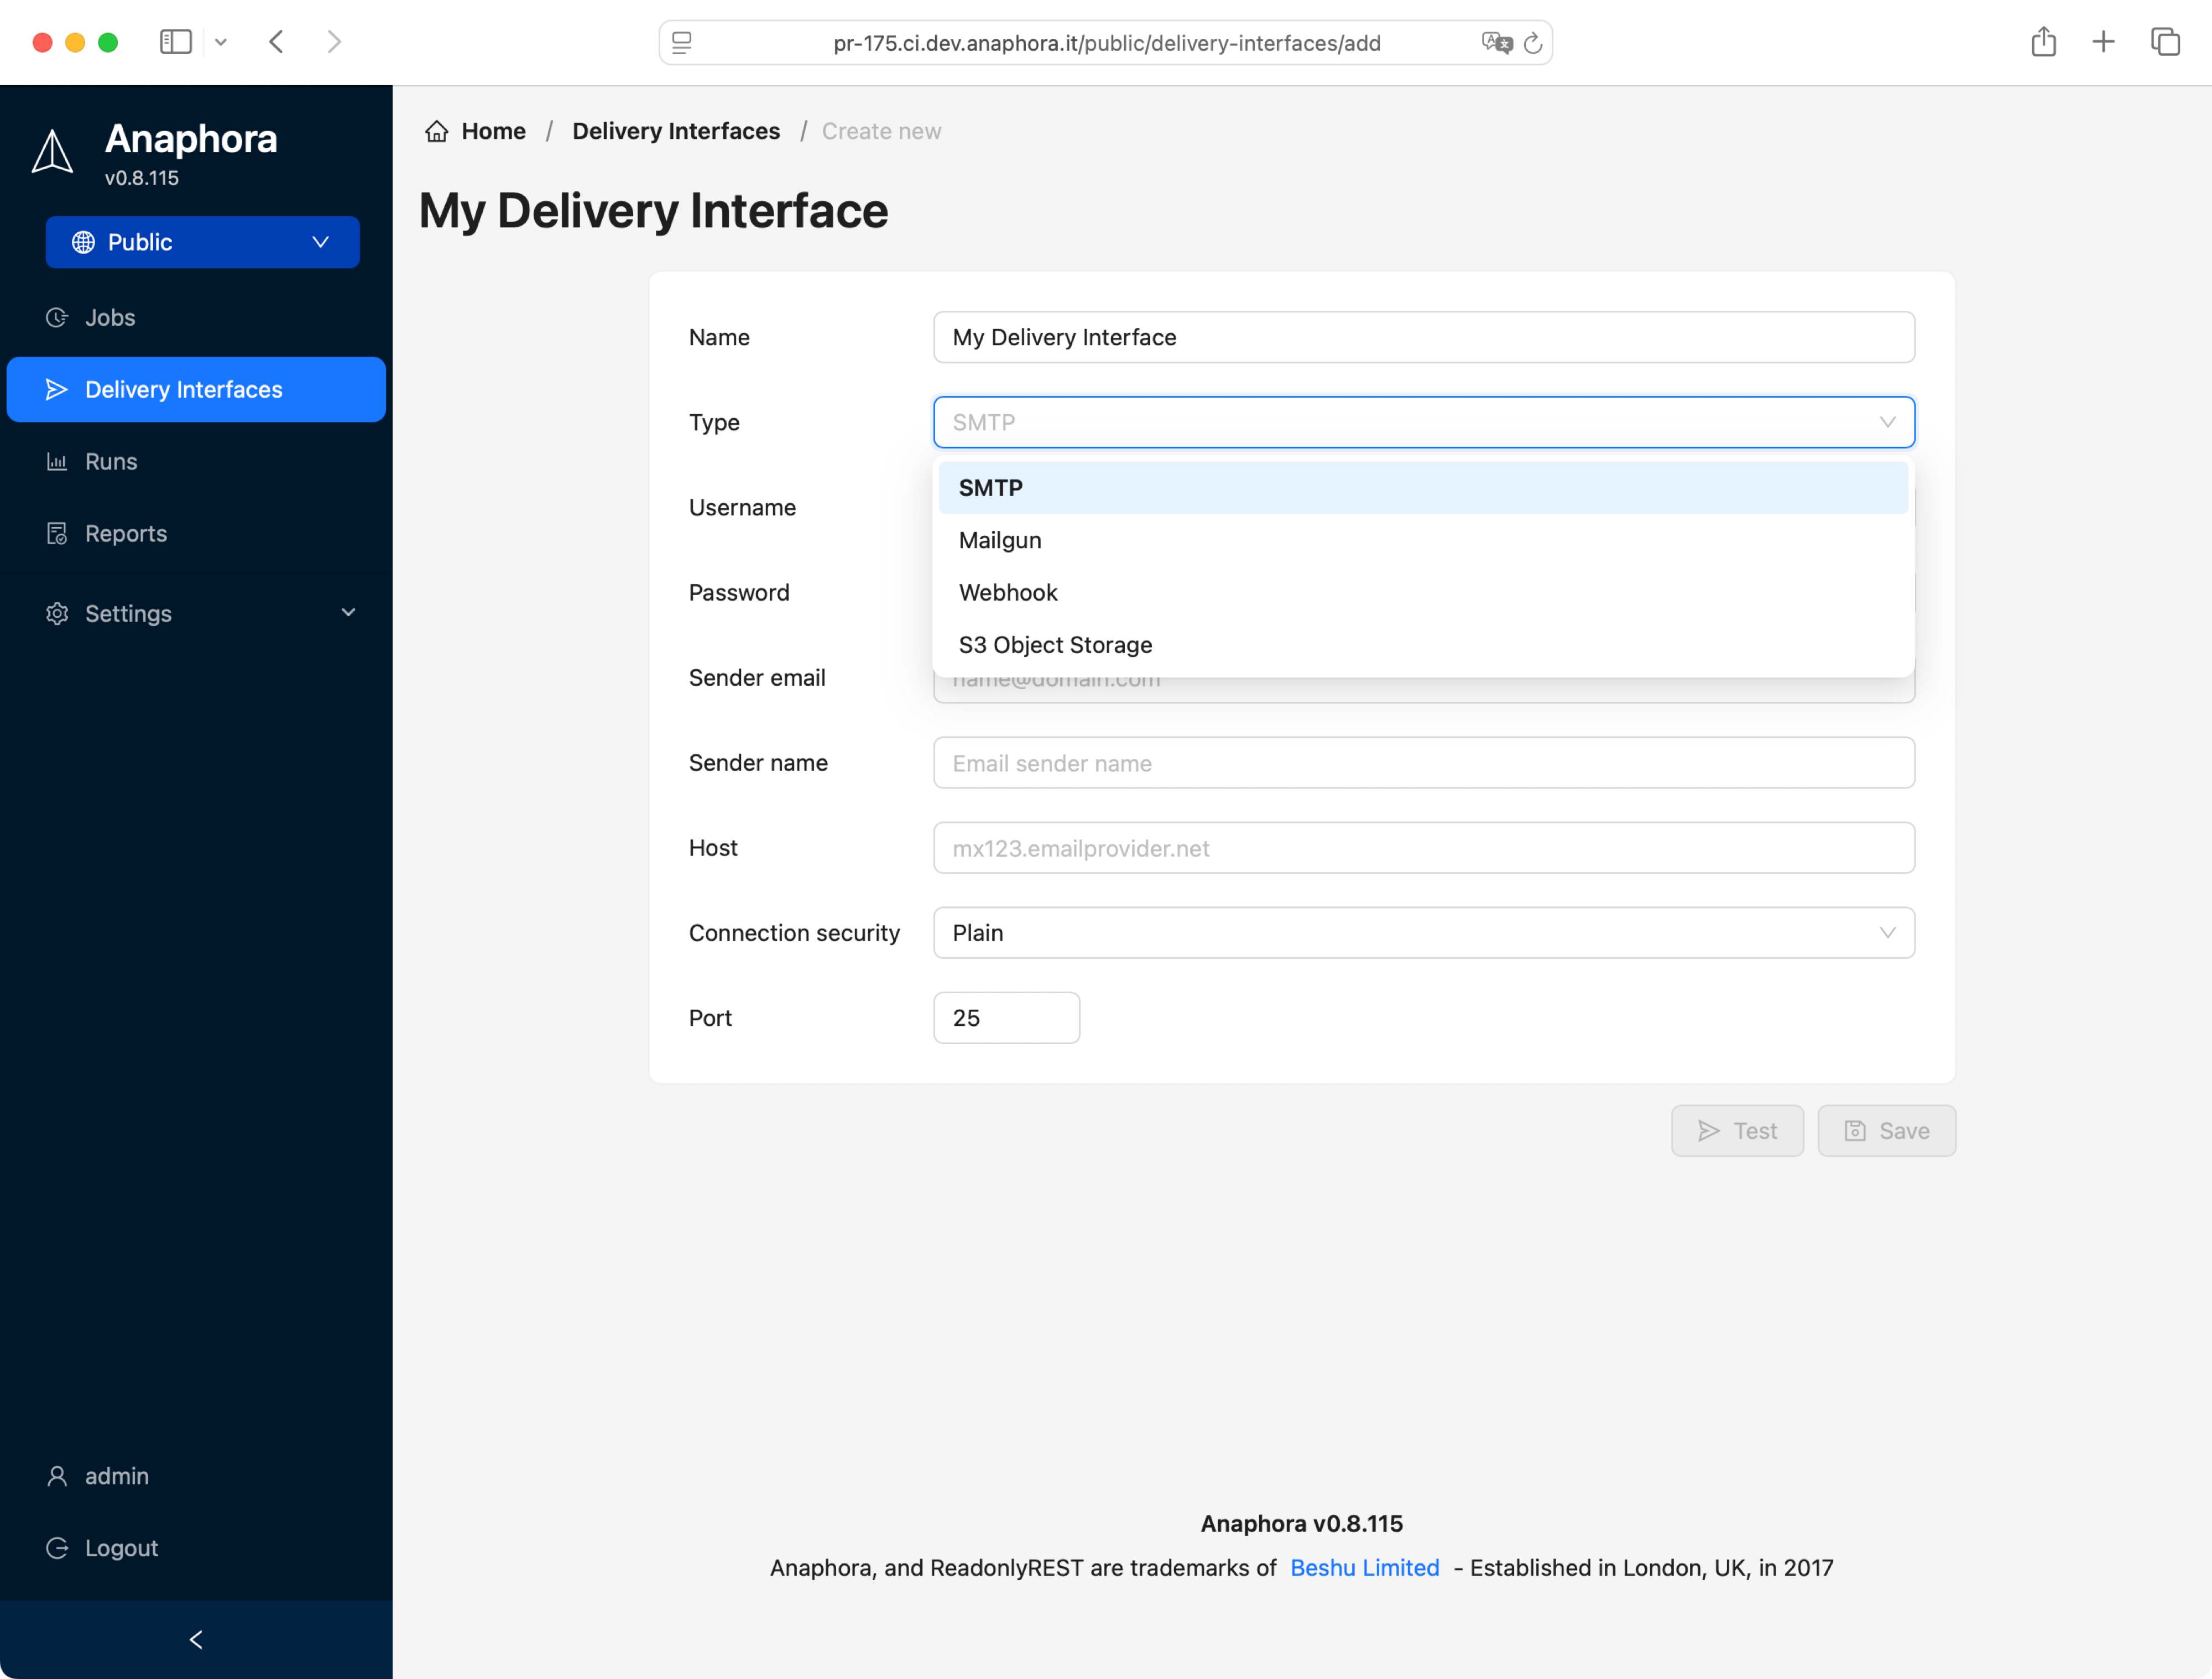
This time, let's select the SMTP interface, here is what to set up:

You can test your configuration straigth away using the included test feature

If your email was received, you can go back to the Job configuration and assign the new DI to the job.
Recap
In this guide, we covered:
- Quick installation using Docker with a single command
- Creating your first report by selecting visualization captures
- Using the composer to create a customized eport with rows, columns, and backgrounds
- Previewing the resulting PDF with a dummy delivery interface
- Setting up real delivery interfaces like SMTP, S3, Webhook, Slack, and Mailgun
- Configuring and testing an SMTP delivery interface
- Assigning delivery interfaces to your jobs
With these basics, you're ready to start creating and sharing professional reports from your Kibana dashboards.
]]>S3 delivery interface
ready made template jobs
better PDF composer
“Calculate” capture step: for math expressions on variables
Max notification interval (no spam)

- Kibana Connector waits for Dashboard to be fully loaded
- New action: wait an arbitrary amount of time before continue
- Templates: Logo upload, color theme and default font
Kibana Connector waits for Dashboard to be fully loaded
New action: wait an arbitrary amount of time before continue
Templates: Logo upload, color theme and default font
Fixed
- When testing, capture will output the correct error message on wrong credentials
- Cron job not triggering correctly
When testing, capture will output the correct error message on wrong credentials
Cron job not triggering correctly
]]>