This is Part 3 of the short history of Tableau, inspired by huge success of TC15. Previous blogposts can be found here (Part 1, self-intro): https://apandre.wordpress.com/2015/10/24/tableau-self-intro-2003-7/ and Part 2 (catching-up) here: https://apandre.wordpress.com/2015/11/08/tableau-catching-up-2008-10/ . After reviewing this article I have to acknowledge that the big contributor to Tableau success was (in addition to Tableau itself) … Qliktech. Judge it for yourself:
6.0. July 2010. Qliktech’s IPO created $2B-$3B public company, legitimized the Data Visualization Market and proved that traditional BI tools (like Microstrategy, Cognos and Business Objects) are in deep decline. In short it created the fertile ground for future (2013, 3 years after QLIK’s IPO) Tableau’s IPO. Please note (see chart below) that QLIK’s YoY growth was below 100% even in pre-IPO years (as oppose to much faster YoY growth for Tableau).
 6.0. October 2010. Around 10/10/10 the Qliktech released Qlikview 10 which sets the high bar for Data Visualization competitors and only 2 of them were able to pass it: Spotfire and Tableau.

6.0. January 2011. Success of Qlikview 10 convinced the BI thought leader Mr. Donald Farmer to leave Microsoft for leading role @Qliktech and for exciting opportunity to define the future of Qliktech’s products.

In my humble opinion Donald led (of course it was team “efforts”) Qliktech from the winning product (Qlikview) to cool, wonderful but losing product (Qlik.Next or Qlik Sense) and unintentionally helped Tableau to become a leader and the winner. It was amusing to see that Donald’s title changed from VP of Product Management to VP of “Innovation and Design” approximately the same time when Qlik Sense was initially released (summer of 2014).
6.1. November 2011. Around 11/11/11 the Qliktech released Qlikview 11, which turned to be the last functional update of Qlikview until December of 2015, when Qlikview 12 was finally released after 4 years of unjustifiable and self-defeating delays.
7.0. December 2012. Qlikview 12 was not released on 12/12/12 as expected (that was huge gift to Tableau). Instead Qliktech started the development of new product Qlik.Next (much later released as Qlik Sense) in hope that it will replace Qlikview and Qlikview community will migrate to Qlik Sense.
8.0. May 2013. Tableau’s IPO created initially $3+B public company, which quickly double its capitalization and become the leader of Data Visualization market. Tableau was and is only company on this market, who was able to keep 75%-100% (or more) YoY growth for many years until 2015.
8.0. October 2013. In its self-defeating announcement Qliktech declared it is not in rush to release Qlikview 12 and instead it will focus it development on Qlik.Next (which will be eventually released as Qlik Sense), completely yielding the leadership position (in Data Visualization market) to Tableau, see part 4 of this series. That announcement convinced me to stop comparing (at least on my blog) “leading” Data Visualization products – since the release of Tableau 8.1 (new leader in my opinion) in November of 2013 everybody else was just trying to catch-up and so far Tableau managed to be ahead of competition.
6.1. August 2011. Tableau 6.1 introduced the “mobile BI” in form of iPad app (that created bad Tableau’s habit to ignore more popular Android as mobile environment) and support of mobile Safari browser.
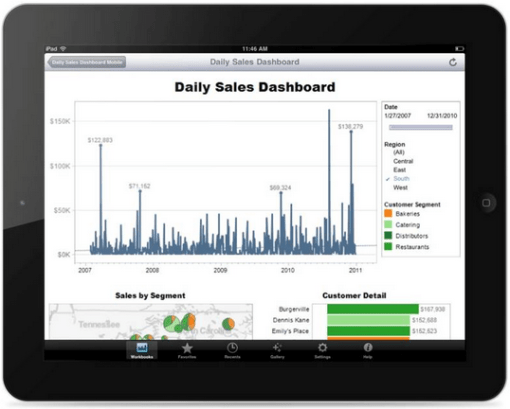
Tableau 6.1 Server views are automatically touch-enabled and filters, parameters, pages and even highlighting all accommodate finger selection and resized accordingly, all scrollable areas can be dynamically scrolled with a finger swipe, all zoomable areas like maps can be zoomed in or out by pinching the screen.
In version 6.1 Tableau added localization to French and German; postcodes for AUS, CA, FR, Germany, NZ and out codes for UK; Pan and Zoom inside maps; Custom layout legends; Links on dashboard images etc.
Tableau wrote own text file parser which is faster than previously used JET parser; new parser can work with files of any size as oppose to 4GB limit, imposed by JET. Version 6.1 added the ability to append data extract from file:
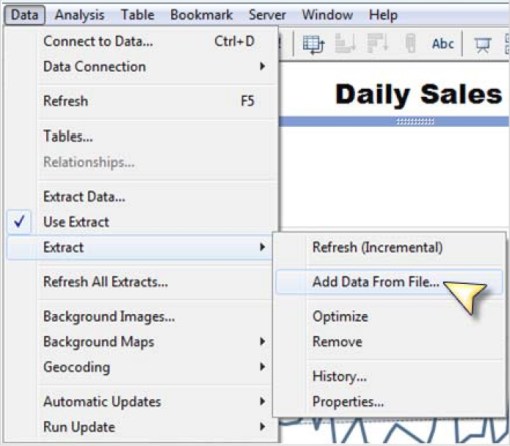
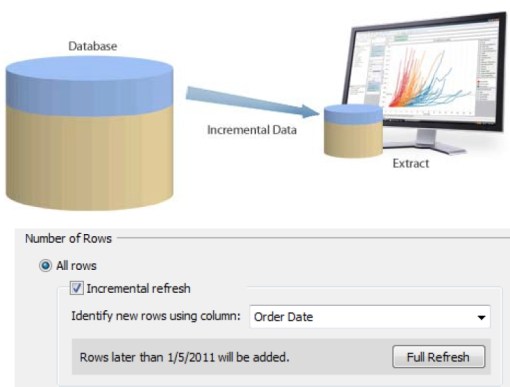
enables an incremental refresh of data extract by adding only new records from data source by identifying new rows by some special (preferably containing only unique values for each record) data field, like timestamp:
and added the ability to refresh (in one operation) all data extracts used in workbook (very useful).
7.0. January 2012. Tableau 7.0 added new chart types like area charts, filled and wrapped maps, parameter functions, new statistical capabilities (for example t-values and p-values for trend modeling, exponential modeling for trend lines, summary stats, confidence bands), NULL values management.
Version 7 introduced Data Server, which allows the publication of shared data extracts, pass-through data connections and metadata, central location for all data sources, easy management of schedules for data extracts. Tableau server 7.0 supports now multi-tenancy in form of multiple sites where sites users, workbooks and data separated by site “firewalls”.
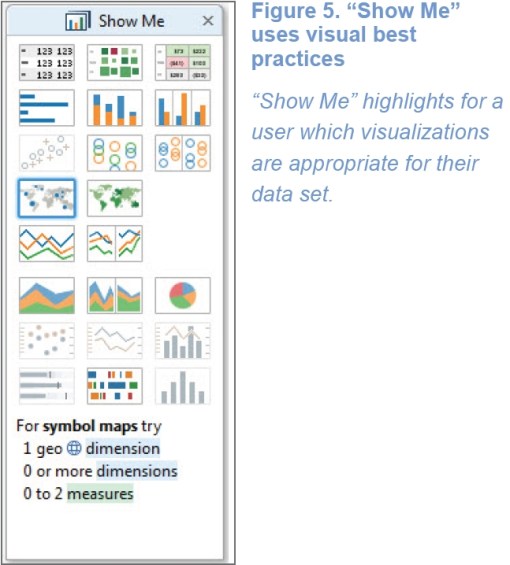
Tableau 7.0 added “Show Me” Dialog box:
8.0. March 2013. Among new features in Tableau 8.0: Web and Mobile Authoring/Editing: http://www.tableau.com/new-features/drag-and-drop-editing , support for local rendering, filtering, highlighting and even local URL actions:

Tableau Server now dynamically determines where to best perform rendering and interactive updates – on the server or in your local browser. Tableau decides on-the-fly whether it will be faster to perform actions right in your browser with local rendering, or query Tableau Server. This behavior is automatic, so you don’t have to think about it. Local rendering can speed up your analysis dramatically, especially when on a slow connection to Tableau Server.
Tableau 8 provides an application programming interface (API) to enable developers to directly create a Tableau Data Extract (TDE) file.
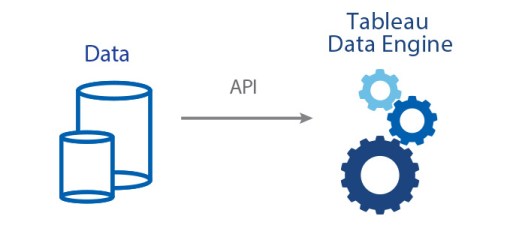
The API works with C/C++, Java, and Python and can be used from Windows. Developers can use this API to generate TDE files from on-premise software and software-as-a-service. Tableau can then connect natively to these extract files. After you open a TDE file in Tableau Desktop, you can publish the extract to Tableau Server. This API lets you systematically get data into Tableau when there is not a native connector to the data source you are using. You can explore the Tableau Data Extract API documentation and get started by downloading the API itself , also see
8.0. July 2013 – Tableau Online: see spec and demos here: http://www.tableau.com/products/cloud-bi and video overview is here:
and here:
Tableau intentionally limited its cloud product to workgroup usage with 100 GB total per account storage, shared between limited number of users ($500 per user per year). Tableau sales openly suggesting that Tableau online can be used by group with no more than 35 users.


