https://meetingorganizer.copernicus.org/EGU21/session/41078
Environmental changes in terrestrial ecosystems and coastal areas across the Arctic can only be fully addressed by using remote sensing observations and modelling. However, due to the multiscale complexity of the landscape, to limitations related to illumination and atmospheric conditions, bridging the gap between field and satellite observations remains a major challenge. Contributions may include, but not limited to, recent advances in instrumentation and methodology for
validation and calibration of remote sensing products, applications of joint use of in situ and satellite records to tackle science questions, demonstrate the utility of UAV for bridging the scale gap, progress for standardization (protocols) or reviewing challenges.
We specifically welcome contributions within the framework of T-MOSAiC. T-MOSAiC is an IASC pan-Arctic, land-based program. The objective of T-MOSAiC is to coordinate activities that will both aid and benefit from MOSAiC (especially the modelling components) by extending the work to the lands surrounding the Arctic Ocean and to the northern communities who live on those lands.
The Remote Sensing Action Group of T-MOSAiC
(https://www.t-mosaic.com/remote.html) aims at shortening the path between field scientists and the remote sensing community, by increasing the availability of calibration and validation data at the circumpolar scale. The action group makes use of UAV and satellite data collected with different sensors and to improve the data and models that address issues such as: permafrost characteristics, thaw lake dynamics, coastal erosion, vegetation community dynamics and infrastructure.
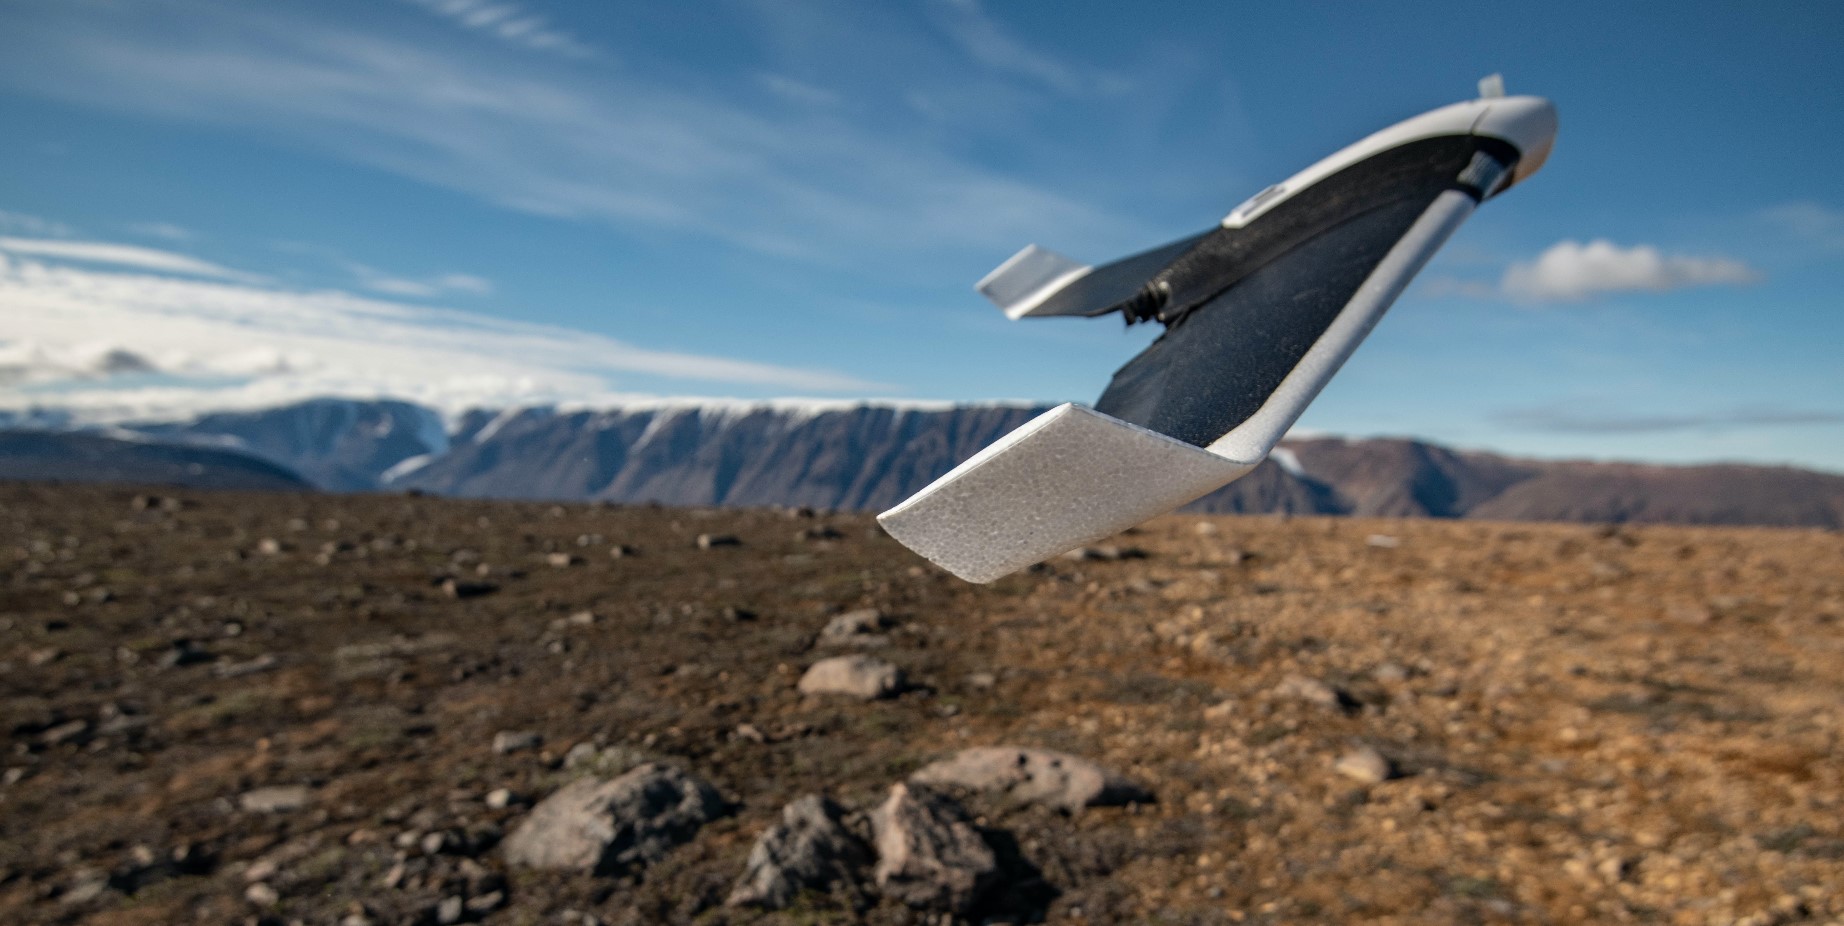
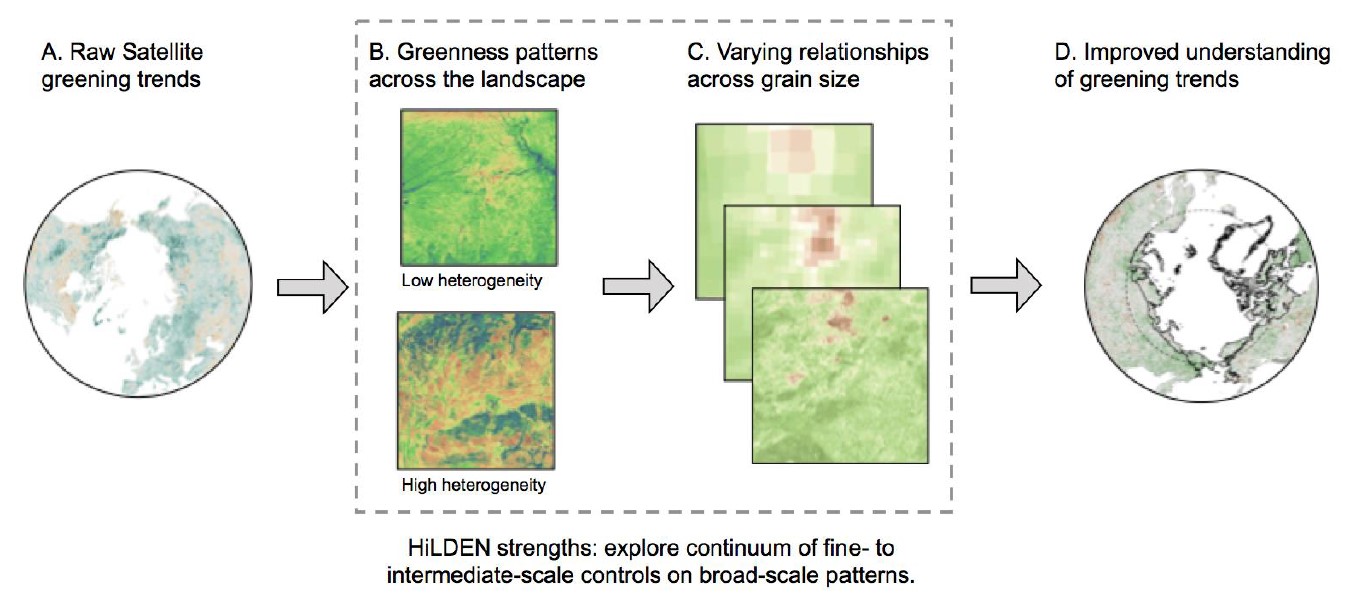
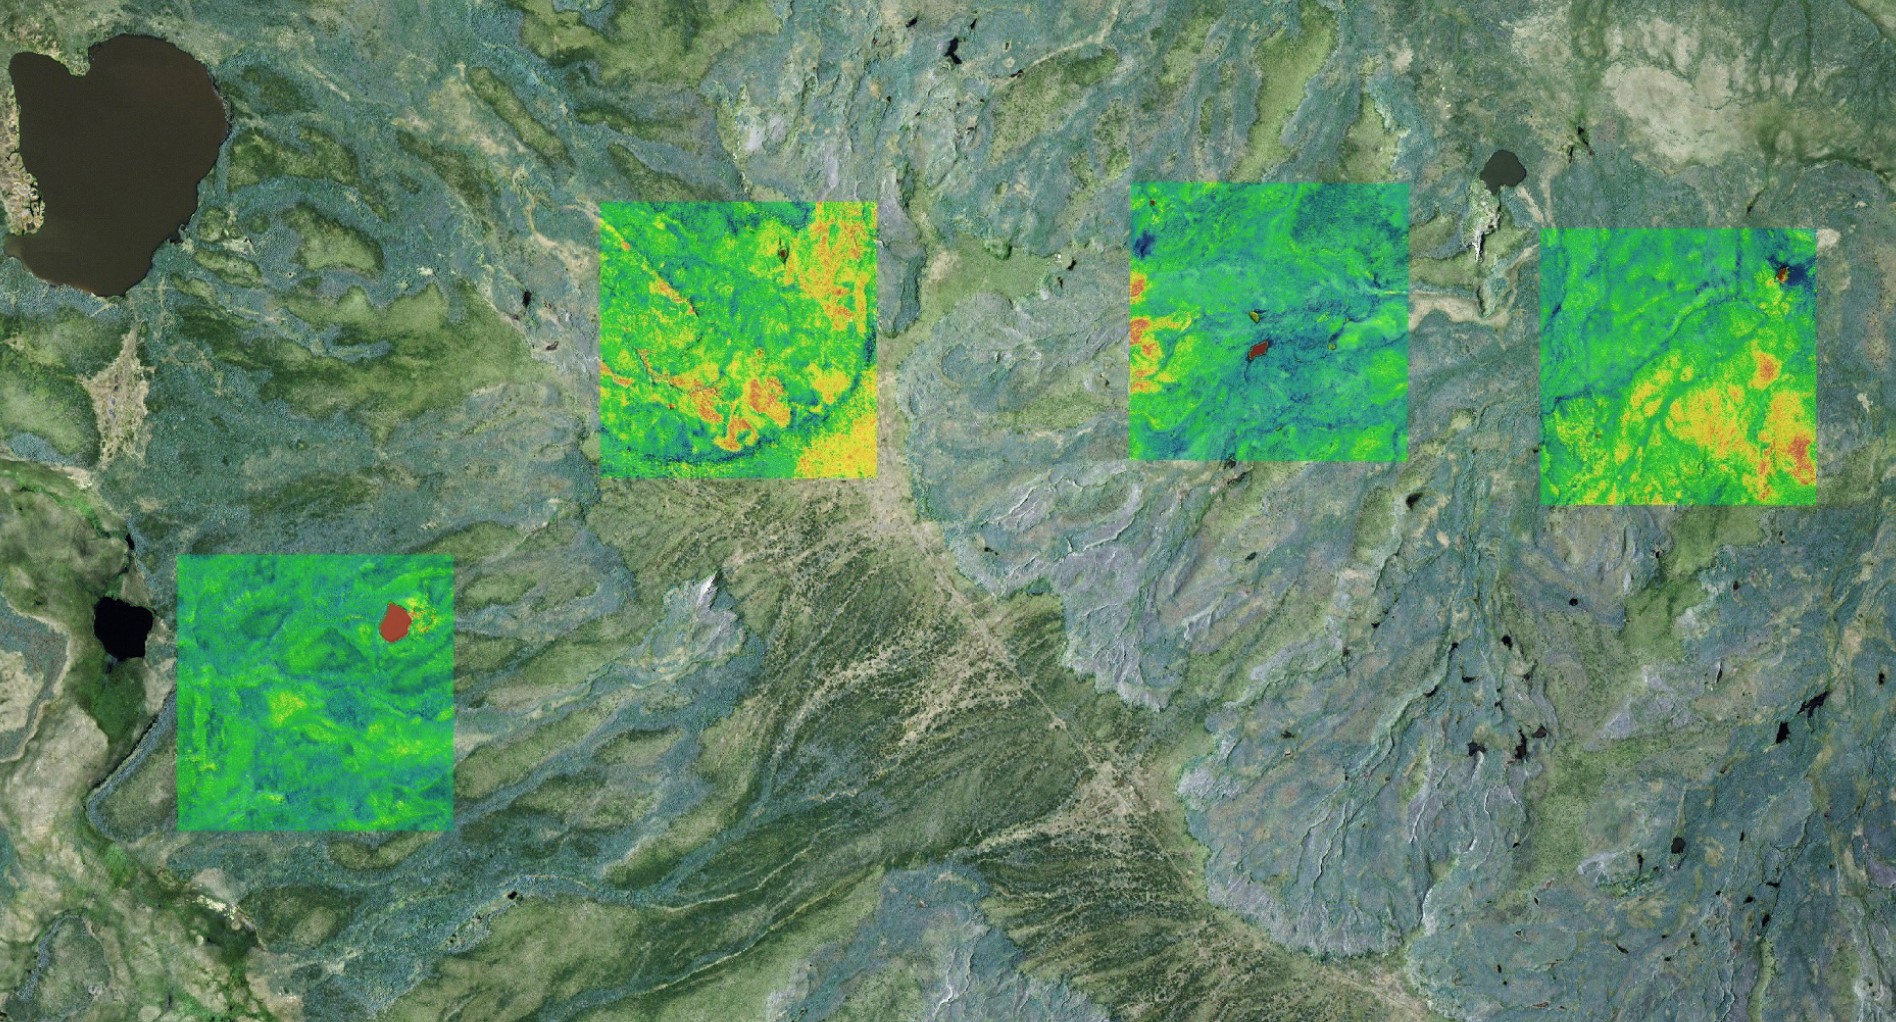
The Arctic is warming rapidly and satellites indicate a greening of the these high latitude ecosystems, yet available datasets do not capture the spatial detail required to understand how warming (or other environmental changes) are actually causing this landscape greening. The longest running satellite datasets either use grainy pixels the size of Manhattan, or take snapshots so infrequently that clouds block out a substantial portion of each growing season. In contrast, Arctic field researchers have extremely deep understanding of what happens in garden-sized vegetation plots, but it can be difficult to link these to regional patterns. The HiLDEN network is a big step towards filling this gap. It provides a new opportunity to explore tundra vegetation change from a fresh perspective, and to better link satellite and on-the-ground observations by capturing high resolution data of tundra landscapes with drones.
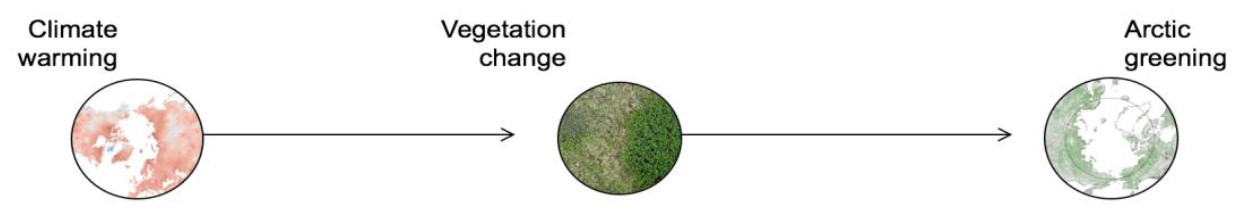
Climate is changing rapidly at the extreme latitudes of our planet. Warming temperatures, melting sea ice, and thawing permafrost are transforming Arctic environments. In some places, bare ground is becoming vegetated. Elsewhere, plants are now growing larger. These simple changes – if widespread – can alter the trajectory of global patterns of climate change. Up to a third of the world’s soil carbon is stored in frozen soils, and if released would accelerate climate warming for the entire planet. However, scientists remain uncertain about how and where these feedbacks might unfold in the tundra. A critical step towards resolving this uncertainty is to understand the patterns and causes of changes in tundra vegetation – and this is where HiLDEN data synthesis comes in.
The group assembled at Pierce’s Inn in the wooded hills of New Hampshire and at the Neukom Institute for Computational Science on the Dartmouth College campus. Fireside discussions led in to data synthesis powered by high-powered computing, both on the cloud and at Dartmouth College. Using the Google Earth Engine (https://earthengine.google.com/), we explored patterns of satellite data in conjunction with drone records at 42 sites around the Arctic. Throughout the working group, we identified our major research questions, outlined a manuscript, and discussed future avenues for the network.

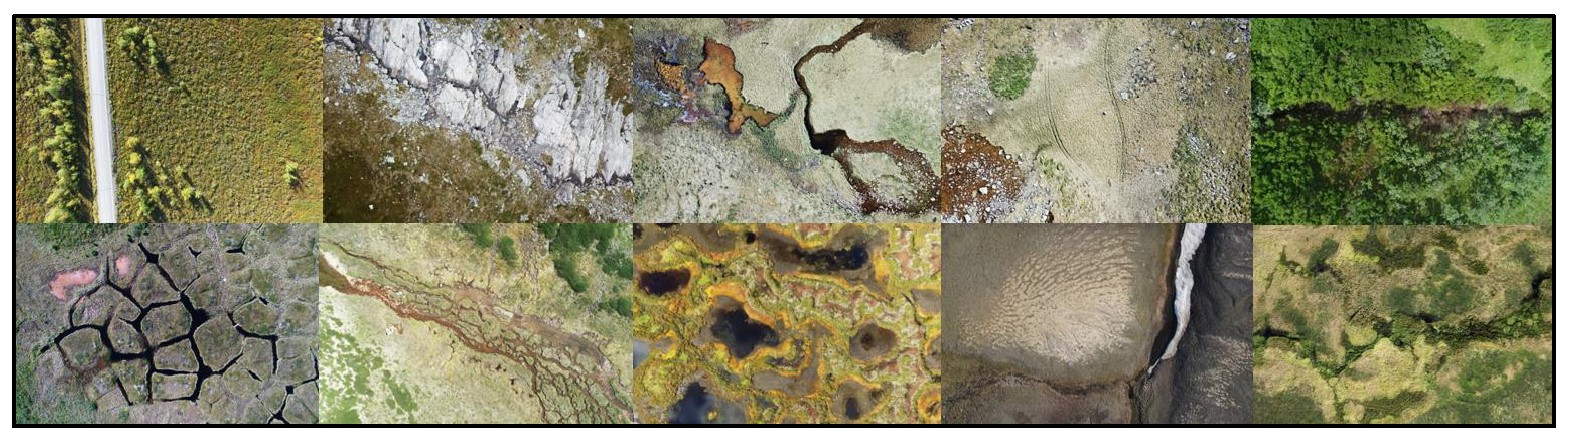
Our dataset included over two hundred thousand aerial images from across the Arctic including tundra landscapes in Europe, Siberia, Alaska, Canada and Greenland. What immediately stands out from looking at these pictures is the stunning diversity of tundra landforms – from wetlands to highlands, shrubs and trees to barren grounds, from treeline to the northern reaches of tundra biome. All of these patterns are lost in poor resolution satellite data. Beyond traditional color photographs, the group analyzed imagery taken from discrete regions of the radiometric spectrum to generate specialized vegetation indices (like the Normalized Difference Vegetation Index – NDVI) while also creating three dimensional surface models of these landscapes.
Based on these data products, our preliminary analyses resulting from the working group indicate the following: 1) The HiLDEN dataset encompasses tundra sites that span the diversity of biome scale greening trends. 2) Various satellite observed greening trends correspond with one another across our sites, but the years of high and low greening do not always track well across datasets. 3) Local-scale variation and features of the land-surface (captured in drone data) seem to have an influence on various characteristics of greening trends observed by satellites.
Over the coming months, analyses from this first HiLDEN working group will be refined and shaped into a data synthesis manuscript. This working group has demonstrated that collaborative science with common data collection protocols and a common purpose can yield exciting new perspectives on the ecological responses to climate warming at the cold extremes of our planet.
We thank the Neukom Institute for Computational Science (https://neukom.dartmouth.edu/) for supporting this workshop and HiLDEN data servers since the network was founded. We also thank the Scottish Alliance for Geoscience, Environment, and Society (SAGES) and the Institute of Arctic Studies at Dartmouth for their critical support in the preparations of the dataset and in planning the working group. Finally, we thank all of the HiLDEN members for contributing data and facilitating what we think might be the largest ecological drone data synthesis to date!
Summarized on behalf of the working group by Jeff Kerby, Jakob Assmann, and Isla Myers-Smith

At Arctic Change 2017 in Québec City:
Meso-scale Arctic ecology: Leveraging the High Latitude Drone Ecology Network (HiLDEN) to address longstanding knowledge gaps – Kerby et al.
Drone imagery reveals scale mismatch between satellite-observed tundra greenness and on-the-ground vegetation monitoring – Assmann et al.
Monitoring Arctic changes with drones – Cunliffe et al.
Quantifying the drivers of rapid tundra vegetation change – increased productivity and permafrost thaw (using drones) – Myers-Smith et al.
Permafrost dynamics and infrastructure impacts revealed by Unmanned Aircraft System-derived terrain information – van der Sluijs et al.
Opportunities and challenges for Unmanned Aerial Vehicles (UAVs) in the Arctic – Hann
The extreme erosion of Pelly Island, Northwest Territories: Using UAVs and modelling techniques to evaluate the fate of sediments – Malenfant et al.
Combining UAS data, Very High Resolution satellite imagery and field measurements to interpret landslide stabilization processes on the Yamal Peninsula – Kumpula et al.
Assessing an unmanned aircraft vehicle as a tool for researching Sub-Arctic ecosystems – Barnas et al.
High resolution monitoring of cryospheric change with unmanned aerial systems – Moorman et al.
http://www.arcticnetmeetings.ca/ac2017/docs/ProgramAC2017.pdf
At the American Geophysical Union Meeting in New Orleans:
B21F-2022: Calibration and Validation of Tundra Plant Functional Type Fractional Cover Mapping -Macander et al.
B21F-2016: Evaluating rapid ground sampling and scaling estimated plant cover using UAV imagery up to Landsat for mapping arctic vegetation – Nelson et al.
B43G-2218: Four years of UAS Imagery Reveals Vegetation Change Due to Permafrost Thaw – DelGreco et al.
B51A-1773 UAV based mapping of variation in grassland yield for forage production in Arctic environments – Davids et al.
C21A-1110: Quantifying the Interactions Between Soil Thermal Characteristics, Soil Physical Properties, Hydro-geomorphological Conditions and Vegetation Distribution in an Arctic Watershed – Leger et al.
B31I-06 Characterizing sub-arctic peatland vegeation using height estimates from structure from motion and an unmanned aerial system (UAS) – Palace et al.
]]>May 2017
Buying a pre-/post-flight calibration target is a big investment, but good targets are essential for comparison between flights, across sites and with other sources of reflectance measurements (such as satellites). We hope that this additional material proves to be a helpful guide in the process of purchasing or loaning a target.
This document is the result of two years of trial and error collecting multispectral imagery with drones in the Canadian Arctic and has been informed by many conversations with the experts at the UK NERC Field Spectroscopy Facility (we are particularly in debt to Chris MacLellan). However, it is by no means exhaustive and we are still at the early stages of developing best practises. Please get in touch if you have any questions, comments and suggestions.
PDF: Additional Information On Panels 22 May 2017
Target reflectance value
Surface reflectance values for vegetation lie on average between 40-60%. Ideally, a calibration target would match the surface of interest as best as possible. In practice, a target close to this range should be sufficient.
Spectralon and similar targets are available off-the-shelf at set reflectance values, such as 50% and 75%. Customised targets with other reflectance values are also available.
The response of a multispectral sensor is likely to be linear in most of its range (enquiry for Parrot Sequoia pending) and the error of the radiometric calibration in the software (e.g. Pix4D mapper) can be expected to be symmetrical around the reflectance value of the surveyed surface (Pix4D Support, personal communication, May 2017). Hence, going a bit above or below should not make any difference.
Panels with lower reflectance values are less likely to overexpose in the calibration imagery and small amounts of contamination will have proportionally less of an impact on their reflectance value compared to whiter targets (NERC Field Spectroscopy Facility, personal communication April 2017).
For practical reasons, we would therefore recommend a 50% target for pre-/post-flight calibration; advice also shared by Pix4D (Pix4D Support, personal communication, May 2017).
Size and weight
In theory, the larger the statistical sample of pixels (and hence the size of the target), the better the calibration. However, the larger the target, the bulkier and heavier it becomes. For Arctic fieldwork going bigger might not always be better. Finding a healthy optimum is therefore important.
Currently, we are not aware of any tests that have been conducted to identify minimum / optimum target sizes.
We recommend something between 15 x 15 cm (6” x 6”) and 20 x 20 cm (8” x 8”), but smaller 12.5 x 12.5 cm (5” x 5”) or larger 25 x 25 cm (10” x 10”) targets should work as well.
The standard, pure Spectralon targets can be quite heavy, particularly the 10” x 10” version. Zenith Lite Targets (or alike) can be a more practical alternative (available in 50% reflectance and 20 x 20 cm).
Casing, protection and tripod use
To facilitate protection and easy handling of the targets a good container is needed. We suggest using a hard-case container that will protect the target from physical damage and from the elements. Some options are available also with removable lids and tripod mount attachments.
Spectra Vista Corporation (UAS) produces light-weight wooden cases (with tripod attachment) that seem to be a good option (recommended by NERC FSF, personal communication May 2017).
The NERC FSF, recommends the use of tripods to elevate the target above ground, allow for optimal levelling (using a spirit level), reduction of shadows and protecting the target from dirt etc.
Loaning/sharing targets
Good quality targets are expensive and purchasing them might not always be an option. It might be worthwhile considering loaning a target from someone in your institution (most people doing field spectroscopy are likely to have one) or buying a target shared with someone.
In the UK, NERC funded research projects might be eligible for support from the NERC Field Spectroscopy Facility, from which various targets and calibration panels can be loaned.
Redundancy and Degradation
For long field seasons, it can be good to have multiple targets for redundancy. Plus, it might allow you to measure target degradation. The latter could be done with a stable tungsten halogen light source (or the sun at noon) and your multispectral sensor or a field spectroradiometer (if available). A ‘safe’ standard panel that is kept at your base station could be helpful for this.
For the field season 2017, we are planning on taking two 50% 20 x 20 cm Zenith Lite targets for in-field operations and a 75% 25 x 25 cm Spectralon target as a ‘safe’ standard. We are planning to use or Sequoia sensors to obtain a ‘calibration’ picture showing all panels simultaneously at regular intervals (weekly). This will be done at the base station, in a dark room using a tungsten halogen light source at a set angle to the targets. This might also allow us to assess sensor degradation – assuming no degradation of the ‘safe’ standard.
Final note on pre-/post-flight calibration
At the moment, little information is available on the quality and error of ground-based pre-/post-flight calibration with reference panels.
Standing next to the target and holding the drone above it, is likely to change the irradiation hitting the target even if no shadows are cast on it. Beware of wearing highly reflective clothing, particularly red colors. It is difficult to say whether or not the resulting error is within the accuracy of data collected with drone-based multispectral sensors.
Also, there have been a few methodological questions about the Sequoia’s pre-flight radiometric calibration process. The automated calibration photos the Sequoia captures a set of photos bracketed to different exposures. This ensures that one of them is most likely accurately exposed even if the auto-exposure setting is influenced by background colors (i.e. dark grass contrasting with the white exposure plate). When taking radiometric calibration photos with other sensors, be mindful of this potential hazard, i.e. make sure you are not overexposing your photos during calibration as that means data can be lost.
In the long run, in-flight calibration with large high-quality targets could prove to be the most reliable way of calibrating multispectral drone imagery. However, for this, affordable, practical and reliable in-flight targets need to be developed and then data collected to compare the two methods of calibration.
Useful Links (not exhaustive):
Labsphere, USA (Spectralon Targets)
Sphereoptics, Germany (Zenith Light Targets)
Spectra Vista Corporation, USA (Target cases)
NERC Field Spectroscopy Facility, UK (Target loans and support for UK NERC funded grants)
MicaSense Best Practices Data Collection, MicaSense Website
]]>The University of Edinburgh, Scotland (UK) and Dartmouth College, NH (USA)
The following protocol is the outcome of two years of multispectral drone work in the Canadian Arctic. Two three-months field seasons provided opportunities to learn through trial and error. Should you have any feedback, suggestions, questions or comments please let us know.
The information below is distilled into a blog post (pdf link below this paragraph) / and is currently in preparation for submission as a short scientific communication manuscript. Once published, this will be shared on the HiLDEN mailing list. If this protocol has influenced your method of data collection it would be great if you could cite the above publications in resulting manuscripts.
Updated: Multispectral Flight Protocol-16 May 2017
Time of Day
All flights should be conducted between 3 hours before and after solar noon, and at most within 6 hours before and after solar noon.
You might want to harden this rule depending on the latitude of your field side / time of year, also consider mountains and other obstacles that might influence the illumination of your field site. The NOAA solar position calendar and other similar resources are useful tools to calculate solar position at your field site.
Shadows are the main reason for this, the lower the solar angle the more prominent shadows become in your images. More shadows mean a lower proportion of the surface is illuminated resulting in inaccurate estimates of surface reflectance and its derived data products, like NDVI. This becomes less of a problem on overcast days with diffuse illumination. The spectral composition of the sunlight also changes with solar elevation. This can be compensated to some degree with radiometric calibration, but extremes should be avoided.
Radiometric calibration
Radiometric calibration is the most important step of this protocol. Clouds, haze, time of day and solar position influence the spectral composition of sunlight, it is therefore key that a standard of known reflectance is used to calibrate the relative measurements of the multispectral sensor. Otherwise, comparisons between flights, sites and satellite imagery are not possible.
Pre- and post-flight calibration
Radiometric calibration is best carried out by taking calibration imagery of a known standard panel directly before or after the flight. The resulting imagery is then later used in the photogrammetry software (e.g. Pix4D) to calibrate the reflectance maps.
Only one of the two sets of calibration imagery (pre/post) will be used for radiometric calibration, but you might find that light conditions change during long flights (e.g. clouds moving in) and that conditions at the end of the flight are more representative of the majority of the flight.
We recommend using a traceable Spectralon target (or standard of similar quality) of approx. 15 x 15 cm (6” x 6”). For vegetation surveys a standard with a reflectance value of 70% would be ideal, but 40-70% should be sufficient. If you are planning to survey snow covered surfaces a pure white standard > 90% reflectance might be required.
Please be aware that, if you are using MicaSense reference panels, these are intended primarily for commercial use and may degrade due to temperature extremes or improper handling. We experienced some degradation of our 2016 MicaSense reference panels. Long-term durability of the panels has not been tested, and after discussion with the MicaSense Support Team they recommended the use of Spectralon targets for high sensitivity academic/scientific data collection (personal communication, April 2017). These are significantly more expensive, but are field and wear tested under a variety of conditions. Spectralon targets can be sourced through the manufacturer Labsphere in the US or retailers world-wide.
Pre-/post-flight calibration images should be taken so that a large number of pixels are covered by the target and so that the target ID is clearly visible in the image. Ensure that the target is level on the ground and free of shadows. If your calibration photo captures many pixels of the calibration panel, a larger statistical sample can be used by the photogrammetry software to calibrate the orthomosaic reflectance maps. In this instance, a larger sample is a better sample.
As a rule of thumb with the Parrot Sequoia sensor: Hold the drone just below hip height over the target with your back to the sun, take a step aside while holding the drone in position to avoid casting a shadow over the target.
Ensure that the target in the calibration imagery is not overexposed (i.e. saturated in the upper end of the digital numbers), as radiometric calibration will otherwise not be possible. If you are using a Sequoia Sensor, use the ‘Radiometric Calibration’ feature of the WiFi interface to obtain a bracket of calibration imagery with different exposure levels. Placing the calibration target on a high reflectance surface (such as a landing pad) may also help reduce the chance of incorrect exposures.
Finally, if you’re using a filter or lens protector during the flight, ensure that calibration imagery is taken with the filter/protector in place. Likewise, remove any filters/protectors before taking the calibration imagery if they are not used in flight.
In-flight reflectance targets
In-flight reflectance targets serve two purposes: a) as surfaces with known/calibrated reflectance they allow for quality control in the outputs of photogrammetry software (such as the reflectance and NDVI maps produced by Pix4D), and b) they are a back-up if for some reason the pre-/post-flight calibration imagery fails (e.g. deterioration of standard over time, overexposure of imagery and unintended shadows covering the target).
In-flight targets should have even reflectance values within the bands of your sensor and match roughly the reflectance of the surface of interest. For vegetation surveys we recommend 40-60% reflectance. Additional targets of higher and lower reflectance may be employed to cover a larger range of reflectance values, but this might not be practical in all situations.
In-flight targets should be at minimum 5 x 5 the Ground Sampling Distance (GSD) (25 Pixels), but 10 x 10 GSD (100 Pixels) is desirable, if not more. Again, the larger the statistical sample of pixels the better the quality control. For reasons of practicality (transport and weight) large target sizes for high altitude flights might not be achievable.
The material of the in-flight target should be as durable and Lambertian (even reflectance independent on angle of view) properties as possible. Spectralon would be ideal, but is likely not a cost-effective as an in-flight target. In our experience, it is more difficult to keep in-flight targets away from environmental influences such as water splashes, dirt and dust. Instead of Spectralon we therefore suggest selecting from the following options. They are ordered by most desireable reflectance properties, but we realize you will need to make your decision based on intended uses, budget, and time for preparation and availability.
- Calibrated felt targets produced by the finish company MosaicMill , 44% reflectance for vegetation surveys; standard size 50 cm x 50 cm, approx. 350€ per piece, custom sizes also available (discounts for more than one purchase).
- Grey-cards made out of ‘Kodak card’ cardboard type material, obtainable from photography suppliers. Often only available in smaller sizes around paper A4 or letter format, unsuitable for large GSD. Tend to come in approx. 18% reflectance (grey) and 80% (white). Warning: Spectral properties may vary strongly across the spectrum – test in lab before use!
- Sail-cloth and canvas sheets may be alternatives, particularly for large GSD of known even spectral reflectance. Ensure the material is 100% opaque and test reflectance and lambertian properties in lab!
For uncalibrated targets, we highly recommend measuring reflectance properties before going out into the field the first time. However, in the end a bad in-flight target is better than no target. Also see ‘Care and Quality Control’ Section below.
Finally, we suggest that at least two in-flight targets should be employed; one at either extreme of the flight paths. For larger sites (> 1 ha) more target might be desirable, but only if practically feasible. Position the targets so that the aircraft passes directly over it.
Care and Quality Control of Reflectance Standards and Targets
Handle reflectance standards and in-flight targets with as much care as possible! Avoid touching the surface, exposure to rain, dirt and water splashes particularly of the Spectralon pre-/post flight calibration targets). Prolonged exposure to sun may also have a negative impact on the surface. Return the targets to a protective container as soon as possible after use.
All targets should be calibrated before and after each field season, then cleaned according to manufacturer’s recommendations and re-measured ahead of the next field season. We suggest determining the absolute reflectance of the targets using a spectroradiometer in a dark room. In the past, we carried out five contact measurements per target, one in the centre and four towards each corner (but not in the very corner), average reflectance values can then be calculated for the target and band averages determined.
Ground Control Points
In addition to following the general ground control point (GCP) recommendations of the HiLDEN a few particular considerations apply to GCPs used with multispectral sensors. GSDs for the multispectral sensors are large compared to high resolution RGB sensors and the monochromatic nature of single band imagery can therefore make identifying GCPs difficult.
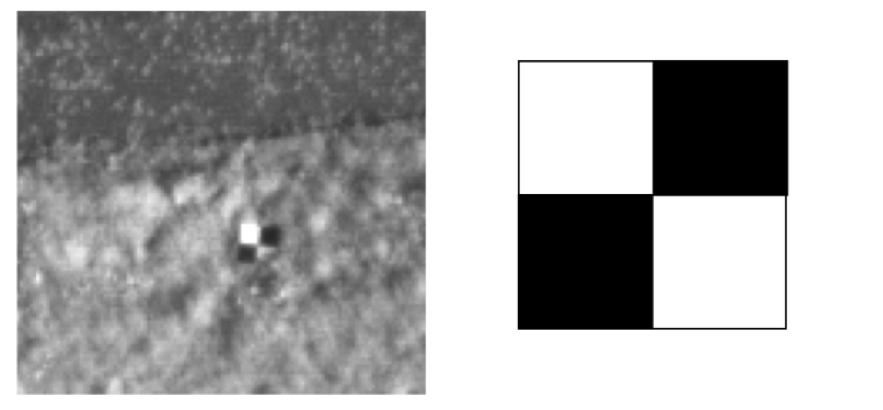
We recommend the use of large GCPs (8 x 8 to 10 x 10 GSD, absolute minimum 5 x 5 GSD) with a checkboard pattern, in our experience these work best (Figure 1). The checkboard pattern works well, as the squares show up as clearly defined surfaces in the monochromatic imagery. Before heading out into the field with new GCPs, ensure that they show up well in all bands. Not all whites are white and not all blacks are black in the near-infrared (NIR). Furthermore, make sure that surface reflectance properties do not vary strongly with orientation to the sun and solar angle. A good way of testing the suitability of new GCPs is taking images with the multispectral sensor on the ground and then conducting tests flights. We have made life difficult for ourselves by not testing GCPs in the past, assuming that surfaces that show up well in the visible spectrum would show up well in the NIR as well.
Flight Pattern
Flight plan and pattern will vary depending on the site. However, if a lawn mower flight pattern of parallel flight lines is used we recommend introducing some flight lines diagonally or across the pattern. See Figure 2 for a suggested flight plan. This will likely improve the outputs of the photogrammetry process, particularly if vegetation surfaces are mapped that are not very varied in their nature.

Weather Conditions and MetaData
In addition to usual flight data, it is worthwhile to log weather conditions, as well as the standards and targets used. Noting weather, wind and sky conditions are particularly useful for multispectral data collection, as they influence surface behaviour and solar irradiation. For sky conditions, we suggest a scale from 0-9 (Table 1).
In addition, temperature and information about vegetation surface wetness/dew should be recorded.
Please also see HILDEN multispectral flight log spread-sheet attached (may be filled in on paper or digital on a tablet).
Table 1 Sky Codes – adapted from NERC Field spectroscopy Facility’s Log Sheets
| 0 | Clear sky |
| 1 | Haze |
| 2 | Thin cirrus – sun not obscured |
| 3 | Thin cirrus – sun obscured |
| 4 | Scattered cumulus – sun not obscured |
| 5 | Cumulus over most of sky – sun not obscured |
| 6 | Cumulus – sun obscured |
| 7 | Complete cumulus cover |
| 8 | Stratus – sun obscured |
| 9 | Drizzle |
Date of meeting: 14 December 2016
Compiled by: Jeff Kerby with input from Isla Myers-Smith and Andrew Cunliffe
Executive summary:
The High Latitude Drone Ecology Network (HLDEN) meeting brought together drone users who work in high latitude ecosystems together for a first meeting of our group to discuss common interests and challenges in drone ecology and other drone research applications.
The meeting began with a short presentation by Isla Myers-Smith outlining session goals and a brief introduction to various UAV applications to Arctic Research (with a specific focus on research being currently conducted on Qikiqtaruk – Herschel Island).
Participants followed with short introductions of their personal research interests/uses of UAVs in the region, and their interest in this session. This led in to open ended discussion on the following general themes: 1. Shared methods across sites, 2. High-latitude UAV synthesis paper, 3. Strategic planning for funding, research, and policy development.
See attached meeting write up for more information.
agu-hlden-meeting-summary-27-jan-2017

Time: Weds, 14 Dec 2016, 10:15 am – 12:00pm (apologies for any session conflicts!)
We will discuss the following general topics:
A. Shared methods and protocols across sites
Hardware/software interfaces, sensor choices, and high-latitude-specific challenges can make the barrier to entry for consistent and comparable near-surface remote sensing approaches a challenge. We will discuss what systems and protocols may work well across sites, and for various levels of UAV operator specialization. Other subjects can include training opportunities, hardware and software troubleshooting, and ideas about shared data repositories.
B. High latitude UAV synthesis paper
There is an opportunity to guide polar UAV research via a synthesis and perspectives paper that identifies critical research themes and use-cases for UAV work in these rapidly changing (low canopy!) regions.
C. Strategic planning for funding, research, and policy development relevant to high latitude use cases
This working group can be a chance to discuss what research questions a drone network can ask better than a project at a single site, what are the current foci of various research groups, and determine if there are common data that all groups can systematically collect with minimal additional effort. Regulatory environments are evolving rapidly in this field, and this poses an opportunity to share up to date information on recent changes and/or to guide science-positive policy in this area.
If you would like to participate in the workshop please RSVP to Jeff Kerby. We will send out a summary of the meeting to interested parties who are not able to attend.
The HLDEN AGU team
Dissecting Drivers of Arctic Plant Phenology Across Scales in Time and Space
https://agu.confex.com/agu/fm16/meetingapp.cgi/Paper/178071
UAV-LiDAR accuracy and comparison to Structure from Motion photogrammetry
https://agu.confex.com/agu/fm16/meetingapp.cgi/Paper/195973
An Overview of the 2017 Airborne Campaign for NASA’s Arctic Boreal Vulnerability Experiment (ABoVE)
https://agu.confex.com/agu/fm16/meetingapp.cgi/Paper/186738
The Impact of Drone Technology on Arctic Remote Sensing Data
https://agu.confex.com/agu/fm16/meetingapp.cgi/Paper/195953
Using Small Drone (UAS) Imagery to Bridge the Gap Between Field- and Satellite-Based Measurements of Vegetation Structure and Change
https://agu.confex.com/agu/fm16/meetingapp.cgi/Paper/178035


Cast your vote for Shrubcopter’s new twin at the following poll. Will it be Droney McDroneface, The Drone Ranger, Shrubby the little droneycopter, RRD (Royal Research Drone) Sir David Dronenborough, Sedgecopter… or another name that you come up with?
The deadline for voting is midnight on the 20 of May 2016.
Check our our blog post about the field season: ‘Drones, logistics and off we go to Canada’
