CCIE #31104, what's next?

My journey in data networking architecture.

  • About Brandon
  • Links and resources
  • Purpose

VXLAN unicast flooding

Posted by SDNgeek on January 31, 2020
Posted in: Uncategorized. Leave a comment

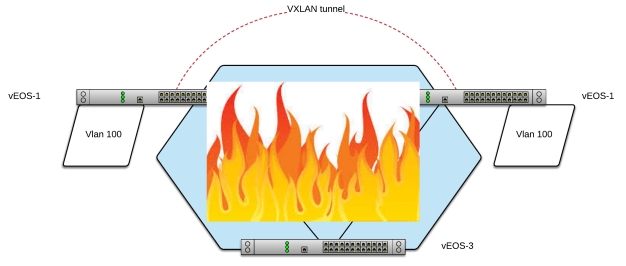
In our last blog we broke VXLAN via breaking layer 3 and multicast. We fixed layer 3 but left multicast broken. Now we’ll convert the configuration from multicast to unicast flooding and notice some very interesting behavior.

Note this configuration is often used in conjunction with multicast for Head-End Replication (HER) where needed but you can use it to create a completely unicast flooding topology as well.

VXLAN no mcast.pngFirst, let’s add the unicast flood statements just on vEOS-2:

vEOS-2(config-if-Vx1)#sh ac
interface Vxlan1
vxlan multicast-group 227.0.0.1
vxlan source-interface Loopback0
vxlan udp-port 4789
vxlan vlan 100 vni 100
vEOS-2(config-if-Vx1)#ping 10.0.100.1
PING 10.0.100.1 (10.0.100.1) 72(100) bytes of data.

--- 10.0.100.1 ping statistics ---
5 packets transmitted, 0 received, 100% packet loss, time 47ms


vEOS-2(config-if-Vx1)#vxlan flood vtep 1.1.1.1
vEOS-2(config-if-Vx1)#ping 10.0.100.1
PING 10.0.100.1 (10.0.100.1) 72(100) bytes of data.
80 bytes from 10.0.100.1: icmp_seq=1 ttl=64 time=12.6 ms
80 bytes from 10.0.100.1: icmp_seq=2 ttl=64 time=16.1 ms
80 bytes from 10.0.100.1: icmp_seq=3 ttl=64 time=13.6 ms
80 bytes from 10.0.100.1: icmp_seq=4 ttl=64 time=19.3 ms
80 bytes from 10.0.100.1: icmp_seq=5 ttl=64 time=11.8 ms

--- 10.0.100.1 ping statistics ---
5 packets transmitted, 5 received, 0% packet loss, time 59ms
rtt min/avg/max/mdev = 11.886/14.748/19.306/2.701 ms, pipe 2, ipg/ewma 14.940/13.698 ms
vEOS-2(config-if-Vx1)#


Wait what?! The ping worked without adding it to vEOS-1. Yes because the flood and learn behavior vEOS-1 learned the source for 10.0.100.2…

vEOS-1(config-if-Vx1)#sh ac
interface Vxlan1
vxlan multicast-group 227.0.0.1
vxlan source-interface Loopback0
vxlan udp-port 4789
vxlan vlan 100 vni 100


vEOS-1(config-if-Vx1)#sh vxlan vni
VNI to VLAN Mapping for Vxlan1
VNI VLAN Source Interface 802.1Q Tag
--------- ---------- ------------ --------------- ----------
100 100 static Vxlan1 100


vEOS-1(config-if-Vx1)#sh vxlan address-table
Vxlan Mac Address Table
----------------------------------------------------------------------

VLAN Mac Address Type Prt VTEP Moves Last Move
---- ----------- ---- --- ---- ----- ---------
100 0800.2732.55e8 DYNAMIC Vx1 2.2.2.2 1 0:07:37 ago
Total Remote Mac Addresses for this criterion: 1


vEOS-2(config-if-Vx1)#sh vxlan address-table
Vxlan Mac Address Table
----------------------------------------------------------------------

VLAN Mac Address Type Prt VTEP Moves Last Move
---- ----------- ---- --- ---- ----- ---------
100 0800.2734.9233 DYNAMIC Vx1 1.1.1.1 1 0:02:19 ago
Total Remote Mac Addresses for this criterion: 1


vEOS-1(config-if-Vx1)#sh ip arp
Address         Age (sec)  Hardware Addr   Interface
10.0.0.2          0:10:22  0800.2732.55e8  Vlan1, Ethernet1
10.0.0.3          0:10:22  0800.2742.ed7e  Vlan1, Ethernet1
10.0.100.2        0:10:10  0800.2732.55e8  Vlan100, Vxlan1
192.168.100.100   0:00:00  0a00.2700.0014  Management1


vEOS-1(config-if-Vx1)#ping 10.0.100.2
PING 10.0.100.2 (10.0.100.2) 72(100) bytes of data.
80 bytes from 10.0.100.2: icmp_seq=1 ttl=64 time=10.5 ms
80 bytes from 10.0.100.2: icmp_seq=2 ttl=64 time=10.7 ms
80 bytes from 10.0.100.2: icmp_seq=3 ttl=64 time=10.5 ms
80 bytes from 10.0.100.2: icmp_seq=4 ttl=64 time=10.5 ms
80 bytes from 10.0.100.2: icmp_seq=5 ttl=64 time=11.0 ms

--- 10.0.100.2 ping statistics ---
5 packets transmitted, 5 received, 0% packet loss, time 44ms
rtt min/avg/max/mdev = 10.520/10.683/11.024/0.216 ms, ipg/ewma 11.097/10.624 ms

Now, let’s clear the mac address tables and see if vEOS-1 can still reach vEOS-2 vlan 100 SVI:

vEOS-1(config-if-Vx1)#clear mac address-table dynamic
vEOS-2(config-if-Vx1)#clear mac address-table dynamic


vEOS-1(config-if-Vx1)#sh vxlan address-table
Vxlan Mac Address Table
----------------------------------------------------------------------

VLAN Mac Address Type Prt VTEP Moves Last Move
---- ----------- ---- --- ---- ----- ---------
Total Remote Mac Addresses for this criterion: 0


vEOS-1(config-if-Vx1)#sh vxlan address-table
Vxlan Mac Address Table
----------------------------------------------------------------------

VLAN Mac Address Type Prt VTEP Moves Last Move
---- ----------- ---- --- ---- ----- ---------
Total Remote Mac Addresses for this criterion: 0
vEOS-1(config-if-Vx1)#sh mac address-table
Mac Address Table
------------------------------------------------------------------

Vlan Mac Address Type Ports Moves Last Move
---- ----------- ---- ----- ----- ---------
1 0800.2732.55e8 DYNAMIC Et1 1 0:00:46 ago
1 0800.2742.ed7e DYNAMIC Et1 1 0:00:50 ago
Total Mac Addresses for this criterion: 2


vEOS-2(config-if-Vx1)#sh vxlan address-table
Vxlan Mac Address Table
----------------------------------------------------------------------

VLAN Mac Address Type Prt VTEP Moves Last Move
---- ----------- ---- --- ---- ----- ---------
Total Remote Mac Addresses for this criterion: 0
vEOS-2(config-if-Vx1)#sh mac address-table
Mac Address Table
------------------------------------------------------------------

Vlan Mac Address Type Ports Moves Last Move
---- ----------- ---- ----- ----- ---------
1 0800.2734.9233 DYNAMIC Et1 1 0:00:50 ago
1 0800.2742.ed7e DYNAMIC Et3 1 0:00:50 ago
Total Mac Addresses for this criterion: 2


vEOS-1(config-if-Vx1)#ping 10.0.100.2
PING 10.0.100.2 (10.0.100.2) 72(100) bytes of data.

--- 10.0.100.2 ping statistics ---
5 packets transmitted, 0 received, 100% packet loss, time 47ms

vEOS-1(config-if-Vx1)#sh vxlan address-table
Vxlan Mac Address Table
----------------------------------------------------------------------

VLAN Mac Address Type Prt VTEP Moves Last Move
---- ----------- ---- --- ---- ----- ---------
Total Remote Mac Addresses for this criterion: 0

Ok so vEOS-1 cannot source traffic still as he doesn’t have a unicast flood statement so he is still just sending frames via multicast. If we source traffic from vEOS-2 we will recover two way communication:

vEOS-2(config-if-Vx1)#ping 10.0.100.1
PING 10.0.100.1 (10.0.100.1) 72(100) bytes of data.
80 bytes from 10.0.100.1: icmp_seq=1 ttl=64 time=13.4 ms
...

--- 10.0.100.1 ping statistics ---
5 packets transmitted, 5 received, 0% packet loss, time 52ms
rtt min/avg/max/mdev = 10.557/11.839/13.480/1.048 ms, pipe 2, ipg/ewma 13.015/12.588 ms
vEOS-2(config-if-Vx1)#sh vxlan address-table
Vxlan Mac Address Table
----------------------------------------------------------------------

VLAN Mac Address Type Prt VTEP Moves Last Move
---- ----------- ---- --- ---- ----- ---------
100 0800.2734.9233 DYNAMIC Vx1 1.1.1.1 1 0:00:02 ago
Total Remote Mac Addresses for this criterion: 1
vEOS-2(config-if-Vx1)#


vEOS-1(config-if-Vx1)#sh vxlan address-table
Vxlan Mac Address Table
----------------------------------------------------------------------

VLAN Mac Address Type Prt VTEP Moves Last Move
---- ----------- ---- --- ---- ----- ---------
100 0800.2732.55e8 DYNAMIC Vx1 2.2.2.2 1 0:00:14 ago
Total Remote Mac Addresses for this criterion: 1
vEOS-1(config-if-Vx1)#ping 10.0.100.2
PING 10.0.100.2 (10.0.100.2) 72(100) bytes of data.
80 bytes from 10.0.100.2: icmp_seq=1 ttl=64 time=11.4 ms
...

--- 10.0.100.2 ping statistics ---
5 packets transmitted, 5 received, 0% packet loss, time 53ms
rtt min/avg/max/mdev = 10.673/14.111/20.058/3.755 ms, pipe 2, ipg/ewma 13.342/12.786 ms


Let’s clear mac address tables again and add the flood command to vEOS-1 and test again:

vEOS-1(config-if-Vx1)#clear mac address-table dynamic
vEOS-1(config-if-Vx1)#sh vxlan address-table
Vxlan Mac Address Table
----------------------------------------------------------------------

VLAN Mac Address Type Prt VTEP Moves Last Move
---- ----------- ---- --- ---- ----- ---------
Total Remote Mac Addresses for this criterion: 0


vEOS-2(config-if-Vx1)#clear mac address-table dynamic
vEOS-2(config-if-Vx1)#sh vxlan address-table
Vxlan Mac Address Table
----------------------------------------------------------------------

VLAN Mac Address Type Prt VTEP Moves Last Move
---- ----------- ---- --- ---- ----- ---------
Total Remote Mac Addresses for this criterion: 0


vEOS-1(config-if-Vx1)#vxlan flood vtep 2.2.2.2
vEOS-1(config-if-Vx1)#sh ac
interface Vxlan1
vxlan multicast-group 227.0.0.1
vxlan source-interface Loopback0
vxlan udp-port 4789
vxlan vlan 100 vni 100
vxlan flood vtep 2.2.2.2


vEOS-1(config-if-Vx1)#vxlan flood vtep 2.2.2.2
vEOS-1(config-if-Vx1)#sh ac
interface Vxlan1
vxlan multicast-group 227.0.0.1
vxlan source-interface Loopback0
vxlan udp-port 4789
vxlan vlan 100 vni 100
vxlan flood vtep 2.2.2.2
vEOS-1(config-if-Vx1)#ping 10.0.100.2
PING 10.0.100.2 (10.0.100.2) 72(100) bytes of data.
80 bytes from 10.0.100.2: icmp_seq=1 ttl=64 time=13.3 ms
...

--- 10.0.100.2 ping statistics ---
5 packets transmitted, 5 received, 0% packet loss, time 52ms
rtt min/avg/max/mdev = 10.522/11.491/13.303/1.028 ms, ipg/ewma 13.107/12.336 ms
vEOS-1(config-if-Vx1)#sh vxlan address-table
Vxlan Mac Address Table
----------------------------------------------------------------------

VLAN Mac Address Type Prt VTEP Moves Last Move
---- ----------- ---- --- ---- ----- ---------
100 0800.2732.55e8 DYNAMIC Vx1 2.2.2.2 1 0:00:07 ago
Total Remote Mac Addresses for this criterion: 1


vEOS-2(config-if-Vx1)#sh vxlan address-table
Vxlan Mac Address Table
----------------------------------------------------------------------

VLAN Mac Address Type Prt VTEP Moves Last Move
---- ----------- ---- --- ---- ----- ---------
100 0800.2734.9233 DYNAMIC Vx1 1.1.1.1 1 0:00:55 ago
Total Remote Mac Addresses for this criterion: 1


Ok all is good in the world now let’s completely remove all multicast configuration, clear mac address-tables one more time and re-validate:

vEOS-1(config-if-Vx1)#no vxlan multicast-group 227.0.0.1
vEOS-1(config-if-Vx1)#no router pim sparse-mode
vEOS-1(config)#no ip multicast-routing

vEOS-2(config)#no ip multicast-routing

vEOS-1(config)#sh ip mroute
% ipv4 multicast routing is not configured on VRF default.
vEOS-2(config)#sh ip mroute
% ipv4 multicast routing is not configured on VRF default.

vEOS-2(config)#clear mac address-table dynamic

vEOS-1(config)#clear mac address-table dynamic

vEOS-1(config)#ping 10.0.100.2
PING 10.0.100.2 (10.0.100.2) 72(100) bytes of data.
80 bytes from 10.0.100.2: icmp_seq=1 ttl=64 time=15.8 ms
...
--- 10.0.100.2 ping statistics ---
5 packets transmitted, 5 received, 0% packet loss, time 59ms
rtt min/avg/max/mdev = 10.997/12.411/15.886/1.861 ms, pipe 2, ipg/ewma 14.958/14.050 ms
vEOS-1(config)#sh vxlan address-table
Vxlan Mac Address Table
----------------------------------------------------------------------

VLAN Mac Address Type Prt VTEP Moves Last Move
---- ----------- ---- --- ---- ----- ---------
100 0800.2732.55e8 DYNAMIC Vx1 2.2.2.2 1 0:00:12 ago
Total Remote Mac Addresses for this criterion: 1

vEOS-1(config)#sh ip arp
Address         Age (sec)  Hardware Addr   Interface
10.0.0.2          0:25:53  0800.2732.55e8  Vlan1, Ethernet1
10.0.0.3          0:25:53  0800.2742.ed7e  Vlan1, Ethernet1
10.0.100.2        0:25:40  0800.2732.55e8  Vlan100, Vxlan1
192.168.100.100   0:00:00  0a00.2700.0014  Management1

Ok all is good, we are running VXLAN with a completely unicast flooding configuration, no multicast needed.

Next post we will begin layering in EVPN!


Breaking stuff! VXLAN

Posted by SDNgeek on January 31, 2020
Posted in: Uncategorized. 2 Comments

Ok, in my last post I setup very basic VXLAN with multicast. Let’s break different components and observe the behavior. First we’ll break basic IP reach-ability between loop-backs. Then we will break multicast and observe. The next post we will fix our broken multicast (which is very prone to happen in production) and migrate our configuration to a unicast control plane.

LETS BURN IT DOWN!

VXLAN on fire.png

First let’s simply shutdown VLAN 1 SVI on vEOS-2:

vEOS-2#sh vxlan vtep
Remote VTEPS for Vxlan1:
1.1.1.1
Total number of remote VTEPS:  1

vEOS-2#sh vxlan vni
VNI to VLAN Mapping for Vxlan1
VNI       VLAN       Source       Interface       802.1Q Tag
--------- ---------- ------------ --------------- ----------
100       100        static       Vxlan1          100

vEOS-2(config)#int vlan 1
vEOS-2(config-if-Vl1)#shut

It’s important to note VXLAN interface still shows up (connected) even though vEOS-2 is totally layer 3 isolated:

vEOS-2#sh int vxlan1
Vxlan1 is up, line protocol is up (connected)
Hardware is Vxlan
Source interface is Loopback0 and is active with 2.2.2.2
Replication/Flood Mode is multicast
Remote MAC learning via Datapath
VNI mapping to VLANs
Static VLAN to VNI mapping is
[100, 100]
Note: All Dynamic VLANs used by VCS are internal VLANs.
Use 'show vxlan vni' for details.
Static VRF to VNI mapping is not configured
Multicast group address is 227.0.0.1
MLAG Shared Router MAC is 0000.0000.0000
VTEP address mask is None

vEOS-2#sh ip route

 C        2.2.2.2/32 is directly connected, Loopback0
 C        10.0.100.0/24 is directly connected, Vlan100
 C        192.168.100.0/24 is directly connected, Management1

vEOS-2#ping 1.1.1.1
connect: Network is unreachable

vEOS-2#sh ip os ne
Neighbor ID     Instance VRF      Pri State                  Dead Time   Address         Interface
vEOS-2#sh ip mroute

227.0.0.1
  0.0.0.0, 23:20:50, RP 1.1.1.1, flags: W
    Incoming interface: Null
    Outgoing interface list:
      Loopback0
  2.2.2.2, 3:35:56, flags: SRL
    Incoming interface: Loopback0
    RPF route: [U] 2.2.2.2/32 [0/0]
    Outgoing interface list:
      Register


Note, we can ping both the local vlan 200 SVI and the virtual-router IP:

vEOS-2#sh ip virtual-router
IP virtual router is configured with MAC address: 0000.1111.1111


Interface Vrf Virtual IP Address Protocol State
--------------- ------------- ------------------------ -------------- ------
Vl100 default 10.0.100.100 U active


vEOS-2#ping 10.0.100.2
PING 10.0.100.2 (10.0.100.2) 72(100) bytes of data.
80 bytes from 10.0.100.2: icmp_seq=1 ttl=64 time=0.096 ms

--- 10.0.100.2 ping statistics ---
5 packets transmitted, 5 received, 0% packet loss, time 1ms
rtt min/avg/max/mdev = 0.010/0.047/0.096/0.032 ms, ipg/ewma 0.325/0.069 ms
vEOS-2#ping 10.0.100.100
PING 10.0.100.100 (10.0.100.100) 72(100) bytes of data.
80 bytes from 10.0.100.100: icmp_seq=1 ttl=64 time=0.057 ms

--- 10.0.100.100 ping statistics ---
5 packets transmitted, 5 received, 0% packet loss, time 1ms
rtt min/avg/max/mdev = 0.011/0.020/0.057/0.018 ms, ipg/ewma 0.288/0.038 ms

vEOS-3 can reach vEOS-1 VLAN 100 SVI and virtual-router IP via the layer 3 leaked route still but cannot reach vEOS-2:

vEOS-3#ping 10.0.100.100
PING 10.0.100.100 (10.0.100.100) 72(100) bytes of data.
80 bytes from 10.0.100.100: icmp_seq=1 ttl=64 time=12.2 ms
...

--- 10.0.100.100 ping statistics ---
5 packets transmitted, 5 received, 0% packet loss, time 53ms
rtt min/avg/max/mdev = 11.261/14.609/18.637/2.718 ms, pipe 2, ipg/ewma 13.427/13.333 ms

vEOS-3#ping 10.0.100.1
PING 10.0.100.1 (10.0.100.1) 72(100) bytes of data.
80 bytes from 10.0.100.1: icmp_seq=1 ttl=64 time=12.5 ms
...

--- 10.0.100.1 ping statistics ---
5 packets transmitted, 5 received, 0% packet loss, time 50ms
rtt min/avg/max/mdev = 10.513/16.497/28.823/6.825 ms, pipe 2, ipg/ewma 12.526/14.858 ms

vEOS-3#ping 10.0.100.2
PING 10.0.100.2 (10.0.100.2) 72(100) bytes of data.

--- 10.0.100.2 ping statistics ---
5 packets transmitted, 0 received, 100% packet loss, time 45ms

Ok, let’s bring back up layer 3:

vEOS-2(config)#int vlan 1
vEOS-2(config-if-Vl1)#no shut
vEOS-2(config-if-Vl1)#sh ip os ne
Neighbor ID Instance VRF Pri State Dead Time Address Interface
10.0.0.1 1 default 1 FULL/BDR 00:00:33 10.0.0.1 Vlan1
10.0.0.3 1 default 1 FULL/DR 00:00:31 10.0.0.3 Vlan1
vEOS-2(config-if-Vl1)#ping 10.0.100.1
PING 10.0.100.1 (10.0.100.1) 72(100) bytes of data.
80 bytes from 10.0.100.1: icmp_seq=1 ttl=64 time=17.3 ms
...

--- 10.0.100.1 ping statistics ---
5 packets transmitted, 5 received, 0% packet loss, time 65ms
rtt min/avg/max/mdev = 10.839/13.793/17.711/3.070 ms, pipe 2, ipg/ewma 16.456/15.386 ms


vEOS-1#sh ip arp
Address Age (sec) Hardware Addr Interface
10.0.0.2 2:08:21 0800.2732.55e8 Vlan1, Ethernet1
10.0.0.3 1:15:33 0800.2742.ed7e Vlan1, Ethernet1
10.0.100.2 3:59:35 0800.2732.55e8 Vlan100, Vxlan1
192.168.100.100 0:00:00 0a00.2700.0014 Management1

And now let’s break multicast:

Note: this still is showing VXLAN interface as up (connected)

vEOS-2(config-if-Vl1)#sh run int vlan 1
interface Vlan1
ip address 10.0.0.2/24
ip ospf area 0.0.0.0
pim ipv4 sparse-mode
vEOS-2(config-if-Vl1)#no pim ipv4 sparse-mode

vEOS-2#sh ip pim rp
Group: 224.0.0.0/4
RP: 1.1.1.1
Uptime: 1d0h, Expires: never, Priority: 0, Override: False


vEOS-2#ping 1.1.1.1
PING 1.1.1.1 (1.1.1.1) 72(100) bytes of data.
80 bytes from 1.1.1.1: icmp_seq=1 ttl=64 time=6.37 ms
....

--- 1.1.1.1 ping statistics ---
5 packets transmitted, 5 received, 0% packet loss, time 30ms
rtt min/avg/max/mdev = 5.657/6.473/7.013/0.461 ms, ipg/ewma 7.515/6.416 ms


vEOS-2#sh ip mroute
1.1.1.1, 1:09:24, flags: S
Incoming interface: Null
Outgoing interface list:
Loopback0
2.2.2.2, 4:55:54, flags: SRL
Incoming interface: Loopback0
RPF route: [U] 2.2.2.2/32 [0/0]
vEOS-2#ping 10.0.100.2
PING 10.0.100.2 (10.0.100.2) 72(100) bytes of data.
80 bytes from 10.0.100.2: icmp_seq=1 ttl=64 time=0.088 ms
....

--- 10.0.100.2 ping statistics ---
5 packets transmitted, 5 received, 0% packet loss, time 1ms
rtt min/avg/max/mdev = 0.011/0.037/0.088/0.032 ms, ipg/ewma 0.320/0.061 ms
vEOS-2#ping 10.0.100.1
PING 10.0.100.1 (10.0.100.1) 72(100) bytes of data.

--- 10.0.100.1 ping statistics ---
5 packets transmitted, 0 received, 100% packet loss, time 45ms

vEOS-2#ping 10.0.100.100
PING 10.0.100.100 (10.0.100.100) 72(100) bytes of data.
80 bytes from 10.0.100.100: icmp_seq=1 ttl=64 time=0.036 ms
....

--- 10.0.100.100 ping statistics ---
5 packets transmitted, 5 received, 0% packet loss, time 1ms
rtt min/avg/max/mdev = 0.011/0.016/0.036/0.010 ms, ipg/ewma 0.312/0.026 ms


vEOS-2#sh int vxlan 1
Vxlan1 is up, line protocol is up (connected)
  Hardware is Vxlan
  Source interface is Loopback0 and is active with 2.2.2.2
  Replication/Flood Mode is multicast
  Remote MAC learning via Datapath
  VNI mapping to VLANs
  Static VLAN to VNI mapping is
    [100, 100]
  Note: All Dynamic VLANs used by VCS are internal VLANs.
        Use 'show vxlan vni' for details.
  Static VRF to VNI mapping is not configured
  Multicast group address is 227.0.0.1
  MLAG Shared Router MAC is 0000.0000.0000
  VTEP address mask is None
vEOS-2#sh vxlan vni
VNI to VLAN Mapping for Vxlan1
VNI       VLAN       Source       Interface       802.1Q Tag
--------- ---------- ------------ --------------- ----------
100       100        static       Vxlan1          100

Note: * indicates a Dynamic VLAN

Next post we’ll migrate from multicast to unicast control plan configuration.

VXLAN Basics

Posted by SDNgeek on January 30, 2020
Posted in: Uncategorized. Leave a comment

Finally getting some skills sharpening lab time working on some VXLAN configurations and figured I would share my thoughts on VXLAN as I go. Why use VXLAN? Where to use VXLAN? Where NOT to use VXLAN? Today I’m going to start with the absolute basics. This configuration is useful for very simple layer 2 extension for example development environments, failover testing and initial DCI (Data Center Interconnect) setup use cases.

First, the obvious issue with VXLAN is it’s flood and learn behavior. Since VXLAN is really nothing more than layer 2 transport UDP encapsulation there is no mechanism for intelligent learning. The most basic VXLAN configuration is to use multicast to share learned host information. In many environments this is actually just fine but in large environments this can break down quickly.

In this blog series I am going to step through the control plane evolution starting with multicast, then unicast and on to EVPN. EVPN is a beast of it’s own so we will kick off a new series of advanced EVPN topics.

LAB SETUP

I like to use very simple labs to test protocols rather than large elaborate labs that take more time to setup, break and troubleshoot. I like to quickly be able to break things to see how devices and protocols react. I’m using a simple 3x Arista vEOS lab configured as such:

VXLAN simple.png

For the lab setup I’m following this Arista vEOS virtual box guide:

https://eos.aristanetworks.com/2012/11/veos-and-virtualbox/

I’m following this simple VXLAN configuration guide from Arista

https://www.arista.com/en/um-eos/eos-section-22-3-vxlan-configuration

BASE CONFIGURATION

At it’s core VXLAN configuration is very simple. If you are familiar with other encapsulations like GRE or IPSec this is very similar. You need a pair of routed IPs, namely loopbacks for VXLAN. Configure a VXLAN interface and set your loopback as your source address. They key difference between other unicast encapsulation is that a multicast destination is used for the tunnel destination in VXLAN … thus the flood part of the flood and learn behavior.

In my lab I’ve made vEOS-1 a static multicast RP. Assuming basic lab is setup with credentials and reachable management IPs or you can just use the console.

vEOS global configuration

ip routing
ip multicast-routing

Base layer 3 connectivity

vEOS-1#sh run int vlan 1
interface Vlan1
   ip address 10.0.0.1/24
   ip ospf area 0.0.0.0
   pim ipv4 sparse-mode

vEOS-2#sh run int vlan 1
interface Vlan1
   ip address 10.0.0.2/24
   ip ospf area 0.0.0.0
   pim ipv4 sparse-mode

vEOS-3#sh run int vlan 1
interface Vlan1
   ip address 10.0.0.3/24
   ip ospf area 0.0.0.0
   pim ipv4 sparse-mode
Multicast configuration

vEOS-1#sh run | sec pim
interface Vlan1
ip address 10.0.0.1/24
ip ospf area 0.0.0.0
pim ipv4 sparse-mode
!
router pim sparse-mode
ipv4
rp address 1.1.1.1
rp candidate Loopback0

vEOS-2#sh run | sec pim
interface Vlan1
ip address 10.0.0.2/24
ip ospf area 0.0.0.0
pim ipv4 sparse-mode
!
router pim sparse-mode
ipv4
rp address 1.1.1.1

vEOS-3#sh run | sec pim
interface Vlan1
ip address 10.0.0.3/24
ip ospf area 0.0.0.0
pim ipv4 sparse-mode
!
router pim sparse-mode
ipv4
rp address 1.1.1.1

SVI configuration

vEOS-1#sh run int vlan 100
interface Vlan100
ip address 10.0.100.1/24
ip virtual-router address 10.0.100.100

vEOS-2#sh run int vlan 100
interface Vlan100
ip address 10.0.100.2/24
ip virtual-router address 10.0.100.100

Layer 2 VXLAN configuration

vEOS-1#sh run int vxlan 1
interface Vxlan1
vxlan multicast-group 227.0.0.1
vxlan source-interface Loopback0
vxlan udp-port 4789
vxlan vlan 100 vni 100

vEOS-2#sh run int vxlan 1
interface Vxlan1
vxlan multicast-group 227.0.0.1
vxlan source-interface Loopback0
vxlan udp-port 4789
vxlan vlan 100 vni 100

Layer 3 VXLAN configuration

route-map vxlanvlan permit 10
match interface Loopback0
!
route-map vxlanvlan permit 20
match interface Vlan100
!
router ospf 1
redistribute connected route-map vxlanvlan

At this point we have some basic reach-ability setup.

vEOS-1#sh ip os ne
Neighbor ID Instance VRF Pri State Dead Time Address Interface
10.0.0.3 1 default 1 FULL/DR 00:00:30 10.0.0.3 Vlan1
10.0.0.2 1 default 1 FULL/BDR 00:00:38 10.0.0.2 Vlan1

vEOS-1#sh lldp neigh
Port          Neighbor Device ID       Neighbor Port ID    TTL
---------- ------------------------ ---------------------- ----
Et1           vEOS-2                   Ethernet1           120
Et3           vEOS-3                   Ethernet1           120
Ma1           vEOS-2                   Management1         120
Ma1           0a00.2700.0014           0a00.2700.0014      3601
Ma1           vEOS-3                   Management1         120

vEOS-1#sh ip ro

C 1.1.1.1/32 is directly connected, Loopback0
O 2.2.2.2/32 [110/20] via 10.0.0.2, Vlan1
O 3.3.3.3/32 [110/20] via 10.0.0.3, Vlan1
C 10.0.0.0/24 is directly connected, Vlan1
C 10.0.100.0/24 is directly connected, Vlan100
C 192.168.100.0/24 is directly connected, Management1

vEOS-1 can now ping vlan 100 on vEOS-2 over the VXLAN tunnel. VXLAN address table is populated and injects the information in to arp table. Also Multicast S,Gs are built:

vEOS-1#ping 10.0.100.2
PING 10.0.100.2 (10.0.100.2) 72(100) bytes of data.
80 bytes from 10.0.100.2: icmp_seq=1 ttl=64 time=25.8 ms
...
5 packets transmitted, 5 received, 0% packet loss, time 73ms

vEOS-1#sh vxlan address-table
VLAN Mac Address Type Prt VTEP Moves Last Move
---- ----------- ---- --- ---- ----- ---------
100 0800.2732.55e8 DYNAMIC Vx1 2.2.2.2 1 0:00:01 ago
Total Remote Mac Addresses for this criterion: 1

vEOS-1#sh ip arp
Address Age (sec) Hardware Addr Interface
10.0.0.2 2:29:50 0800.2732.55e8 Vlan1, Ethernet1
10.0.0.3 1:37:01 0800.2742.ed7e Vlan1, Ethernet1
10.0.100.2 0:25:48 0800.2732.55e8 Vlan100, Vxlan1
192.168.100.100 0:00:00 0a00.2700.0014 Management1
vEOS-1#sh ip mroute
...
227.0.0.1
0.0.0.0, 20:08:56, RP 1.1.1.1, flags: W
Incoming interface: Register
Outgoing interface list:
Loopback0
Vlan1
1.1.1.1, 0:18:52, flags: SL
Incoming interface: Loopback0
RPF route: [U] 1.1.1.1/32 [0/0]
Outgoing interface list:
Vlan1
2.2.2.2, 0:17:30, flags: SNC
Incoming interface: Vlan1
RPF route: [U] 2.2.2.2/32 [110/20] via 10.0.0.2
Outgoing interface list:
Loopback0

We can see ARP learning progression by pinging back from vEOS-2 to vEOS-1:

vEOS-2#sh ip arp
Address Age (sec) Hardware Addr Interface
10.0.0.1 2:18:05 0800.2734.9233 Vlan1, Ethernet1
10.0.0.3 1:44:29 0800.2742.ed7e Vlan1, Ethernet3
10.0.100.1 0:32:58 0800.2734.9233 Vlan100, not learned
192.168.100.100 0:00:00 0a00.2700.0014 Management1
vEOS-2#ping 10.0.100.1
PING 10.0.100.1 (10.0.100.1) 72(100) bytes of data.
80 bytes from 10.0.100.1: icmp_seq=1 ttl=64 time=15.5 ms
80 bytes from 10.0.100.1: icmp_seq=2 ttl=64 time=13.9 ms
80 bytes from 10.0.100.1: icmp_seq=3 ttl=64 time=10.8 ms
80 bytes from 10.0.100.1: icmp_seq=4 ttl=64 time=10.8 ms
80 bytes from 10.0.100.1: icmp_seq=5 ttl=64 time=11.2 ms

--- 10.0.100.1 ping statistics ---
5 packets transmitted, 5 received, 0% packet loss, time 57ms
rtt min/avg/max/mdev = 10.801/12.463/15.513/1.920 ms, pipe 2, ipg/ewma 14.345/13.883 ms
vEOS-2#sh ip arp
Address Age (sec) Hardware Addr Interface
10.0.0.1 2:18:15 0800.2734.9233 Vlan1, Ethernet1
10.0.0.3 1:44:39 0800.2742.ed7e Vlan1, Ethernet3
10.0.100.1 0:33:08 0800.2734.9233 Vlan100, Vxlan1
192.168.100.100 0:00:00 0a00.2700.0014 Management1

vEOS-2 obviously prefers its locally connected route to the OSPF learned route from vEOS-1:

vEOS-2#sh ip os data

...

Type-5 AS External Link States

Link ID ADV Router Age Seq# Checksum Tag
10.0.100.0 10.0.0.1 48 0x80000003 0xd362 0


vEOS-2#sh ip route

O 1.1.1.1/32 [110/20] via 10.0.0.1, Vlan1
C 2.2.2.2/32 is directly connected, Loopback0
O 3.3.3.3/32 [110/20] via 10.0.0.3, Vlan1
C 10.0.0.0/24 is directly connected, Vlan1
C 10.0.100.0/24 is directly connected, Vlan100
C 192.168.100.0/24 is directly connected, Management1

However we didn’t create a vlan or SVI on vEOS-3 so vEOS-3 only knows about that prefix from OSPF so his Type-5 LSA is selected for injection into the routing table. Also notes he only knows about this prefix from vEOS-1. Now vEOS-3 can be used as a layer 3 transit for external communication.

vEOS-3#sh ip os data

Type-5 AS External Link States

Link ID ADV Router Age Seq# Checksum Tag
10.0.100.0 10.0.0.1 240 0x80000003 0xd362 0


vEOS-3#sh ip route

O 1.1.1.1/32 [110/20] via 10.0.0.1, Vlan1
O 2.2.2.2/32 [110/20] via 10.0.0.2, Vlan1
C 3.3.3.3/32 is directly connected, Loopback0
C 10.0.0.0/24 is directly connected, Vlan1
O E2 10.0.100.0/24 [110/1] via 10.0.0.1, Vlan1
C 192.168.100.0/24 is directly connected, Management1


vEOS-3#sh ip arp
Address Age (sec) Hardware Addr Interface
10.0.0.1 2:14:00 0800.2734.9233 Vlan1, Ethernet2
10.0.0.2 1:21:12 0800.2732.55e8 Vlan1, Ethernet2
192.168.100.100 0:00:00 0a00.2700.0014 Management1
vEOS-3#ping 10.0.100.1
PING 10.0.100.1 (10.0.100.1) 72(100) bytes of data.
80 bytes from 10.0.100.1: icmp_seq=1 ttl=64 time=11.6 ms
...

vEOS-3#ping 10.0.100.2
80 bytes from 10.0.100.2: icmp_seq=1 ttl=64 time=19.7 ms
...

vEOS-3#ping 10.0.100.100
80 bytes from 10.0.100.100: icmp_seq=1 ttl=64 time=10.8 ms
...


vEOS-3#sh ip arp
Address Age (sec) Hardware Addr Interface
10.0.0.1 2:14:29 0800.2734.9233 Vlan1, Ethernet2
10.0.0.2 1:21:40 0800.2732.55e8 Vlan1, Ethernet2
192.168.100.100 0:00:00 0a00.2700.0014 Management1

That’s pretty much it for the most basic VXLAN configuration you can have.

Note: We purposely left off HER (Head-End Replication) which is used if you need to propagate BUM (Broadcast, Multicast and Unknown Unicast) traffic over the tunnel.

Next up, let’s break some stuff!


How United Airlines Manages Visibility for a Global Network using Thousand Eyes

Posted by SDNgeek on January 16, 2018
Posted in: Uncategorized. Leave a comment

This is a re-post of a blog written by Archana Kesavan, Sr. Product Marketing Manager at Thousand Eyes referencing a presentation I did for Thousand Eyes Connect in Chicago October 2017.

I encourage you to visit their blog site for more informative content and other presentations from Connect events: https://blog.thousandeyes.com/


This October, we took ThousandEyes Connect to Chicago for the first time and were thrilled to host customer speakers from United Airlines and JLL. In this post, we will summarize the presentation by Brandon Mangold, Principal Operations Engineer at United Airlines.

TE connect

Figure 1: Brandon Mangold presenting at ThousandEyes Connect Chicago

In his talk at ThousandEyes Connect, Brandon walked through the United Airlines and ThousandEyes journey while highlighting the importance of correlating visibility across multiple networks and applications to manage a global network.

What does a Global Network Look Like?

Brandon kickstarted the session by giving the audience a glimpse of what a global enterprise network looks like. The United Airlines network is made up of 1000+ offices and over 400,000 employees (Brandon’s note: actually 85,000 employees but almost 400,000 users including contractors) accessing a myriad of applications for their day-to-day jobs. Apart from that, over 6 million internet users visit united.com every day. The enterprise backbone comprises of seven global contact centers and three private hybrid cloud data centers, hosting a variety of business-critical applications. Brandon and his team are responsible for managing United’s expansive global network with 9000 interconnected devices and four major service providers fueling the connectivity to the data centers.

Trial Gone Wild. Wildly Successful.

Brandon was first introduced to ThousandEyes at Network Field Day 12 in August 2016. He confesses that he had initially assumed ThousandEyes to be a platform to monitor only external Internet presence. However, the session revealed that he could do a lot more with ThousandEyes. Brandon said, “I learned a lot more about the product, especially about the Enterprise Agent. That’s really what got me interested.” Fired with this newly acquired knowledge, Brandon was very excited to kickstart the free trial and see what ThousandEyes could do for them. He related, “We lit up a very basic demo, from a couple of Cloud Agents to start monitoring the external Internet links on our website.”

Within two weeks into the trial, Brandon and his team were called on a P1 incident. A severe outage was rendering a large portion of their dot-com and mobile app unavailable to users all around the world. “United customers were unable to check-in to their flight or make a reservation online”, he said. While the team was looking for hints within their CDN provider (Akamai) and the application itself, Brandon decided to look at ThousandEyes data for clues. Brandon recounted, “Within 15 minutes of digging around, I had visible proof that Level3, our upstream ISP was dropping a large amount of packets.” A major Level 3 outage was affecting availability to United’s online facing assets. But, a global network is built to be foolproof for these type of outages, so the question remained as to why their CDN load-balancing solution was not kicking in?

Brandon described that “Level 3 was dropping a large amount of packets, but not enough for our global Akamai load balancer to switch over.” The fluctuating packet drops within Level 3 just allowed the right number of keep alives to get through, tricking Akamai to not initiate a failover. Confident that the outage clearly was within the operating realms of Level3, Brandon submitted a ticket and did a manual failover at Akamai to force traffic to go through a clean link. He depicted the result: “We were back up and running in no time. ThousandEyes saved us more than an hour and we hadn’t paid a dime for it yet!”

 TE 1

Figure 2: Upstream ISP outage at Level 3 affected United customers across the globe.

During many instances in his presentation, Brandon emphasised the importance of having visibility into your networks and applications. He commented, “You can’t know what you can’t see. Before ThousandEyes I had zero visibility into upstream provider issues.”

Tackling Tricky VoIP Quality

After witnessing early success with the trial, Brandon decided to test the ThousandEyes VoIP functionality to tackle a pesky voice issue that had been haunting his team for a month. Multiple branch locations were experiencing a pronounced degradation in voice quality resulting in numerous IT tickets. Brandon explained that within 10 minutes of setting up an Enterprise Agent from two branch locations, he was able to narrow down the root cause. He says “I lit up a couple of Enterprise Agents and triggered a basic voice test, simulating Expedited Forwarding (EF) traffic. Within 10 minutes, we narrowed down the problem to a device within our internal MPLS network that was remarking VoIP EF traffic to best effort.” It turned out that their MPLS service provider had misconfigured QoS settings at the customer edge (CE) router that adversely affected VoIP packets (Figure 3) .

TE 2

Figure 3: VoIP packets being remarked at the MPLS edge

The Flight Ahead: Integrating Network and Application Monitoring

“While the motivation for ThousandEyes was primarily to serve as a network monitoring platform and get visibility into upstream service provider networks and BGP changes, we are starting to see the possibilities it opens for application monitoring”, said Brandon. Actively monitoring HTTP application performance while keeping the network in perspective gives both network and application teams a common platform to rely on. Brandon explained, “We would like to bring teams together so we can have a common view of the intersection between network and applications.”

United is also extending their implementation of VoIP to include dashboards and reports that show deviation in MoS scores. Brandon added that he’s a big fan of standard deviation charts, as its the fastest way to identify anomalies.

Interested in learning more about how our customers monitor their networks? Stay tuned for more posts summarizing talks from JLL, Viacom and McGraw-Hill.

https://blog.thousandeyes.com/

Brain dump: network visibility

Posted by SDNgeek on January 15, 2018
Posted in: cloud computing, data center, network management. Tagged: data, saas, visibility. 1 Comment

I started this blog and while back and never finished. Here is a quick brain dump of some of my thoughts on the state of monitoring and visibility in data networks.

I feel that network operators from time to time forget the purpose of their role. It’s understandable in the day to day grind. We keep building our network up to provide better capacity and up time but in that never ending cycle trying to keep up we might not think so much about the end result – the user experience.

To that end, network performance and management tools are focused on helping us to make sure that we keep up with the status quo of keeping the packets flowing and staying ahead of capacity needs. However, as IT systems in general become more and more complex due to mobility of endpoints and workload, increasingly complex and integrated systems and security concerns, status quo is likely no longer good enough.

We need to understand at a more intricate level how the network may or may not be impacting application performance. An obvious example of the changes that are driving the need for greater visibility is an ever increasing presence SaaS offerings that are critical to business operation.

It has become very obvious to me that we need tools that no longer just measure network performance on capacity and up time. We desperately need tools quickly and easily identify network performance from the view of the endpoint and the application.

Enter the cloud! This is where the story gets exciting with several very helpful SaaS solutions now available that are capable of vastly enhancing an organization’s visibility and many only take minutes, hours or days to enable and begin getting telemetry data.

Two very good examples I feel are App Dynamics (https://www.appdynamics.com/) and Thousand Eyes (https://www.thousandeyes.com/)

App Dynamics is a client based monitoring platform for applications. I have seen remarkable improvements in application up-time metrics in organizations that have adopted this platform. App Dynamics excels in passive monitoring of application performance and works well at analyzing baseline application performance and creating KPI metrics that can be used to tune standard deviation alerting.

Thousand Eyes is a network monitoring and synthetic traffic generation tool. Unlike App Dynamics it is technically client-less (meaning it doesn’t need to be installed or integrated with on servers or network devices). Rather at it’s core Thousand Eyes VMs send synthetic traffic to a target IP or URL and records a large amount of data about the target. It maps the network paths, hops and links, reports on latency metrics from the VMs perspective. It is very useful in monitoring critical applications up time and performance and giving insight into networks that are not under a common administrative domain (IE provider or multi-tenant networks).

App Dynamics and Thousand Eyes are both branching out to enhance their capabilities. App Dynamics for example is adding network transaction detail and Thousand Eyes has both a user agent that can passively capture transaction performance from and endpoints perspective as well as can be used for limited synthetic traffic generation. Thousand Eyes is also working on a ‘device layer’ capabilities, in short the ability to pull down SNMP information from devices under the same administrative domain to give further insight into device and link performance.

Of course there are many other solutions on the market. I just wanted to highlight two that I have seen in action and both of which have provided significant value and impact almost immediately.

The industry still seems to have much work to do in this area and I think that this will be an ongoing topic for years to come. But the accelerated pace at which innovation can happen in SaaS offerings is exciting to witness.

Instant graph-ification

Posted by SDNgeek on October 3, 2016
Posted in: network management. Tagged: network operations. 1 Comment

Sometimes you just want something now! Look, I appreciate that some things take time but in the fast paced world of technology sometimes I need it now! Like yesterday!

In the world of network visibility there are new solutions in development that promise greater insight, greater visibility, predictive analytics and so on but is visibility really the issue? Or is our ability to consume the data we already have more the issue? The problem is really twofold so what is being done to solve this issue?

From experience, gaining network visibility especially for replay of events usually involves running several time consuming reports. The way in which we troubleshoot irregular operations today often leads to much delay in resolution. Using what we’ll just refer to as an ‘exotic seven figure tool’ I have personally waited as long as 30 minutes to build connection table for replay of events.

I was recently highly impressed with a presentation by one of the vendors at Network Field Day 12, Kentik. In summary, what I perceive that Kentik has built is a highly optimized big data back end which is capable of consuming, organizing and presenting the data in near real-time fashion. Kentik continually injests data from data sources such as NetFlow, sFlow, IPFIX, SNMP and BGP and can return a wealth of data based on this information in near real time for the last 90 days or longer!

Check out the following data analysis video for more detail.

https://vimeo.com/178673383 

In short, I was highly impressed and I believe that tools like this are going to be critical as the complexity and volume of data that operators need to sort through is only going to continue to increase.

If you are like me trying to deal with managing complex infrastructures with little to no downtime I need more data, more often, more readily accessible. I need it all and I need it now! If so Kentik is definately worth taking a look at.

Disclaimer: I don’t get paid to write any of this stuff, I just get to hang out with a lot of really smart people for a week which is worth a lot so … assume what you want.

Cloud security made simple

Posted by SDNgeek on September 8, 2016
Posted in: cloud computing, data center, Linux, NDF12, network security, security design. Tagged: #NFD12, Cloud security, firewall. Leave a comment

What do you think is the biggest roadblock to cloud adoption for Enterprises? Is it the cost? Is it the complexity to deploy workload? Is it the time to market? No of course not, it is generally the same dilemma wherever you go: security.

How am I going to keep my data secure in the clouds of the interwebz? There have been a lot of good ideas and potential solutions but either they are far too complex, overly limit deployment options or they  simply do not provide enough control.

Enter one of my favorite vendors from Network Field Day 12: Illumio. Let me start by saying that their solution is rather simple and a technical overview will not blow you away. This is also precisely why I love their solution. It is very simple yet should effectively meet the needs of most organizations.

I can see this solution being fine for almost any workload you would be willing to put in the cloud. I still think long term Enterprises are going to need to own some infrastructure for highest sensitivity of data. But that is normally far and away the minority of the data for most organizations.

How does Illumio work?

In summary it is a centrally controlled but distributed enforcement of host based firewall using IPtables or Windows filtering… yeah, that’s it. No overlays or abstractions or endpoint security products. Just firewall tools that have been available from the beginning.

Now of course that isn’t all there is to the solution. Likely the first problem you will think of is policy. Ok, so I can already use the firewall capabilities right now but we don’t because building a policy for each VM is not only a nightmare, it is virtually impossible.

Enter Illumio PCE (Policy Compute Engine) which is the central brain of the solution and it  agent based discovery of communication behavior.

PCE builds enforcement policy based on standard graph theory in which it paints application dependency map which is then exposed in a declarative policy model. Yah … that is a mouth full but we should all understand declarative models by now. This is how Cisco ACI and many other similar solutions work. The declarative model simply describes what an application needs to the infrastructure and allows the distributed intelligence of the  fabric to build forwarding elements to meet these requirements.

Now of course this requires an endpoint agent to do the discover and then to interpret the policy into what in this case extrapolates out into a firewall policy. These endpoint agents are known simply as a VEN – Virtual Enforcement Node.

There are a few deployment models for both brownfield installation of the VENs and then of course the recommended long term approach is to bake a VEN into the VM image.

In summary, all in all, the solution appears to be what I would describe as simple elegance. It achieves the key objectives in securing workloads while keeping the actual policy enforcement very simple. The secret sauce is of course how the PCE is able to learn and build the policy elements. This is where the vast majority of effort to tune and optimize the solution is going to concentrated. All in all I was very impressed. For more information please check out Illumio’s website and their NFD 12 presentation:

https://www.illumio.com/product-overview

Illumio Presents at Networking Field Day 12

Brocade impressions from #NFD9

Posted by SDNgeek on March 23, 2015
Posted in: NFD9, SDN. Tagged: NFD9, SDN. 1 Comment

I came in very excited about the real world potential of Brocade’s Vyatta Controller and I left no less enthusiastic. For a quick summary Brocade has announced that they are building a commercially packaged version of the Open Daylight controller. Think RedHat for Linux. What excites me about this is the fact that at the very least this is a nice potential stepping stone for Enterprises into OpenFlow and SDN in general and at best this is going to be a dominant driver of SDN adoption across Enterprise environments.

To state the obvious: the vast majority of Enterprises are more risk adverse than tech oriented companies like hosting providers and web-scale and to a degree ISPs as well. A commercially packaged SDN controller, especially one that is based fundamentally on OpenSource, is going to ease the initial adoption concerns for most businesses.

Brocade-Vyatta-Controller-1024x575 ovnc-2015the-new-ip-open-networking-architecture-with-sdn-nfv-34-638

I am going to cut this post short because I have been waiting to publish this for too long. I had planned to install BVC (Brocade Vyatta Controller) in a mininet lab and blog some thoughts with around that along with this blog post but alas I have not yet made the time to do so. I am still planning to do a follow up blog post with these impressions, hopefully sooner than later.

I will end by summarizing that Brocade is doing a lot of good things and doing them the right way. I can’t help but feel that they are going to pick up some additional market share in the IP (Internet Protocol) and will likely be a major force in SDN in the years to come. I will also leave you with a host of really great resources that I am using for my planned follow up blog post:

http://www.slideshare.net/naimnetworks/the-new-ip-open-networking-architecture-with-sdn-nfv

http://packetpushers.net/show-206-brocades-opendaylight-based-vyatta-sdn-controller-sponsored/

Cisco ACI impressions from #NFD9

Posted by SDNgeek on March 2, 2015
Posted in: ACI, data center, NFD9. Tagged: ACI, Cisco, data center, NFD9. 4 Comments

If you held a gun to my head and told me to pick the best solution for a next generation data center network solution for a large enterprise with a myriad of requirements such as multi-hypervisor and a moderate amount of physical hosts … I would pick Cisco ACI.

Frankly, I didn’t learn anything new from the NFD presentation about ACI but the one big takeaway I got from it is that a wider audience is beginning to at least understand the theory of the solution. Carly Stoughton (@_vCarly) did an excellent job with her whiteboard presentation and explanation of ACI and it was probably the most effective whiteboard presentation I have ever seen. If you have not seen the videos and you are still perplexed by what Cisco means by ‘Application Centric’ and what makes it different watch the video below. Fundamentally, the answer is the policy model but just watch the video:

You can also find the other videos from the Cisco ACI presentation here:

http://techfieldday.com/appearance/cisco-presents-at-networking-field-day-9/

Again, my biggest takeaway is that I noticed that the Cisco sales team is starting to understand he solution and they are figuring out how to craft the message so that others can easily understand it.

If you want my thoughts on ACI in general you can see my previous blogs on the subject:

https://ccie31104.wordpress.com/2014/09/24/cisco-aci-vs-vmware-nsx/

https://ccie31104.wordpress.com/2015/02/06/early-thoughts-on-network-field-day-9-vendors/

Cloudgenix impressions from #NFD9

Posted by SDNgeek on February 27, 2015
Posted in: NFD9, SDN, WAN. Tagged: NFD9, SD-WAN, SDN, WAN. 2 Comments

I came in asking for a software only SD-WAN solution and guess what, I got my wish! I think what Cloudgenix is doing is amazing and it is exactly what the industry needs in this space. In short they are fusing a cloud managed, application routed, encrypted overlay via a software router.

There is really a lot to digest here so if this topic interests you I encourage you to just watch the videos. There isn’t a lot of information out there on Cloudgenix outside of the NFD videos:

http://techfieldday.com/appearance/cloudgenix-presents-at-networking-field-day-9/

A few highlights on the solution:

  • Provides dynamic, multi-path application level route control
  • VXLAN over IPSec encapsulation of traffic
    • ION Fabric: full mesh of endpoints built on top of your existing WAN
  • Software routers (you can buy a generic x86 appliance from them if you would like)
  • Horizontally scaleable up to multi-gig of encrypted traffic

The Cloudgenix solution also provides many of the add-on application features that WAN optimizer can provide such as FEC (Forward Error Correction) and SAS optimization. At the end of the day Velocloud and Cloudgenix deliver a very similar solution but the main differentiation is that Cloudgenix is focused on a pure software delivery model.

The demo that Cloudgenix presented at NFD9 was very similar to that of Velocloud but Cloudgenix was focused on showing the perspective of a network administrator looking at how the solution responds to WAN issues whereas Velocloud’s demo showed the impact from a user perspective.

All in all SD-WAN is an exciting topic and I am going to be very interested in watching the development of these solutions. In the mean time I leave you with this nice little info-graphic explaining why we all need SD-WAN:

Posts navigation

← Older Entries
  • Recent Posts

    • VXLAN unicast flooding
    • Breaking stuff! VXLAN
    • VXLAN Basics
    • How United Airlines Manages Visibility for a Global Network using Thousand Eyes
    • Brain dump: network visibility
  • Archives

    • January 2020
    • January 2018
    • October 2016
    • September 2016
    • March 2015
    • February 2015
    • September 2014
    • September 2013
    • June 2013
    • February 2013
    • January 2013
    • December 2012
    • June 2012
    • May 2012
    • April 2012
    • March 2012
    • February 2012
    • January 2012
    • December 2011
    • November 2011
  • Categories

    • ACI
    • ccde
    • ccie
    • ccie 31104
    • ccie security
    • Cisco
    • cloud
    • cloud computing
    • CSAr
    • data center
    • LAN
    • Linux
    • NDF12
    • network architecture
    • network design
    • network engineering
    • network management
    • network security
    • NFD9
    • SDN
    • security design
    • SIEM
    • Uncategorized
    • WAN
    • wireless
  • Meta

    • Create account
    • Log in
    • Entries feed
    • Comments feed
    • WordPress.com
Blog at WordPress.com.
CCIE #31104, what's next?
Blog at WordPress.com.
Privacy & Cookies: This site uses cookies. By continuing to use this website, you agree to their use.
To find out more, including how to control cookies, see here: Cookie Policy
  • Subscribe Subscribed
    • CCIE #31104, what's next?
    • Join 42 other subscribers
    • Already have a WordPress.com account? Log in now.
    • CCIE #31104, what's next?
    • Subscribe Subscribed
    • Sign up
    • Log in
    • Report this content
    • View site in Reader
    • Manage subscriptions
    • Collapse this bar
 

Loading Comments...
 

    Design a site like this with WordPress.com
    Get started