A complete data pipeline running on Microsoft Fabric that downloads public data, transforms it into a star schema, exports it as Delta Lake tables, and serves it through a Power BI semantic model with Direct Lake — all from a single Python notebook and using pure SQL
all the code is available in github
and Interactive DAG
The entire stack:
- One Fabric notebook (2 cells)
- DuckDB as the compute engine — could have been Polars or Lakesail, just a personal preference to be honest
- dbt as the transformation framework
- A Python script to deploy everything via Fabric REST API
- GitHub for source control, documentation, and testing
Note: DuckDB is not officially supported by Microsoft Fabric. Every effort is made to ensure compatibility with OneLake.
Overall Architecture

Why DuckDB + Delta Export
Microsoft Fabric’s lakehouse uses Delta Lake or Apache Iceberg as its table format. Power BI’s Direct Lake mode reads the data directly from OneLake. So whatever engine you use, you need to produce Delta Lake files on OneLake.
DuckDB cannot write Delta Lake natively (it is experimental at this stage). It has its own table format via the DuckLake extension, but DuckLake writes Parquet files with a DuckDB/SQLite/PostgreSQL metadata catalog.
OneLake catalog has only Iceberg read support, so that’s not an option for now.
The solution: delta_export, a community DuckDB extension that exports DuckLake tables as Delta Lake. The pipeline works like this:
- dbt transforms data into DuckLake tables (Parquet + metadata)
ducklake_rewrite_data_filesandducklake_merge_adjacent_filescompact the Parquet filesCALL delta_export()converts every DuckLake table into a proper Delta Lake table on OneLake
Without delta_export, DuckLake is not useful in this context. DuckLake manages tables internally, but Fabric has no idea what a SQLite metadata catalog is. It needs Delta transaction logs.
From dbt_project.yml:
on-run-end: - "CALL ducklake_rewrite_data_files('ducklake')" - "CALL ducklake_merge_adjacent_files('ducklake')" - "CALL delta_export()"DuckLake: How It Works and Its Limitations
DuckLake stores table metadata in a database and writes data as Parquet files to any storage backend (local, S3, Azure). The DuckDB connection looks like this:
# profiles.yml (prod target)attach: - path: "ducklake:sqlite:{{ env_var('METADATA_LOCAL_PATH') }}" alias: ducklake options: data_path: "{{ env_var('ROOT_PATH') }}/Tables" data_inlining_row_limit: 0METADATA_LOCAL_PATH points to /lakehouse/default/Files/metadata.db — the Files section of the OneLake lakehouse. In a Fabric notebook, /lakehouse/default/ is a local mount of the lakehouse storage. The SQLite file lives right there on OneLake, persisting across notebook runs without any special sync logic. data_path points to the Tables section on OneLake (abfss://...). DuckDB computes in memory, DuckLake tracks what’s in each table via SQLite, and Parquet files land on OneLake.
The single-writer limitation. DuckLake when used with a file-based DB is basically a single-writer architecture. Only one process can write to a DuckLake database at a time. This means:
- No parallel pipeline runs
- No concurrent notebooks writing to the same tables
- The Fabric pipeline is set to
concurrency: 1specifically because of this
For this use case, it’s fine — one notebook runs every hour, processes new files, and exits. But if you need concurrent writers, DuckLake is not the right choice.
Obviously you can use PostgreSQL as a catalog, but that makes the architecture more complex.
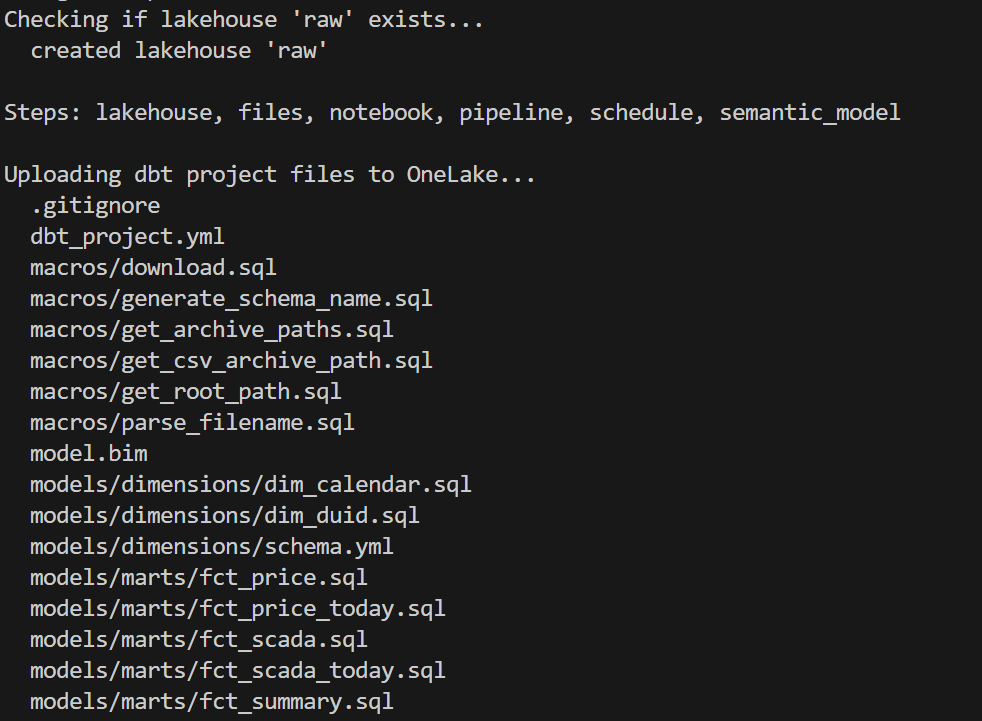
dbt as the Orchestrator
dbt does everything here — not just transformations. The on-run-start hook downloads data from the web, archives it to OneLake, and tracks state in a parquet log. The on-run-end hook compacts files and exports Delta.
on-run-start: - "CALL ducklake.set_option('rewrite_delete_threshold', 0)" - "CALL ducklake.set_option('target_file_size', '128MB')" - "{{ download() }}"on-run-end: - "CALL ducklake_rewrite_data_files('ducklake')" - "CALL ducklake_merge_adjacent_files('ducklake')" - "CALL delta_export()"The download() macro (371 lines) handles:
- Fetching daily SCADA and price reports from AEMO’s website
- Fetching intraday 5-minute dispatch data
- Downloading generator reference data
- Archiving everything as partitioned ZIPs on OneLake
- Maintaining a
csv_archive_log.parquetfile for deduplication
The 8 dbt models then process this data:
- stg_csv_archive_log — view over the archive log
- dim_calendar — date dimension (one-time load)
- dim_duid — generator unit reference (smart refresh: only rebuilds when new generators appear)
- fct_scada, fct_price — daily historical data, incremental by file
- fct_scada_today, fct_price_today — intraday data, incremental by file
- fct_summary — combined fact table exposed to Power BI
Every fact model uses file-based incremental processing. Pre-hooks query the archive log, filter out already-processed files, and set DuckDB VARIABLEs with the remaining ZIP paths. The model’s SQL reads from those paths. Next run, those files are skipped.
The Semantic Model: AI-Generated from Thin Air
This is the part that surprises me the most. The model.bim file — the Power BI semantic model definition — was generated entirely by AI (Claude). No Power BI Desktop. No click-through wizards. No SSDT.
The model.bim is a JSON file in TMSL (Tabular Model Scripting Language) format. It defines:
- 3 tables exposed to Power BI: dim_calendar, dim_duid, fct_summary
- 5 hidden tables (raw layer, not needed for reporting)
- 2 relationships (fact → dimension)
- 5 DAX measures (Total MW, Total MWh, Avg Price, Generator Count, Latest Update)
- Direct Lake partitions pointing to Delta tables on OneLake
Notice I am using pure Direct Lake mode that does not fall back to SQL:
{ "name": "PBI_ProTooling", "value": "[\"RemoteModeling\", \"DirectLakeOnOneLakeCreatedInDesktop\"]"}The M expression for the data source:
let Source = AzureStorage.DataLake("{{ONELAKE_URL}}", [HierarchicalNavigation=true])in Source{{ONELAKE_URL}} is a placeholder. The deploy script substitutes it with the actual OneLake URL at deploy time.
Each table partition maps to a Delta table on OneLake:
{ "mode": "directLake", "source": { "type": "entity", "entityName": "fct_summary", "expressionSource": "DirectLake", "schemaName": "aemo" }}This maps to Tables/aemo/fct_summary/ — exactly where DuckLake + delta_export writes the Delta files.
AI generated all of this by reading the dbt schema definitions (column names, types, descriptions) and understanding the Direct Lake requirements. No manual TMSL authoring. No reverse engineering from Power BI Desktop. The entire semantic model is version-controlled, diffable, and deployable via API.
Poor Man CI/CD, No Service Principal
deploy_to_fabric.py is a single Python script that deploys everything to Fabric using the REST API. It has 6 steps:
- lakehouse — Create the OneLake lakehouse (with schema support)
- files — Upload all dbt project files to
Files/dbt/ - notebook — Create a 2-cell notebook (install deps + run dbt)
- pipeline — Create a pipeline that runs the notebook
- schedule — Set up hourly cron schedule
- semantic_model — Deploy model.bim with Direct Lake config + refresh
You can run any subset: python deploy_to_fabric.py semantic_model deploys just the BIM.
Authentication uses az login — your browser opens, you sign in, done. The script reads from the production git branch (clones it into a temp directory) so what you deploy is always what’s been merged to production.
python deploy_to_fabric.py # deploy everythingpython deploy_to_fabric.py semantic_model # just the semantic modelpython deploy_to_fabric.py files notebook # just files + notebookand here is the script in action
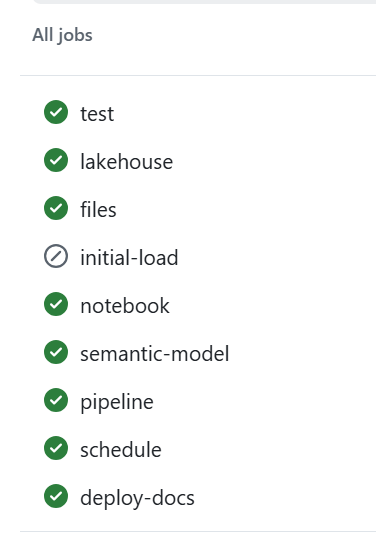
CI/CD
assuming you got pass the app registration in Azure, GitHub Actions handles CI — on every push and pull request to production:
Q&A
Why deploy to Fabric from local instead of from GitHub Actions?
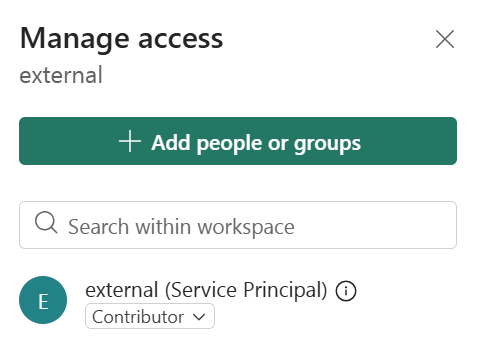
CI (testing, docs, DAG) runs in GitHub Actions — no cloud credentials needed, just Azurite. But Fabric deployment requires authenticating to the Fabric REST API, which means a service principal.
This is just my personal experience working in different companies. As a business user, there is almost zero chance IT will give permission to register an app. And even if a miracle happens, you still need to convince a Fabric admin. This is not a technical limitation, it is human behaviour.
Instead, deploy_to_fabric.py uses AzureCliCredential — you run az login, your browser opens, you sign in, done. The script picks up your existing identity. You already have the Fabric permissions. No secrets to store, no service principal to manage.
The tradeoff is that deployment requires a human at a keyboard. For a single-person or small-team project, that’s fine — you deploy when you’re ready, not on every push.
Why not just use Datawarehouse/Spark/Dataflow etc? It’s built into Fabric.
All those tools in Fabric are awesome, but it is a lakehouse and the whole point of a lakehouse is to use whatever you want as long as it produces Parquet and Delta/Iceberg metadata, ideally sorted with a decent row group size from 2M to 16M.
Why DuckLake instead of Delta or Iceberg?
- DuckDB Delta write support is still experimental.
- OneLake Catalog supports Iceberg read only.
If we had Iceberg write, that would be my first preference.
Why is the semantic model AI-generated?
Because it is cool  and it is unbelievable that AI managed to write it out of thin air and did cool stuff like generating descriptions so Power BI AI behaves better.
What happens if the pipeline fails mid-run?
The DuckLake metadata DB lives on OneLake (Files section). If the run fails mid-way:
- Downloaded source files are already archived on OneLake (no re-download needed)
- DuckLake metadata reflects whatever was committed before the failure
- Next run picks up where it left off using the archive log
The pipeline has a 1-hour timeout. If it hangs, Fabric kills it and the next hourly run starts fresh.
Can this scale?
Python notebooks scale to half a TB of RAM. If you need more, then you are reading the wrong blog
Where is TMDL?
I could not deploy using TMDL, even after feeding AI all kurt buhler articles bim seems to be better undersood at least for now.
Why use SQLite instead of DuckDB to store the metadata DB?
The Files section of OneLake is not a real POSIX filesystem. It is not like your local disk — it basically uses FUSE. All Python engines think it is a real filesystem, but I noticed SQLite works better than DuckDB for this. It flushes data more reliably.
What is skill
In this case, a skill is simply a way to capture what was learned during the work so the AI can reuse that knowledge later.
I wrote the skill after finishing the task, then asked the AI to summarize the key learnings and steps. The idea is that next time the AI runs a similar task, it will be better informed and produce better results.
This is not specific to Claude. The same approach works with Copilot as well. The format is different, but the idea is exactly the same: capture the knowledge once so the AI can reuse it later.
Parting Thoughts
Everything you have heard about AI is pretty much true. The only wrong part was the timing. We all knew about AI’s potential, but in my experience something changed around December 2025. Suddenly AI became genuinely useful — less hallucination, and it just works well enough. Especially when you can test the outcome. And that is the key insight: data engineering is, in a sense, just software engineering. AI writes the code, AI does everything. Your job as a user is to make sure the tests are comprehensive. Contrary to what you hear from professional software engineers, you don’t need to care about the general case. If it is solid enough and it works for your use case, that is all that matters. Nothing more.
There is another aspect worth mentioning. There is a real market for business users who are not programmers. There is enormous value in using your laptop as your main dev and test environment. You open VSCode, you talk to your favorite AI agent, you run dbt run, and you see results in seconds. That feedback loop changes everything. Data platforms like Fabric become a hosting environment with security boundaries, governance, and all that.
and if you are still reading, dbt test are just awesome !!!
]]>unfortunately both daft and chdb did not support reading from Onelake abfss
DuckDB iceberg read support is not new, but it is very slow, but the next version 1.5 made a massive improvements and now it is slightly faster than Delta
They all run the same SQL now
All five engines executed the exact same SQL. No dialect tweaks, no rewrites. The one exception: Polars failed on Query 11 with
`SQLSyntaxError: subquery comparisons with '>' are not supported` Everything else just worked,SQL compatibility across Python engines is basically solved in 2026. The differentiators are elsewhere.
Freshness vs. performance is a trade-off you should be making
import duckdbconn = duckdb.connect()conn.sql(f""" install delta_classic FROM community ;attach 'abfss://{ws}@onelake.dfs.fabric.microsoft.com/{lh}.Lakehouse/Tables/{schema}'AS db (TYPE delta_classic, PIN_SNAPSHOT); USE db """)`MAX_TABLE_STALENESS ‘5 minutes’` means the engine caches the catalog metadata and skips the round-trip for 5 minutes.
DuckDB’s Delta Classic does the same with `PIN_SNAPSHOT`.
import duckdbconn = duckdb.connect()conn.sql(f""" install delta_classic FROM community ;attach 'abfss://{ws}@onelake.dfs.fabric.microsoft.com/{lh}.Lakehouse/Tables/{schema}'AS db (TYPE delta_classic, PIN_SNAPSHOT); USE db """)Your dashboard doesn’t need sub-second freshness. Your reporting query doesn’t care about the last 30 seconds of ingestion. Declaring a staleness budget upfront – predictable, explicit – is not a compromise. It’s the right default for analytics.
Object store calls are the real bottleneck
Every engine reads from OneLake over ABFSS. Every Parquet file is a network call. It doesn’t matter how fast your engine scans columnar data in memory if it makes hundreds of HTTP calls to list files and read metadata before it starts.
– DuckDB Delta Classic (PIN_SNAPSHOT): caches the Delta log and file list at attach time. Subsequent queries skip the metadata round-trips.
– DuckDB Iceberg (MAX_TABLE_STALENESS): caches the Iceberg snapshot from the catalog API. Within the staleness window, no catalog calls.
– LakeSail: has native OneLake catalog integration (SAIL_CATALOG__LIST). You point it at the lakehouse, it discovers tables and schemas through the catalog. Metadata resolution is handled by the catalog layer, not by scanning storage paths, but it has no concept of cache, every query will call Onelake Catalog API
– Polars, DataFusion: resolve the Delta log on every query. Every query pays the metadata tax.
An engine that caches metadata will beat a “faster” engine that doesn’t. Every time, especially at scale.
How about writes?
You can write to OneLake today using Python deltalake or pyiceberg – that works fine. But native SQL writes (CREATE TABLE AS INSERT INTO ) through the engine catalog integration itself? That’s still the gap, lakesail can write delta just fine but using a path.
– LakeSail and DuckDB Iceberg both depend on OneLake’s catalog adding write support. The read path works through the catalog API, but there’s no write path yet. When it lands, both engines get writes for free.
– DuckDB Delta Classic has a different bottleneck: DuckDB’s Delta extension itself. Write support exists but is experimental and not usable for production workloads yet.
The bottom line
Raw execution speed will converge. These are all open source projects, developers read each other’s code, there’s no magical trick one has that others can’t adopt. The gap narrows with every release.
Catalog Integration and cache are the real differentiator. And I’d argue that even *reading* from OneLake is nearly solved now.
—
Full disclosure: I authored the DuckDB Delta Classic extension and the LakeSail OneLake integration (both with the help of AI), so take my enthusiasm for catalog integration with a grain of bias
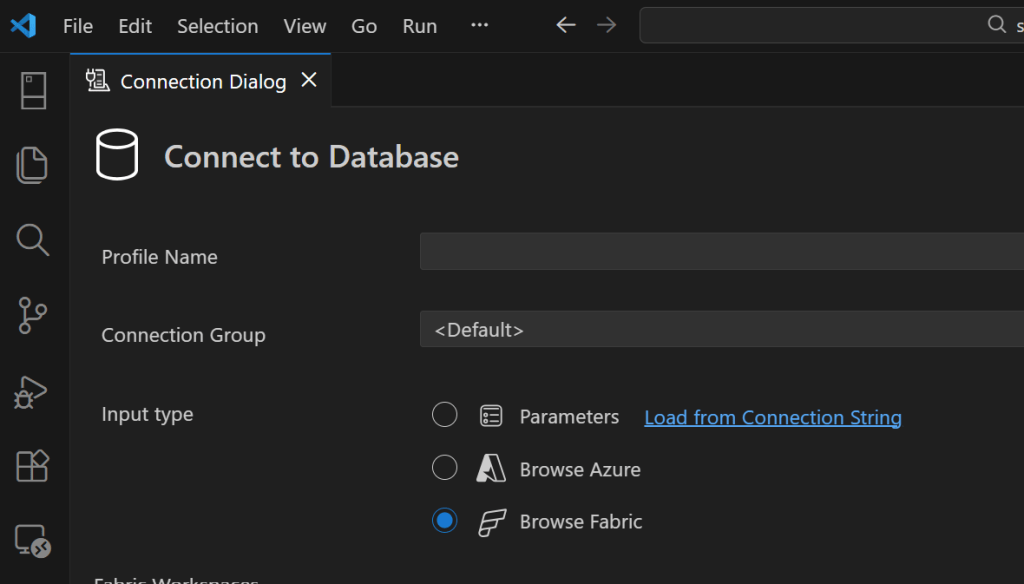
]]>However, if you try to access the storage directly from a Python notebook or a local engine running on your laptop, including open source Spark, direct access is blocked. Otherwise, Row Level Security and Column Level Security would be meaningless. Security only works when the engine itself is trusted and governed.
This blog show a workaround by laveraging SQL Endpoint, These policies are enforced at the SQL endpoint, meaning any external tool that connects through it — including DuckDB — automatically respects them.
Let’s walk through a quick example.
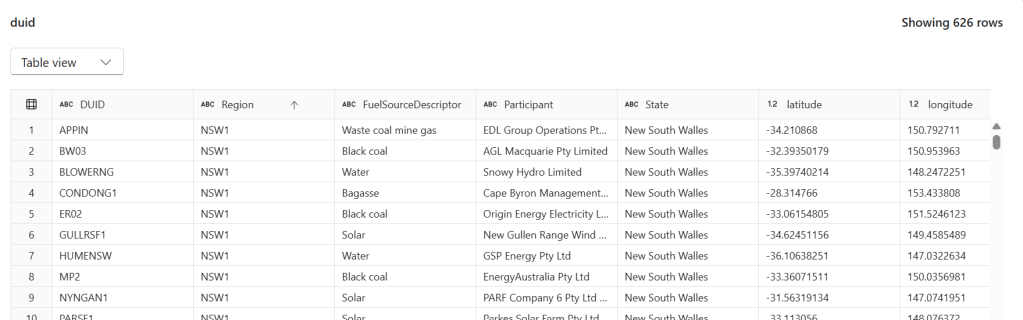
The Data
We have a power.duid table containing 626 rows of Australian power generation facilities. Columns include DUID, Region, FuelSourceDescriptor, Participant, State, latitude, and longitude.
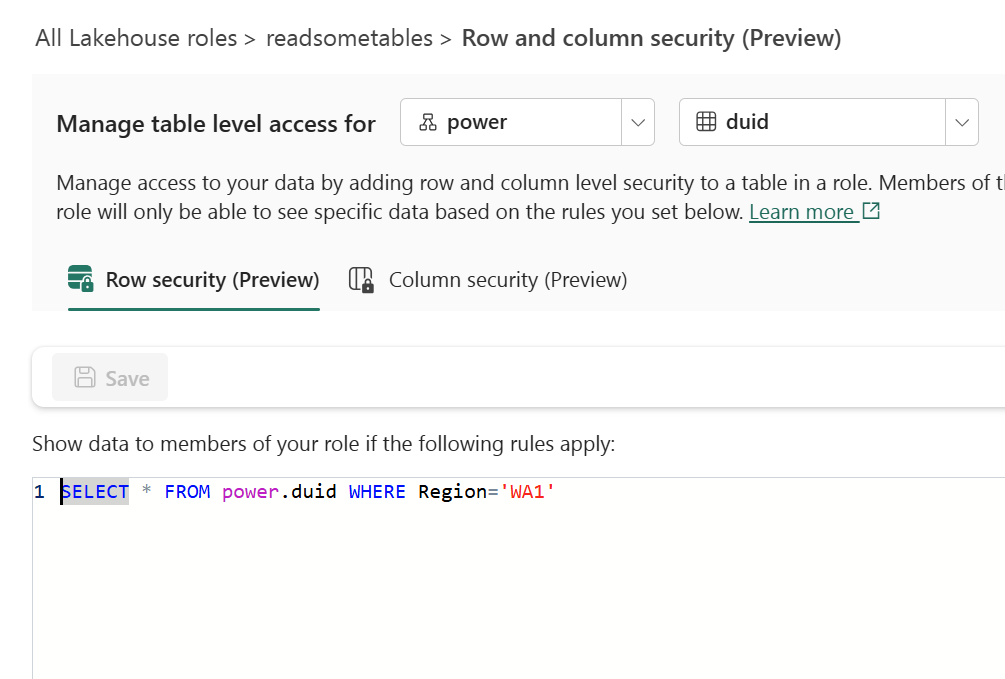
Configuring Row-Level Security
In the Lakehouse role readsometables, we add an RLS rule that restricts visibility to a single region:
SELECT * FROM power.duid WHERE Region='WA1'
Members of this role will only see rows where Region = 'WA1'.
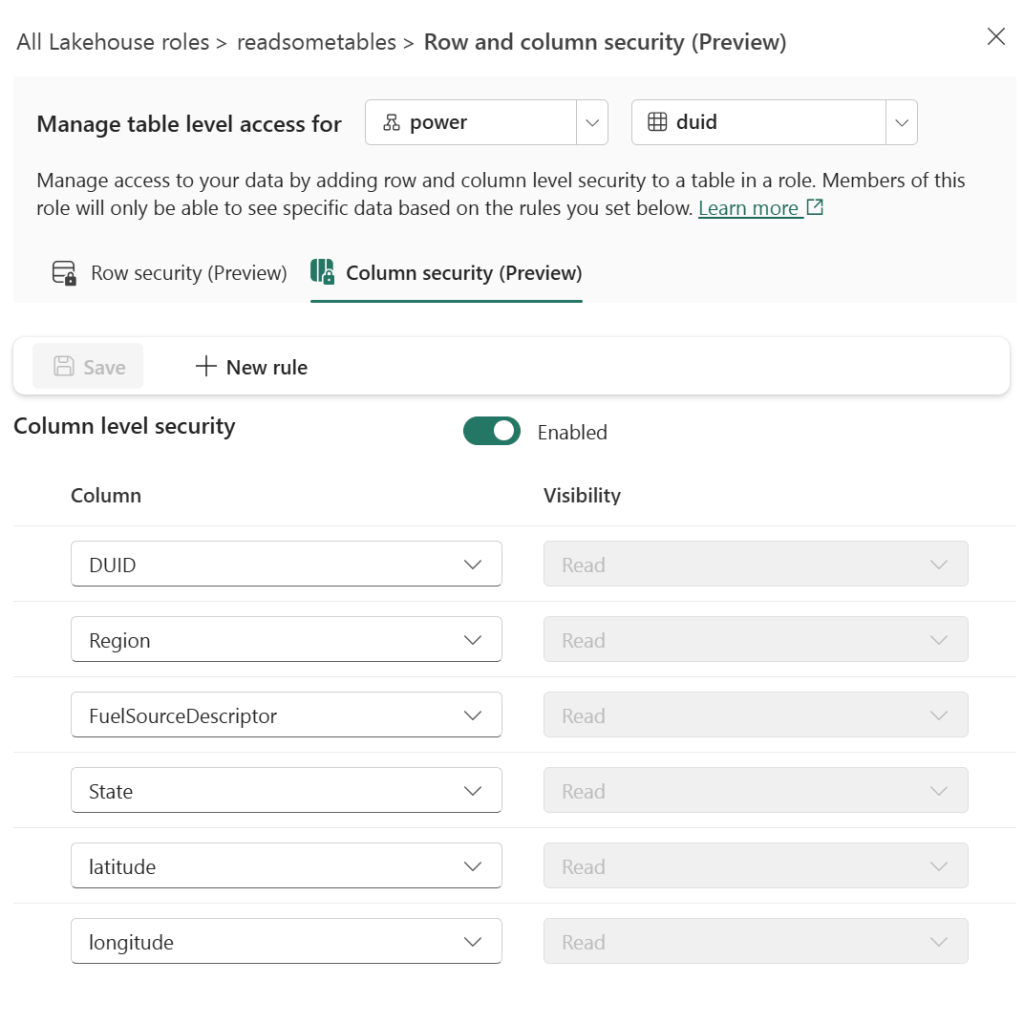
Configuring Column-Level Security
On the same role, we enable CLS and grant Read visibility only to specific columns: DUID, Region, FuelSourceDescriptor, State, latitude, and longitude. The Participant column is excluded.
Querying with DuckDB’s MSSQL Extension
From any Python environment, we can connect to the SQL endpoint using DuckDB’s community MSSQL extension and Azure authentication:
import duckdb
from azure.identity import DefaultAzureCredential

conn = duckdb.connect()
token = DefaultAzureCredential().get_token("https://database.windows.net/.default").token

conn.sql(f"""
    ATTACH IF NOT EXISTS
    'Server=<your-sql-endpoint>;Database=data'
    AS data (TYPE mssql, ACCESS_TOKEN '{token}')
""")
if you are running it inside Fabric notebook, first you need to updgrade duckdb,
!pip install duckdb --upgrade
import sys
sys.exit(0)
the run this code
import duckdb
conn = duckdb.connect()
token = notebookutils.credentials.getToken('sql')
conn.sql(f"""
                install mssql from community ;
                ATTACH if not exists
                'Server=SQL_endpoint;Database=data'
                AS data (TYPE mssql, ACCESS_TOKEN '{token}')
          """)
Now when we query, RLS and CLS are enforced server-side:
conn.sql("SELECT DISTINCT(Region) FROM data.power.duid").show()
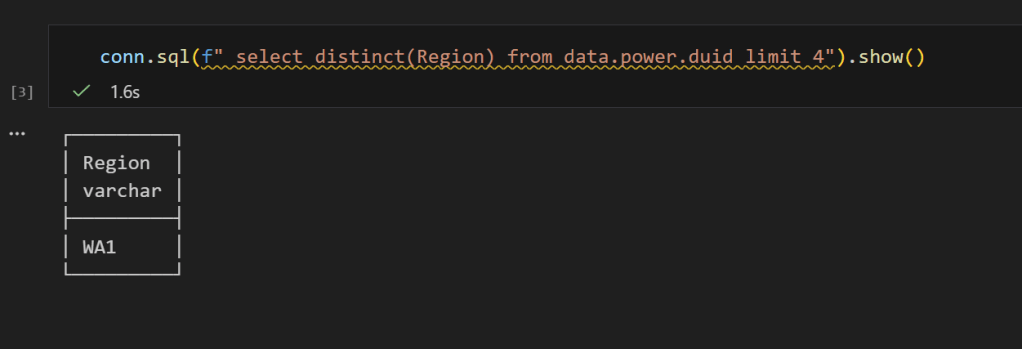
Only WA1 — the RLS filter is working. And if we select all columns:
conn.sql("SELECT * FROM data.power.duid LIMIT 4").show()
you get an error, that you can not select Participant
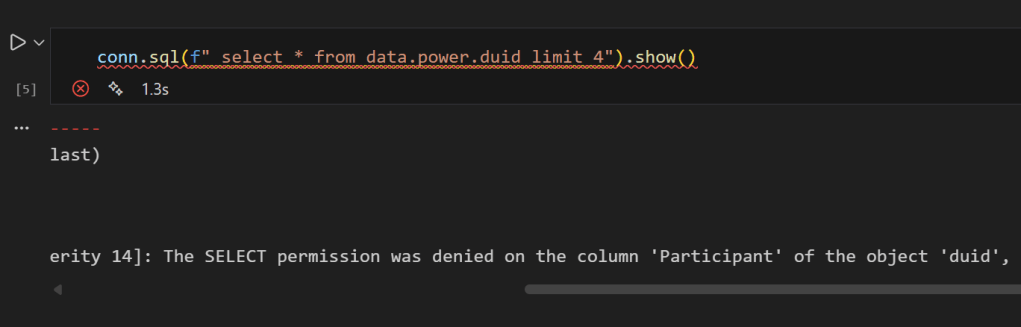
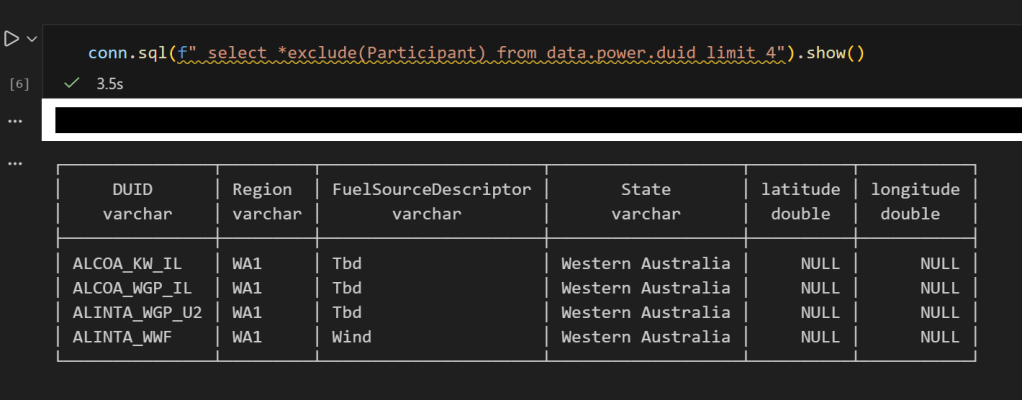
No Participant column — CLS is doing its job, now if you remove it , everything works fine
I don’t know much about SQL Server. The closest I ever got to it was having read only access to a database. I remember 10 years ago we had a use case for a database, and IT decided for some reason that we were not allowed to install SQL Server Express. Even though it was free and a Microsoft product. To this day, it is still a mystery to me, anyway, at that time I was introduced to PowerPivot and PowerQuery, and the rest was history.
Although I knew very little about SQL Server, I knew that SQL Server users are in love with the product. I worked with a smart data engineer who had a very clear world view:
I used SQL Server for years. It is rock solid. I am not interested in any new tech.
At the time, I thought he lacked imagination. Now I think I see his point.
When SQL Server was added to Fabric, I was like, oh, that’s interesting. But I don’t really do operational workloads anyway, so I kind of ignored it.
Initially I tried to make it fit my workflow, which is basically developing Python notebooks using DuckDB or Polars (depending on my mood) inside VSCode with GitHub Copilot. and deploy it later into Fabric, of course you can insert a dataframe into SQL Server, but it did not really click for me at first. To be clear, I am not saying it is not possible. It just did not feel natural in my workflow( messing with pyodbc is not fun).
btw the SQL extension inside VSCode is awesome
A week ago I was browsing the DuckDB community extensions and I came across the mssql extension. And boy !!! that was an emotional rollercoaster (The last time I had this experience was when I first used tabular editor a very long time ago).
You just attach a SQL Server database using either username and password or just a token. That’s it. The rest is managed by the extension, suddenly everything make sense to me!!!
conn = duckdb.connect()

if PLATFORM == 'fabric':
    token = DefaultAzureCredential().get_token("https://database.windows.net/.default").token
# notebookutils.credentials.getToken("sql") inside Fabric notebook
    for attempt in range(3):
        try:
            conn.sql(f"""
                ATTACH IF NOT EXISTS
                'Server={host};Database={db}'
                AS db (TYPE mssql, ACCESS_TOKEN '{token}')
            """)
            break
        except Exception as e:
            if attempt < 2:
                print(f"Attempt {attempt+1} failed, waiting 60s for serverless wake-up...")
                time.sleep(60)
            else:
                raise e
else:
    conn.sql(f"""
        ATTACH OR REPLACE
        'Server={host},{pr};Database={db};User Id={user};Password={pw};Encrypt=yes'
        AS db (TYPE mssql)
    """)

conn.sql("SET mssql_query_timeout = 6000; SET mssql_ctas_drop_on_failure = true;")
print(f"Connected to SQL Server via {PLATFORM}")
again, I know there other ways to load data which are more efficiently, but if I have a small csv that I processed using python, nothing compare to the simplicity of a dataframe, in that week; here are some things I learned, I know it is obvious for someone who used it !!! but for me, it is like I was living under a rock all these years
if you run show all tables in duckdb, you get something like this

TDS and bulk insertion
You don’t need ODBC. You can talk to SQL Server directly using TDS, which is the native protocol it understands. There is also something called BCP, which basically lets you batch load data efficiently instead of pushing rows one by one. Under the hood it streams the data in chunks, and the performance is actually quite decent. It is not some hacky workaround. It feels like you are speaking SQL Server’s own language, and that changes the whole experience.

SQL Server is not only for OLTP
Turns out people use SQL Server for analytics too, with columnar table format.
CREATE CLUSTERED COLUMNSTORE INDEX cci_{table}
ON {schema}.{table}
ORDER ({order_col});
I tested a typical analytical benchmark and more or less it performs like a modern single node data warehouse.
Accelerating Analytics for row store
Basically, there is a batch mode where the engine processes row-based tables in batches instead of strictly row by row. The engine can apply vectorized operations, better CPU cache usage, and smarter memory management even on traditional rowstore tables. It is something DuckDB added with great fanfare to accelerate PostgreSQL heap tables. I was a bit surprised that SQL Server already had it for years.
RLS/CLS for untrusted Engine
If you have a CLS or RLS Lakehouse table and you want to query it from an untrusted engine, let’s say DuckDB running on your laptop, today, you can’t for a good reason as the direct storage access is blocked, this extension solves it, as you query the SQL Endpoint itself.
Most of fancy things were already invented
Basically, many of the things’ people think are next generation technologies were already implemented decades ago. SQL control flow, temp tables, complex transactions, fine grained security, workload isolation, it was all already there.
I think the real takeaway for me; user experience is as important – if not more- than the SQL Engine itself, and when a group of very smart people like something then there is probably a very good reason for it.
]]>it is a quick post on how to query Onelake Iceberg REST Catalog using pure SQL with DuckDB, and yes you need a service principal that has access to the lakehouse
CREATE or replace PERSISTENT secret onelake_identity_iceberg (
    TYPE ICEBERG,
    CLIENT_ID 'xxxxxxxxxxxxxx',
    CLIENT_SECRET 'yyyyyyyyyyyyyyyyyyy' ,
    OAUTH2_SCOPE   'https://storage.azure.com/.default' ,
    OAUTH2_SERVER_URI 'https://login.microsoftonline.com/TENANT_ID /oauth2/v2.0/token' ,
    ENDPOINT 'https://onelake.table.fabric.microsoft.com/iceberg'
);
CREATE or replace PERSISTENT secret azure_spn (
    TYPE azure,
    PROVIDER service_principal,
    TENANT_ID 'ccccccc',
    CLIENT_ID 'iiiiiiiiiiiiii',
    CLIENT_SECRET 'xbndlfrewi' ,
    ACCOUNT_NAME 'onelake'
);
it works reasonably well assuming your region is not far from your laptop, or even better , if you run it inside Fabric then there is no network shenanigans, I recorded a video showing my experience
Why read operations do not always need full consistency checks
I hope DuckDB eventually adds an option that allows turning off table state checks for purely read scenarios. The current behaviour is correct because you always need the latest state when writing in order to guarantee consistency. However, for read queries it feels unnecessary and hurts the overall user experience. PowerBI solved this problem very well with its concept of framing, and something similar in DuckDB would make a big difference, notice duckdb delta reader already support pin version.
]]>To show the impact of read performance for Vordered Parquet vs sorted Parquet, I ran some tests. I spent a lot of time ensuring I was not hitting the hot cache, which would defeat the purpose. One thing I learned is to test only one aspect of the system carefully.
Cold Run: Data loaded from OneLake with on-the-fly building of dictionaries, relationships, etc
Warm Run: Data already in memory format.
Hot Run: The system has already scanned the same data before. You can disable this by calling the ClearCache command using XMLA (you cannot use a REST API call).
Prepare the Data
Same model, three dimensions, and one fact table, you can generate the data using this notebook
- Deltars: Data prepared using Delta Rust sorted by
date,id, thentime. - Spark_default: Same sorted data but written by Spark.
- Spark_vorder: Manually enabling Vorder (Vorder is off by default for new workspaces).
Note: you can not sort and vorder at the same time, at least in Spark, DWH seems to support it just fine
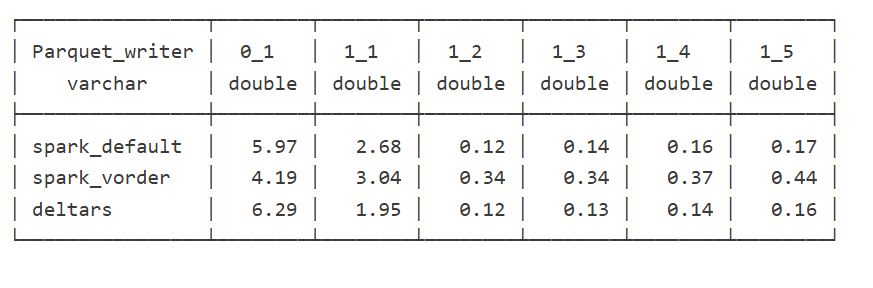
The data layout is as follows:
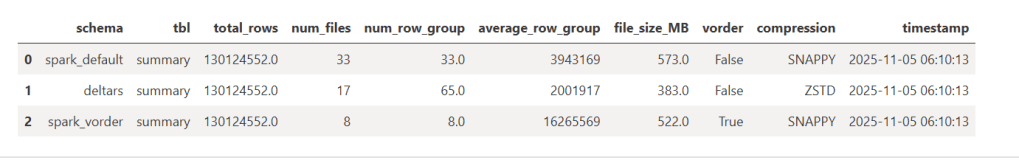
I could not make Delta Rust produce larger row groups. Notice that ZSTD gives better compression, although it seems Power BI has to uncompress the data in memory, so it seems it is not a big deal
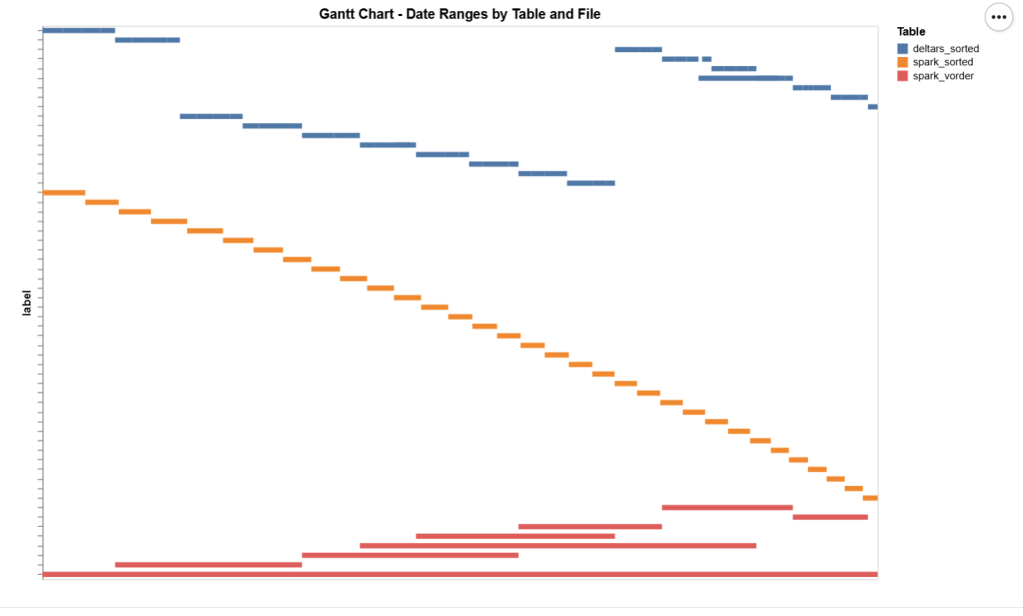
I added a bar chart to show how the data is sorted per date. As expected, Vorder is all over the place, the algorithm determines that this is the best row reordering to achieve the best RLE encoding.
The Queries
The queries are very simple. Initially, I tried more complex queries, but they involved other parts of the system and introduced more variables. I was mainly interested in testing the scan performance of VertiPaq.
Basically, it is a simple filter and aggregation.
The Test
You can download the notebook here :
def run_test(workspace, model_to_test):
    for i, dataset in enumerate(model_to_test):
        try:
            print(dataset)
            duckrun.connect(f"{ws}/{lh}.Lakehouse/{dataset}").deploy(bim_url)
            run_dax(workspace, dataset, 0, 1)
            time.sleep(300)
            run_dax(workspace, dataset, 1, 5)
            time.sleep(300)
        except Exception as e:
            print(f"Error: {e}")
    return 'done'
Deploy automatically generates a new semantic model. If it already exists, it will call clearvalue and perform a full refresh, ensuring no data is kept in memory. When running DAX, I make sure ClearCache is called.
The first run includes only one query; the second run includes five different queries. I added a 5-minute wait time to create a clearer chart of capacity usage.
Capacity Usage
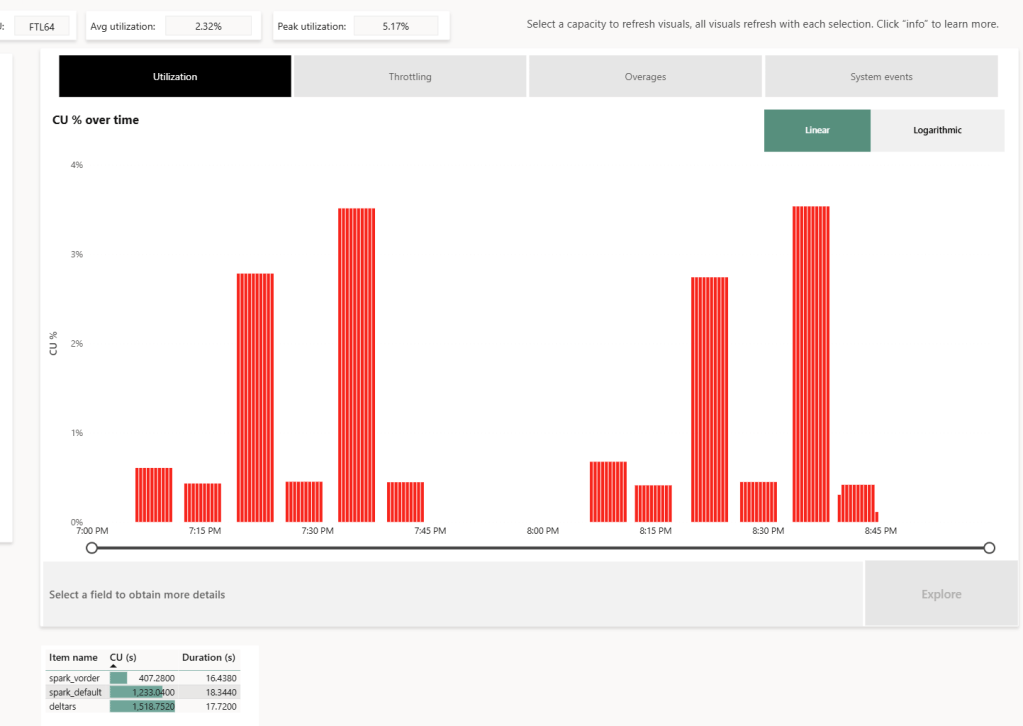
To be clear, this is not a general statement, but at least in this particular case with this specific dataset, the biggest impact of Vorder seems to appear in the capacity consumption during the cold run. In other words:
Transcoding a vanilla Parquet file consumes more compute than a Vordered Parquet file.
Warm runs appear to be roughly similar.
Impact on Performance
Again, this is based on only a couple of queries, but overall, the sorted data seems slightly faster in warm runs (although more expensive). Still, 120 ms vs 340 ms will not make a big difference. I suspect the queries I ran aligned more closely with the column sorting—that was not intentional.
Takeaway
Just Vorder if you can. Make sure you enable it when starting a new project. ETL, data engineering have only one purpose, make the experience of the end users the best possible way, ETL job that take 30 seconds more is nothing compared to a slower PowerBI reports.
now if you can’t, maybe you are using a shortcut from an external engine, check your powerbi performance if it is not as good as you expect then make a copy, the only thing that matter is the end user experience.
Another lesson is that VertiPaq is not your typical OLAP engine; common database tricks do not apply here. It is a unique engine that operates entirely on compressed data. Better-RLE encoded Parquet will give you better results, yes you may have cases where the sorting align better with your queries pattern, but in the general case, Vorder is always the simplest option.

Luckily, we have a tradition at work , whenever something security-related comes up, we just ping Amnjeet
He showed me how it works , and I have to say, I loved it. It’s refreshingly simple.
You can download the notebook here:
You just select a folder in your Lakehouse and turn it on.
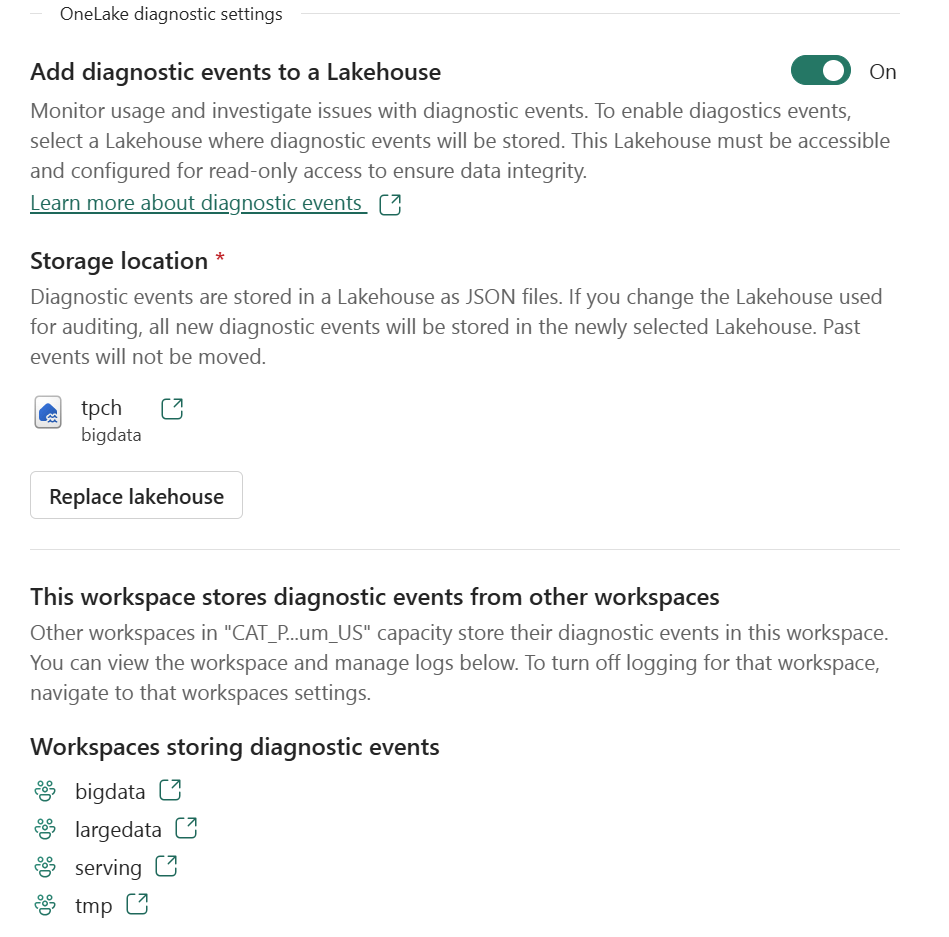
That’s it , the system automatically starts generating JSON files, neatly organized using Hive-style partitions, By default, user identity and IP tracking are turned off unless an admin explicitly enables them. You can find more details about the schema and setup here.
What the Logs Look Like
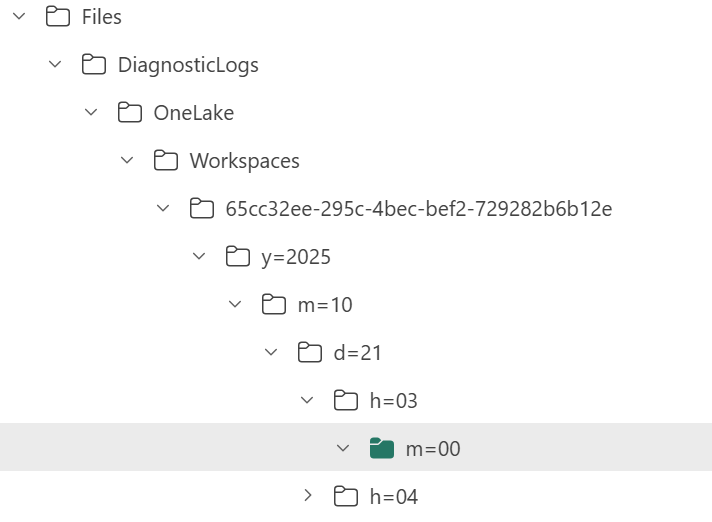
Currently, the logs are aggregated at the hourly level, but the folder structure also includes a partition for minutes (even though they’re all grouped at 00 right now).
Parsing the JSON Logs
Once the logs were available, I wanted to do some quick analysis , not necessarily about security, just exploring what’s inside.
There are probably half a dozen ways to do this in Fabric ; Shortcut Transform, RTI, Dataflow Gen2, DWH, Spark, and probably some AI tools too, Honestly, that’s a good problem to have.
But since I like Python notebooks and the data is relatively small, I went with DuckDB (as usual), but Instead of using plain DuckDB and delta_rs to store the results, I used my little helper library, duckrun, to make things simpler ( Self Promotion alert).
Then I asked Copilot to generate a bit of code for registering existing functions to look up the workspace name and lakehouse name from their GUIDs in DuckDB, using SQL to call python is cool
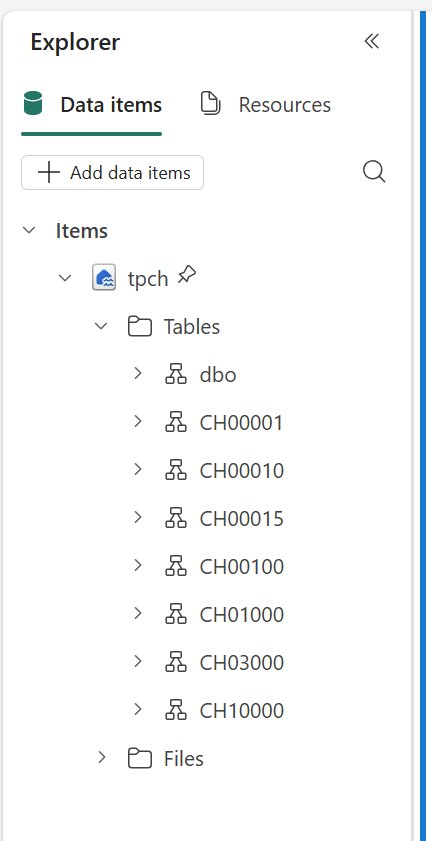
The data is stored incrementally, using the file path as a key , so you end up with something like this:
import duckrun

con = duckrun.connect('bigdata/tpch.lakehouse/dbo')

onelake_logs_path = (
    'abfss://[email protected]/'
    'tpch.Lakehouse/Files/DiagnosticLogs/OneLake/Workspaces/*/'
    'y=*/m=*/d=*/h=*/m=*/*.json'
)
Then I added only the new logs with this SQL script:
try:
    con.sql(f"""
        CREATE VIEW IF NOT EXISTS logs(file) AS SELECT 'dummy';
        SET VARIABLE list_of_files =
        (
            WITH new_files AS (
                SELECT file
                FROM glob('{onelake_logs_path}')
                WHERE file NOT IN (SELECT DISTINCT file FROM logs)
                ORDER BY file
            )
            SELECT list(file) FROM new_files
        );
        SELECT * EXCLUDE(data), data.*, filename AS file
        FROM read_json_auto(
            GETVARIABLE('list_of_files'),
            hive_partitioning = true,
            union_by_name = 1,
            FILENAME = 1
        )
    """).write.mode("append").option("mergeSchema", "true").saveAsTable('logs')
except Exception as e:
    print(f"An error occurred: {e}")
1- Using glob() to collect file names means you don’t open any files unnecessarily , a small but nice performance win.
2- DuckDB expand the struct using this expression data.*
3- union_by_name = 1 in case the json has different schemas
4- option(“mergeSchema”, “true”) for schema evolution in Delta table
Exploring the Data
Once the logs are in a Delta table, you can query them like any denormalize table.
For example, here’s a simple query showing API calls per engine:
Note : using AI to get working regex is maybe the best thing ever
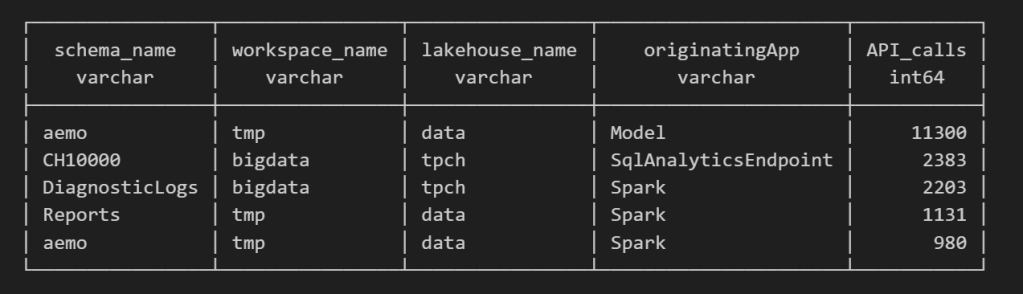
SELECT
    regexp_extract(resource, '([^&/]+)/([^&/]+)/(Tables|Files)(?:/([^&/]+))?(?:/([^&/]+))?', 4) AS schema_name,
    get_workspace_name(workspaceid) AS workspace_name,
    get_lakehouse_name(workspaceid, itemId) AS lakehouse_name,
    originatingApp,
    COUNT(*) AS API_calls
FROM logs
GROUP BY ALL
ORDER BY API_calls DESC
LIMIT 5;
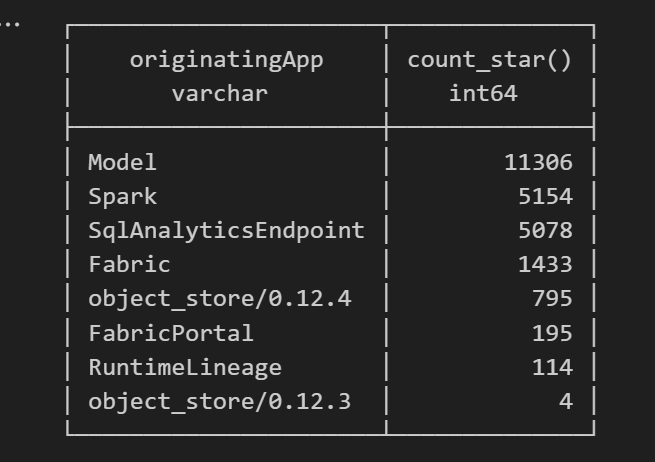
Fun fact: OneLake tags Python notebook as Spark.
Also, I didn’t realize Lineage calls OneLake too!
as I have already register Python functions as UDFs, which is how I pulled in the workspace and lakehouse names in the query above.
Takeaway
This was just a bit of tinkering, but I’m really impressed with how easy OneLake Diagnostics is to set up and use.
I still remember the horrors of trying to connect Dataflow Gen1 to Azure Storage ,that was genuinely painful (and I never even got access from IT anyway).
It’s great to see how Microsoft Fabric is simplifying these scenarios. Not everything can always be easy, but making the first steps easy really gives the feature a very good impression.
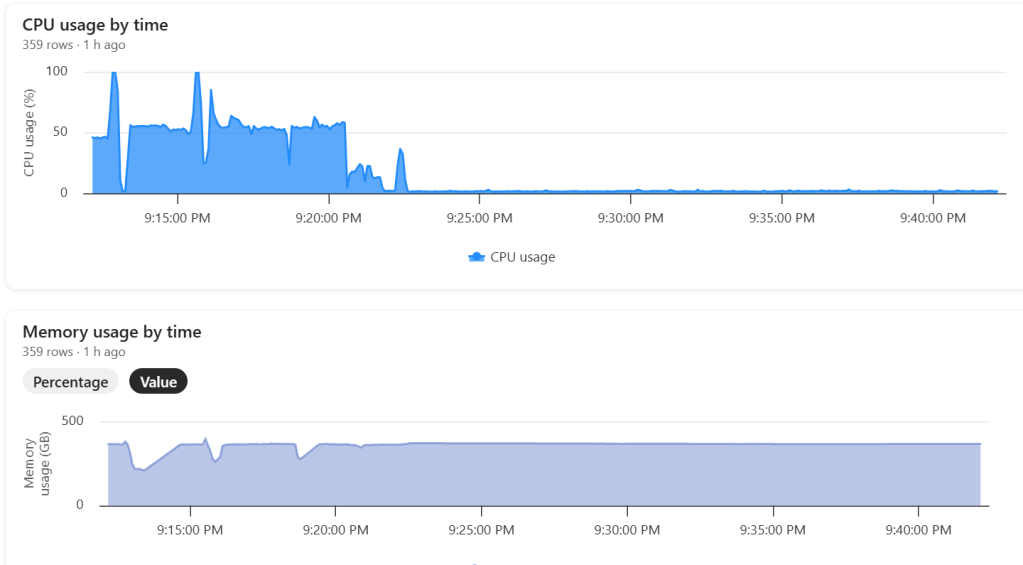
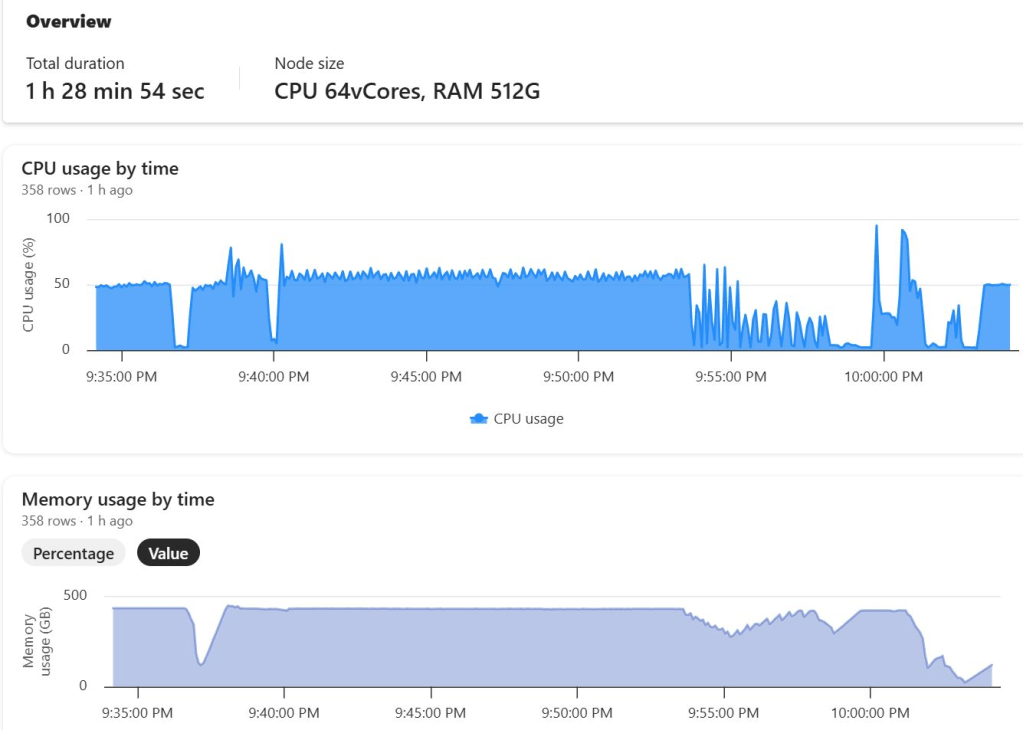
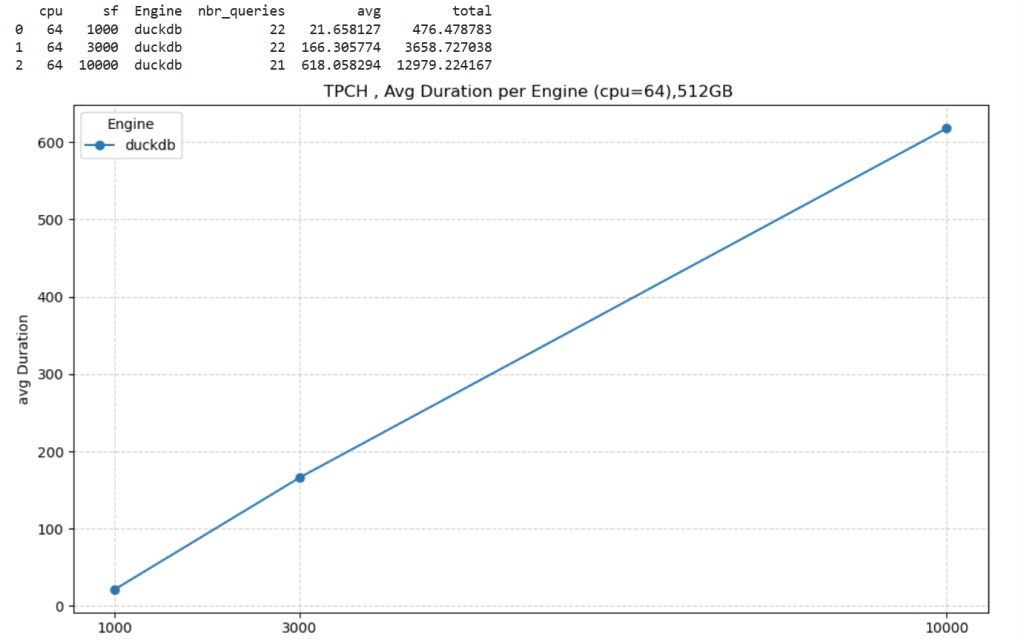
]]>This started as just a fun experiment. I was curious to see what happens when you push DuckDB really hard — like, absurdly hard. So I went straight for the biggest Python single-node compute we have in Microsoft Fabric: 64 cores and 512 GB of RAM. Because why not?
Setting Things Up
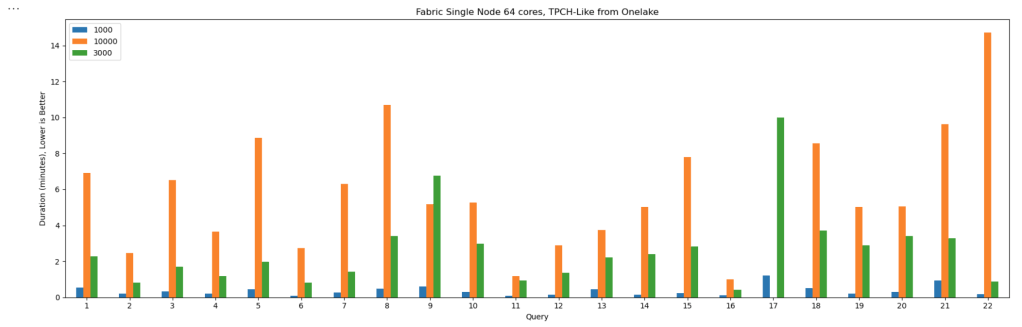
I generated data using tpchgen and registered it with delta_rs. Both are Rust-based tools, but I used their Python APIs (as it should be, of course). I created datasets at three different scales: 1 TB, 3 TB, and 10 TB.
From previous tests, I know that Ducklake works better, but I used Delta so it is readable by other Fabric Engines ( as of this writing , Ducklake does not supporting exporting Iceberg metadata, which is unfortunate)
You can grab the notebook if you want to play with it yourself .
What I Actually Wanted to Know
The goal wasn’t really about performance . I wanted to see if it would work at all. DuckDB has a reputation for being great with smallish data, but wanted to see when the data is substantially bigger than the available Memory.
And yes, it turns out DuckDB can handle quite a bit more than most people assume.
The Big Lesson: Local Disk Matters
Here’s where things got interesting.
If you ever try this yourself, don’t use a Lakehouse folder for data spilling. It’s painfully slow(as the data is first written to disk then uploaded to remote storage)
Instead, point DuckDB to the local disk that Fabric uses for AzureFuse caching. That disk is about 2 TB. or any writable folder
You can tell DuckDB to use it like this:
SET temp_directory = '/mnt/notebookfusetmp';
Once I did that, I could actually see the data spilling happening in real time which felt oddly satisfying, it works but slow , it is better to just have more RAM
Python notebook is fundamentally just a Linux VM, and you can see the storage layout using this command
!df -hTHere is the layout for 2 cores

Which is different when running it for 64 cores ( container vs VM, something like that), I notice the local disk increased with more cores, which make sense

The Results
Most queries went through without too much trouble. except Query 17 at 10 TB scale? That one It ran for more than an hour before my authentication token expired. So technically, it didn’t fail
DuckDB does not have a way to refresh Azure token mid query. as far as I know
Edit : according to Claude, I need at least 1-2 TB of RAM (10-20% of database size) to avoid disk thrashing
Observations: DuckDB’s Buffer Pool
Something I hadn’t noticed before is how the buffer pool behaves when you work with data way bigger than your RAM. It tends to evict data that was just read from remote storage — which feels wasteful. I can’t help but think it might be better to spill that to disk instead.
I’m now testing an alternative cache manager called duck-read-cache-fs to see if it handles that better. We’ll see, i still think it is too low level to be handled by an extension, I know MotherDuck rewrote their own buffer manager, but not sure if it is for the same reason.
Why not test other Engines
I did, actually , and the best result I got was with Lakesail at around 100 GB. Beyond that, no single-node open-source engine can really handle this scale. Polars, for instance, doesn’t support spilling to disk at all and implements fewer than 10 of the 22 standard SQL queries.
Wrapping Up
So, what did I learn? DuckDB is tougher than it looks. With proper disk spilling and some patience, it can handle multi-terabyte datasets just fine, and sometimes the right solution is just to add more RAM
personally , I never had a need for TB of data ( my sweet spot is 100 GB) and distributed system (Like Fabric DWH, Spark etc) will handle this use case way better, after all they were designed for this scale.
But it’s amazing to see how far an in-process database has come just a couple of years ago, I was thrilled when DcukDB could handle 10 GB!
It significantly improves cold-run performance of Direct Lake mode in some scenarios, there is an excellent documentation that explain everything in details
What Is Incremental Framing?
One of the most important improvements to Direct Lake mode in Power BI is incremental framing.
Power BI’s OLAP engine, VertiPaq (probably the most widely deployed OLAP engine, though many outside the Power BI world may not know it) relies heavily on dictionaries. This works well because it is a read-only database. another core trick is its ability to do calculation directly on encoded data. This makes it extremely efficient and embarrassingly fast ( I just like this expression for some reason ).
Direct Lake Breakthrough
Direct Lake’s breakthrough is that dictionary building is fast enough to be done at runtime.
Typical workflow:
- A user opens a report.
- The report generates DAX queries.
- These queries trigger scans against the Delta table.
- VertiPaq scans only the required columns.
- It builds a global dictionary per column, loads the data from Parquet into memory, and executes queries.
The encoding step happens once at the start, and since BI data doesn’t usually change more that much, this model works well.
The Problem with Continuous Appends
In scenarios where data is appended frequently (e.g., every few minutes), the initial approach does not works very well. Each update requires rebuilding dictionaries and reloading all the data into RAM, effectively paying the cost of a cold run every time ( reading from remote storage will be always slower).
How Incremental Framing Fixes This
Incremental framing solves the problem by:
- Incrementally loading new data into RAM.
- Encoding only what’s necessary.
- Removing obsolete Parquet data when not needed.
This substantially improves cold-run performance. Hot-run performance remains largely unchanged.
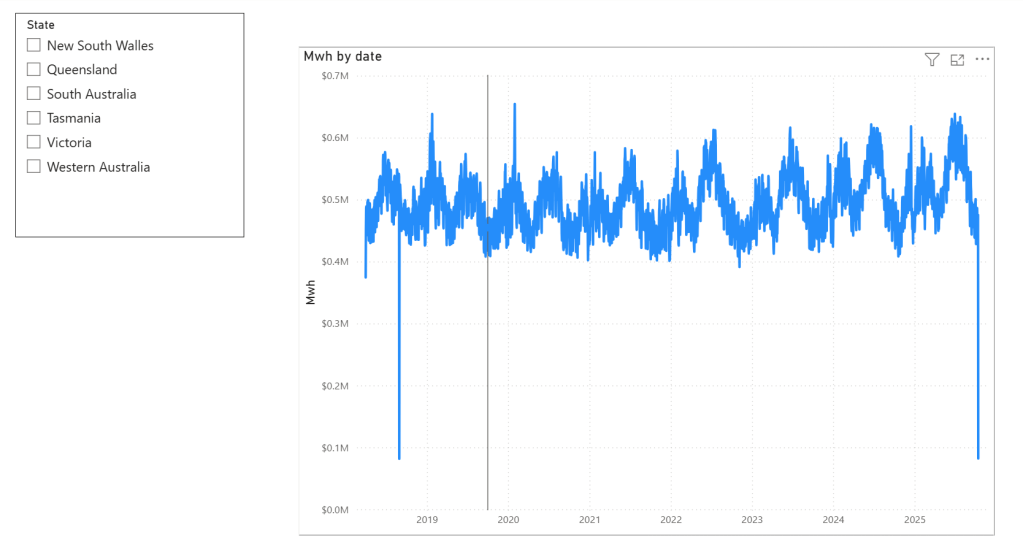
Benchmark: Australian Electricity Market
To test this feature, I used my go-to workload: the Australian electricity market, where data is appended every 5 minutes—an ideal test case.
- Incremental framing is on by default, I turn it off using this bog
- For benchmarking, I adapted an existing tool , Direct Lake load testing( I just changed writing the results to Delta instead of CSV), I used 8 concurrent users, the main fact Table is around 120 M records, the queries reflect a typical user session , this is a real life use case, not some theoretical benchmark.
Results
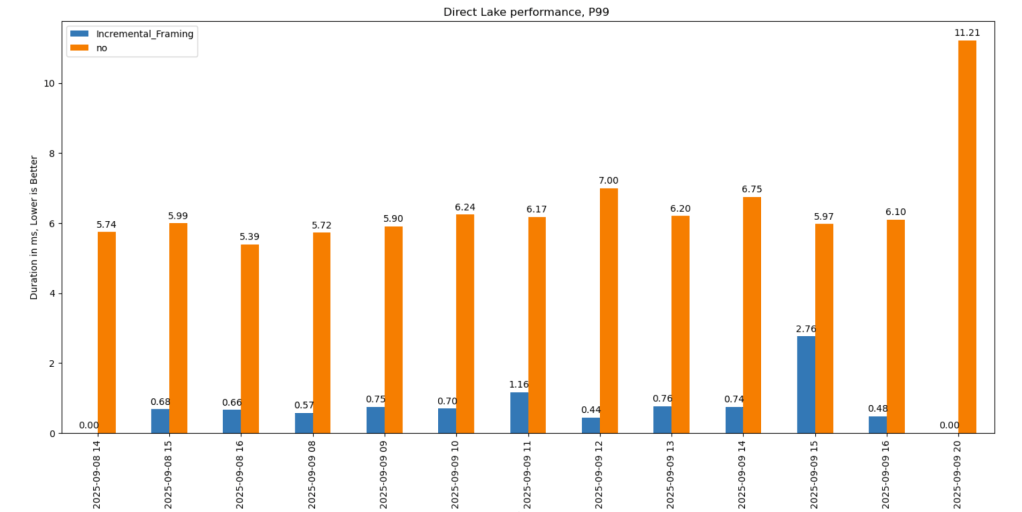
P99
P99 (the 99th percentile latency, often used to show worst-case performance):
- Improvement of 9x–10x, again, your results may varied depending on workload, Parquet layout, and data distribution.
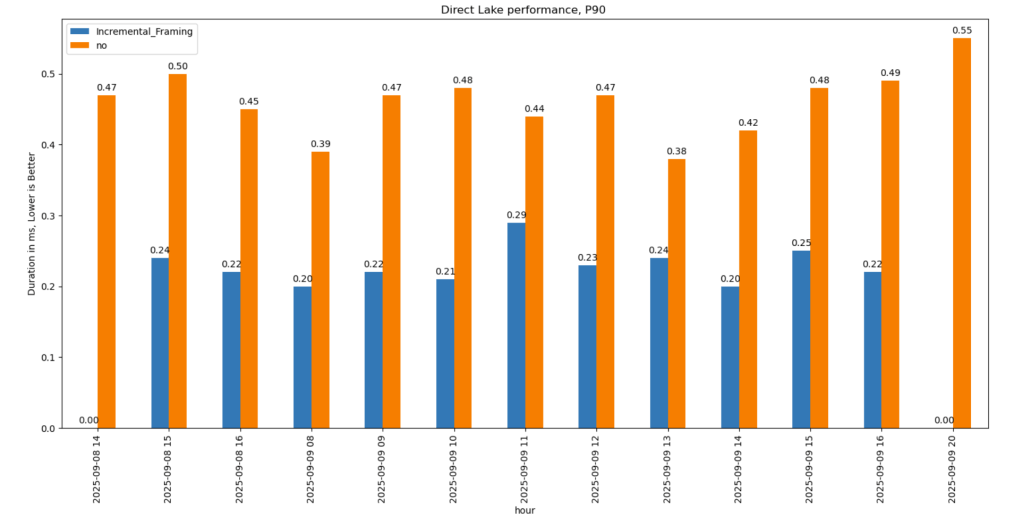
P90
P90 (90th percentile latency):
- Less dramatic but still strong.
- Improved from 500 ms → 200 ms.
- Faster queries also reduce capacity unit usage.
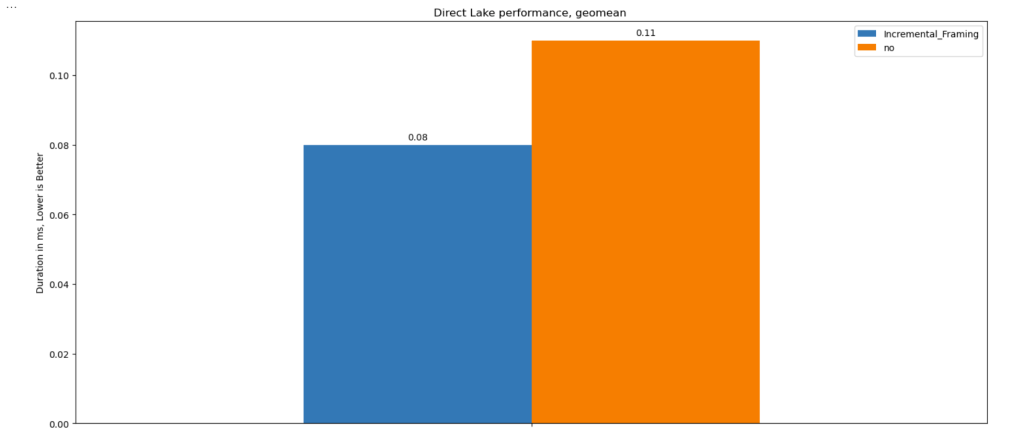
Geomean
just for fun and to show how fast Vertipaq is, let’s see the geomean, alright went from 11 ms to 8 ms, general purpose OLAP engines are cool, but specialized Engines are just at another level !!!
This does not solve Bad Table layout problem
This feature improves support for Delta tables with frequent appends and deletes. However, performance still degrades if you have too many small Parquet row groups.
VertiPaq does not rewrite data layouts—it reads data as-is. To maintain good performance:
- Compact your tables regularly.
- In my case, I backfill data nightly. The small Parquets added during the day don’t cause major issues, but I still compact every 100 files as a precaution.
If your data is produced inside Fabric, VOrder helps manage this. For external engines (Snowflake, Databricks, Delta Lake with Python), you’ll need to actively manage table layout yourself.
]]>In short: there is now a defined way to store GIS data in Parquet. Both Delta Lake and Apache Iceberg have adopted the standard ( at least the spec). The challenge is that actual implementation across engines and libraries is uneven.
- Iceberg: no geometry support yet in Java nor Python, see spec
- Delta: it’s unclear if it’s supported in the open source implementation (I need to try sedona and report back), nothing in the spec though ?
- DuckDB: recently added support ( you need nightly build or wait for 1.4)
- PyArrow: has included support for a few months, just use the latest release
- Arrow rust : no support, it means, no delta python support

The important point is that agreeing on a specification does not guarantee broad implementation. and even if there is a standard spec, that does not means the initial implementation will be open source, it is hard to believe we still have this situation in 2025 !!!
Let’s run it in Python Notebook
To test things out, I built a Python notebook that downloads public geospatial data, merges it with population data, writes it to Parquet, and renders a map using GeoPandas, male sure to install the latest version of duckdb, pyarrow and geopandas
!pip install -q duckdb  --pre --upgrade
!pip install -q pyarrow --upgrade
!pip install geopandas  --upgrade
import sys
sys.exit(0)
At first glance, that may not seem groundbreaking. After all, the same visualization could be done with GeoJSON. The real advantage comes from how geometry types in Parquet store bounding box coordinates. With this metadata, spatial filters can be applied directly during reads, avoiding the need to scan entire datasets.
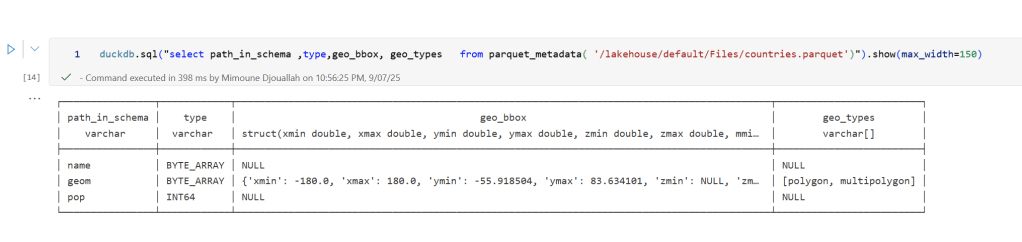
That capability is what makes the feature truly valuable: efficient filtering and querying at scale, note that currently duckdb does not support pushing those filters, probably you need to wait to early 2026 ( it is hard to believe 2025 is nearly gone)
 Workaround if your favorite Engine don’t support it .
A practical workaround is to read the Parquet file with DuckDB (or any library that supports geometry types) and export the geometry column back as WKT text. This allows Fabric to handle the data, albeit without the benefits of native geometry support, For example PowerBI can read WKT just fine
duckdb.sql("select geom, ST_AsText(geom) as wkt from '/lakehouse/default/Files/countries.parquet' ")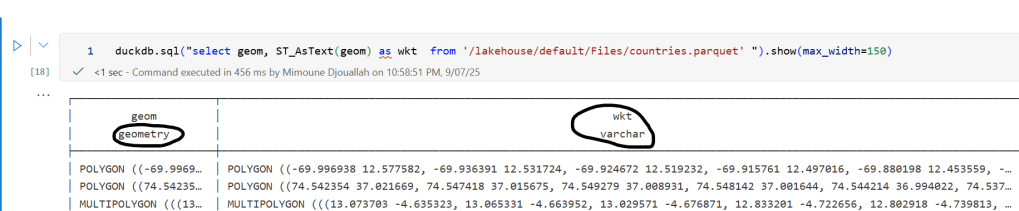
For PowerBI support to wkt, I have written some blogs before, some people may argue that you need a specialized tool for Spatial, Personally I think BI tools are the natural place to display maps data