Overview of the Flow

The flow is designed to:
- Expose an HTTP endpoint for API calls.
- Dynamically retrieve metadata about the
Contactobject in Salesforce. - Use this metadata to build a SOQL query that fetches all contact records fields.
- Return the data in JSON format via the HTTP response.
Step-by-Step Breakdown
1. HTTP Listener
The flow starts with an HTTP listener configured at the path /contacts. This serves as the entry point for API calls, enabling external systems to trigger the flow.
<http:listener config-ref="HTTP_Listener_config" path="/contacts" doc:name="HTTP"/>
2. Salesforce Describe-SObject Connector
This step retrieves metadata about the Contact object using Salesforce’s Describe-SObject API. This includes details about the fields available in the Contact object.
<salesforce:describe-sobject type="Contact" doc:name="Contact" config-ref="Salesforce_Config"/>
3. Transform Message – Extract Field Names
The metadata retrieved in the previous step is processed to extract the names of all fields in the Contact object. These field names are then joined into a comma-separated string, forming the basis of a SOQL query.
<ee:transform doc:name="Transform Message">
    <ee:set-payload><![CDATA[%dw 2.0
output text/plain
---
payload.fields map ($.name) joinBy ","]]></ee:set-payload>
</ee:transform>
4. Salesforce Query
Using the dynamically constructed field list, the flow executes a SOQL query to retrieve all contact records and their fields in Salesforce. The query is parameterized, ensuring scalability and reusability.
<salesforce:query doc:name="Get All Contacts" config-ref="Salesforce_Config">
    <salesforce:salesforce-query><![CDATA[SELECT :fields FROM Contact]]></salesforce:salesforce-query>
    <salesforce:parameters><![CDATA[#[output application/java
---
{
    "fields" : payload
}]]]></salesforce:parameters>
</salesforce:query>
5. Transform Message – Format Response
The retrieved contact data is transformed into JSON format to ensure a clean, structured response for API consumers.
<ee:transform doc:name="Transform Message">
    <ee:set-payload><![CDATA[%dw 2.0
output application/json
---
payload]]></ee:set-payload>
</ee:transform>
Benefits of the Flow
- Dynamic Metadata Handling
By leveraging theDescribe-SObjectoperation, this flow dynamically adapts to changes in the SalesforceContactobject, reducing maintenance efforts and improving scalability. - Simplified API Integration
The flow abstracts the complexity of Salesforce SOQL queries, providing a simple HTTP endpoint for retrieving contact data. - Enhanced Data Accessibility
The JSON response format ensures that the data is easily consumable by downstream systems or applications, such as reporting tools or third-party integrations. - Scalable Design
Parameterized queries and reusable components make the flow adaptable to other Salesforce objects with minimal changes.
Conclusion
This MuleSoft flow is a great example of how integration platforms can streamline data retrieval from systems like Salesforce. By dynamically building queries and exposing the data via a flexible API, it reduces both the development effort and operational complexity, empowering organizations to focus on driving value from their data.
Whether you’re building a real-time dashboard, automating workflows, or integrating with a third-party application, MuleSoft provides the tools you need to connect to your data seamlessly.
]]>The Tableau Hyper API is a game-changer for real-time analytics, ETL transformations, and interactive exploration. MuleSoft, with its versatile integration capabilities, can seamlessly connect disparate systems and facilitate advanced data workflows with Tableau Hyper. In this blog post, we’ll explore how MuleSoft can be used to write and read from Hyper files, unlocking new possibilities for automating data processes and enabling actionable insights.
Steps
To get started, you can download the Mule project from Github using this link.

Once you download the project and unzip the file, import the project into Anypoint Studio.

Next, you need to download the Hyper API libraries before you can run this project. Here’s the link to get those files.
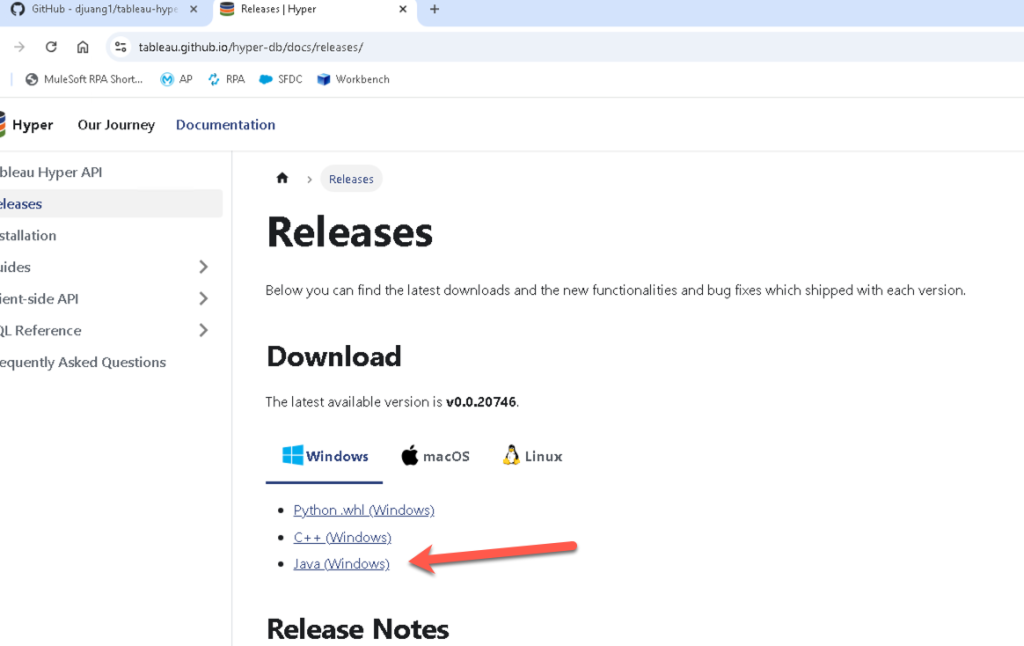
Once you unzip those files, copy the lib folder to the src/main/resources folder in the Mule project in Anypoint Studio.

In order for the project to know where the Tableau Hyper API files are, we need to change the properties file. Navigate to the src/main/resources folder again and open the mule-properties.yaml file. Modify line 2 to point to the directory where the project is located.

Once that is configured, we need to modify the configuration elements to point to the right files. Open (1) the tableau-example-mule4.xml file if it isn’t open yet. Click on (2) the Global Elements tab at the bottom and then double click on (3) the Tableau Specialist Hyper configuration to open the properties window.

Let’s setup the required libraries now, click on the first Configure and select Use local file

Navigate to the lib folder that you dropped into the project earlier and select the tableauhyperapi.jar file.

If configured correctly, the line will have a green checkmark.

Repeat the same process for the Java Native Access library. For that library, select the jna-5.14.0.jar file.

Once configured, click on Test Connection. If the Test connection successful message pops up, you’re good to continue on.

Switch back to the Message Flow view, right click on the canvas, and select Run project tableau-example-mule4

When the Console tab shows Deployed, switch over to a browser window

Goto the following URL – http://localhost:8081/loaddata

This will load the data into a Hyper file located in the src/main/resources folder. Switch to Anypoint Studio and check out the flow:

You can see the Create hyper file is where you define the schema, table name, and the columns you want the Hyper file to contain. In the next Tableau component in the flow, this is where you insert the data using the Insert data to hyper file component. It’s a simple SQL query to insert the data into the schema and table.

If you have Tableau Desktop installed, you can open the Hyper file and see the data in there as well.

Next, let’s look at the other flow in the project and see how we can extract data from the Hyper file using Mule. Switch back to your browser and navigate to http://localhost:8081/query to see the data extracted from the Hyper file we just created.

Switch back to Anypoint Studio and check out the flow that you called. You can see the Query data from hyper file component and see how it uses a simple SQL query to extract the data from the table that we created and inserted data into.

Conclusion
By integrating MuleSoft with Tableau Hyper API, organizations can harness the power of real-time analytics, automate data operations, and bridge the gap between siloed systems. This synergy enables businesses to make data-driven decisions faster and more efficiently, ensuring Tableau dashboards reflect the freshest insights.
]]>- Create a connection with a third-party app to authorize Anypoint Platform to share data.
- Create a configuration to specify the types of data Anypoint Platform exports and which business groups and environments allow content to be exported to connections.
Setup Mule Application
Before we jump into setting up the Telemetry Exporter, check to see if your Mule application is configured for Distributed Tracing.
Navigate to the Runtime Manager and open the application that you’d like to see data for in Grafana. In the Settings page of the application, click on Monitoring and scroll down. Distributed Tracing should have Enable tracing checked.

Grafana – Configure Open Telemetry
Open a new tab in your browser and navigate to the following URL:
| https://grafana.com/ |
Create a Grafana Cloud Free Tier account

Or click on Sign In

Once you’re logged in, on the Home page, click on Manage subscription.

In the Manage plan screen, click on the name of your Grafana Cloud instance name.

Click on Configure under OpenTelemetry

In the Password / API Token section, click on Generate now

Click on Create Token

Copy the token and save it somewhere if you’d like. Click on Close

In the Environment Variables section, copy them down. What we’ll need in Anypoint Platform though is the value for the Authorization header. Keep this window open and move to the next section.

Telemetry Exporter – New Connection
Switch back to Anypoint Platform and navigate to Monitoring. Click on Telemetry Exporter and then click on New Connection

Switch back to Grafana and copy the OLTP Endpoint to your clipboard.

Jump back to Anypoint Monitoring and set the following fields.
- Connection Name – Grafana
- Destination Type – OpenTelemetry
- Endpoint URL – value you copied from Grafana (e.g. https://otlp-gateway-prod-us-central-0.grafana.net/otlp)
Click on Next.

Switch back to Grafana and copy the string in the Environment Variables section after the equals sign starting from “Basic”. Be sure to exclude the double quote symbol at the end.
Switching back to Anypoint Monitoring, in the Authentication window, fill in the following fields:
- Header Key – Authorization
- Header Value – Paste in the value that we just copied from Grafana

Click on Test Connection.

If you get a Test Connection successful. message, click on Save Connection

Telemetry Exporter – New Configuration – Traces
Now that we’ve configured a connection, let’s go and set up the configuration to send the traces. Click on New Configuration

Jump back to Anypoint Monitoring and set the following fields.
- Configuration Name – Grafana Traces
- Connection – Select the connection name that we just configured e.g. Grafana
- Data Type – Traces
Click on Next.

In the Business Group & Environment Type window, keep All business groups selected, and select the environment where your Mule application is deployed that is configured for distributed tracing.
Click on Next

Review the settings and click on Save Configuration and move on to the next step.

Telemetry Exporter – New Configuration – Audit Logs
We can also send Audit Logs from Anypoint Platform to Grafana. Click on New Configuration

In the Configuration Details window, set the following fields.
- Configuration Name – Grafana Logs
- Connection – Select the connection name that we just configured e.g. Grafana
- Data Type – Audit Logs
Click on Next.

In the Business Group & Environment Type window, keep All business groups selected. Audit types are not tied to environments so go ahead and click on Next

Review the settings and click on Save Configuration and move on to the next step.

Congrats, Telemetry Exporter is set up now and will start exporting telemetry data to Grafana. Be sure to run requests against your Mule applications to generate data that will be exported to Grafana before moving to the next step.
Grafana – View Traces and Logs
Assuming you’ve generated some telemetry data with your Mule applications, switch to Grafana and navigate to Explore

In the drop-down menu, select Tempo. Grafana Tempo lets you search for traces, generate metrics from spans, and link your tracing data with logs and metrics.

Click on Service Graph and change the time filter to Last 1 hour. Click on Run query if it doesn’t refresh the view. If configured correctly, you should see the name of your Mule application in the Node graph like the screenshot below. Feel free to click on the node and view the trace data.

Next, let’s check out the audit log data. In the drop-down menu, select Loki. Grafana Loki is a log aggregation system designed to store and query logs from all your applications and infrastructure.

You’ll need to create a filter to see the data. Click on Select label and select exporter.

Click on Select value and click on OLTP

Change the time filter to Last 12 hours and click on Run query. You should see log data from your Anypoint Platform. If you don’t see any data, go back to the Runtime Manager and stop and start one of your applications. Give the exporter some time to send data over before click on Run query again.

In one of the lines, click on Inspect value on the far right.

You’ll see all the data that Telemetry Exporter sends over for each event.

Congratulations
Congratulations, you’ve successfully configured MuleSoft Telemetry Exporter to send data over to Grafana.
]]>Setup Azure Active Directory App
Before we create the MuleSoft app, we need to set up an Application in Azure Active Directory (a.k.a as Entra ID) to allow the connector to communicate with Business Central.
Switch to your browser and login to Business Central. Click on the App Launcher in the top left and click on Admin

On the left-hand navigation, click on Show all and click on Identity


Click on Add and click on App registration

Give the application a name (e.g. Mule 365 BC). For the Supported account types section, check the Accounts in any organizational directory (Any Microsoft Entra ID tenant – Multitenant) check box. In the Redirect URI section, select Web from the drop-down and fill in the field with http://localhost:8081/callback. Lastly click on Register

In the next screen, copy down the Application (client) ID (e.g. 662e3c92-7816-42f1-a5e9-119d8bdb9439). We’ll need this when we configure the MuleSoft connector later.
Under the Manage section, click on API permissions. Click on Add a permission

In the Request API permissions window, click on Dynamics 365 Business Central

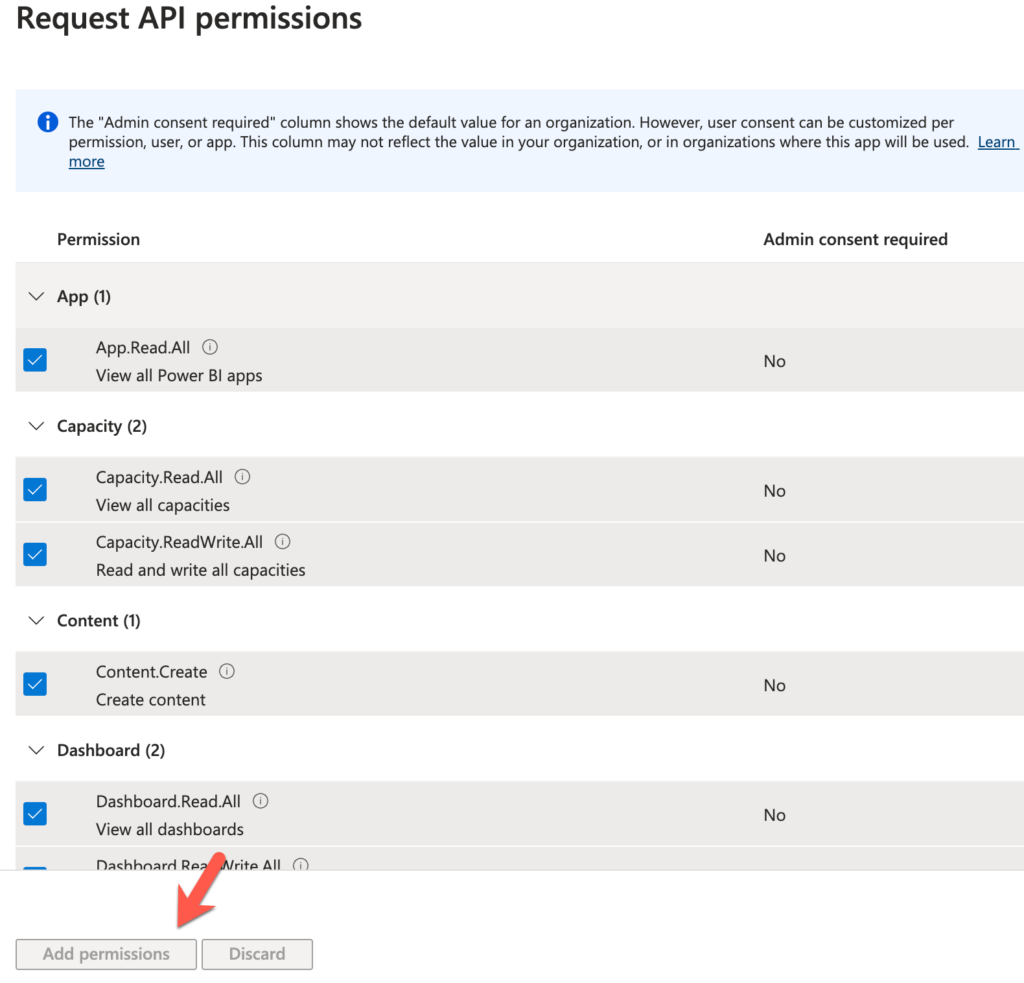
Click on Application permissions and check all the checkboxes before clicking on Add permissions.

Repeat the process but select Delegated permissions, select all the checkboxes, and then click on Add permissions.

Now that we’ve add all the APIs that the API can call, click on Grant admin consent for <Parent Tenant>

Click on Overview and then click on Endpoints. You’ll need to copy down the OAuth 2.0 token endpoint (v2) and OAuth 2.0 authorization endpoint (v2) URL which we’ll need when we configure the MuleSoft connector.

In the left-hand navigation, under the Manage section, click on Certificates & secrets. Click on Client Secrets and then click on New client secret

Give the client secret a Description, leave the Expires field with the default value, and click on Add

Copy down the Value and Secret ID. You won’t be able to see the value again once you leave the screen. The value is the client secret that you’ll need to configure the connector in MuleSoft.

Create Mule Application
For the purpose of the codelab, we’re going to create a very simple flow that gets the list of entities for a company and outputs that to the browser in JSON format.
Open Anypoint Studio and create a new Mule Project

In the New Mule Project window, give the project a name (e.g. business-central-example), select a Runtime, and then click on Finish
Next we want to add the Business Central connector to the project. In the Mule Palette, click on Search in Exchange. In the window that pops up, search for dynamics and select the Business Central or Finance and Operations connector. Click on Add and then click on Finish.

With the project created and the connector added to the project, let’s create the flow. Drag and drop the following components into a new Mule project so it looks like the following screenshot:
- HTTP > HTTP Listener
- Microsoft Dynamics 365 Business Central > List Entities
- Transform Message

HTTP Listener
The configuration for the HTTP Listener operation will be pretty standard. For the config, leave the default protocol and port (e.g. http://localhost:8081)
For the path, set it to /list

Microsoft Dynamics 365 Business Central > List Entities
For the Microsoft Dynamics 365 Business Central Connector configuration, click on the green plus sign.
In the Global Element Properties window, change the dropdown for the Connection field to OAuth2 Connection Provider.

Configure the General tab according to the table below. Once configured, click on Test Connection… If configured correctly and the test is successful, click on OK

| Base Uri | https://api.businesscentral.dynamics.com/v2.0/<Tenant ID>/<Environment Name>/api/v2.0 To get the Tenant ID and Environment, switch back to Business Central and click on the ? icon and click on Help & Support. Scroll to the bottom and you’ll see the values:  |
| Client ID | The Application (client) ID from the Setup Azure Active Directory App step (e.g. 662e3c92-7816-42f1-a5e9-119d8bdb9439) |
| Client Secret | This is the value from the Credentials & secrets section  |
| Authorization url | https://login.microsoftonline.com/<Tenant Id>/oauth2/v2.0/authorize |
| Access token url | https://login.microsoftonline.com/<Tenant Id>/oauth2/v2.0/token |
| Scopes | https://api.businesscentral.dynamics.com/.default |
| Listener config | This should be the same listener as the one setup for the HTTP Listener |
| Callback path | /callback |
| Authorize path | /authorize |
| External callback url | http://localhost:8081/callback |
Back in the Mule properties tab, we need to get the Company ID. Switch back to Business Central and click on the ? icon in the top right.
Click on Help & Support and click on Inspect pages and data.

Go back to the home window and click on All Reports
Click on All > System Administration > Data > Reference Data > Companies

Select a company from the list and look at the ID in the Page Inspection section.

Switch back to Anypoint Studio and fill in the Company ID and fill in the Entity field with the value customers.

Now the Business Central connector is configured, let’s set up how we want the content to be displayed.
Transform Message
For the Transform Message, we’re just going to output the data in plain text format. The script should look like the following.
| %dw 2.0output application/json—payload |

Test Application
Let’s test the application and see it in action. Right-click on the canvas and select Run project <app name>

Because Microsoft requires OAuth as the only connection method, you may see an error when deploying the application. Just click on Proceed

Once the app is successfully deployed, switch to a browser.

Navigate to the following URL
| http://localhost:8081/authorize |
You’ll be redirected to login.

Login with your username, password, and one-time password code. If successful, you’ll be redirected back to the callback address. The OAuth token will be stored in to the Object Store.

Navigate to the following URL
| http://localhost:8081/list |

Summary
Congrats! You successfully set up the Dynamics 365 Business Central connector with the OAuth2 Connection Provider. Understanding how to set up the connector configuration is often the biggest hurdle.
Additional Resources
]]>In this post, I’ll walk you through the following steps:
- Configure an Azure app with the correct Outlook 365 API permissions
- Create a Mule flow to send an email through Outlook 365
- List all the messages in a folder from an Outlook 365 user Inbox
I’ll assume you have access to Outlook 365, Azure, and Anypoint Studio 7.x. You can find a complete project here in my Github – https://github.com/djuang1/outlook365-example-mule4.
Configure Azure

Give the application a name (e.g. Outlook Mule App), check Accounts in any organizational directory for Supported account types. Under Redirect URI, select Web from the dropdown and type in https://127.0.0.1:8082/callback. Click on Register

In the newly created app, click on Certificates & secrets and click on New client secret

Give the secret a name and set the expiration date.

Copy down the Value and Secret ID, you’ll need these when you configure the Mule application. Be sure to write down the Value because you won’t be able to see it after you leave the screen.

Next click on API permissions and click on Add a permission

Click on Microsoft Graph

We’re going to configure the app for OAuth Client Credentials so click on Application permissions

In the search box, type in ‘mail‘ to filter the available API permissions. Under the Mail section, check all the boxes you’d like to grant the app and then click on Add permissions

Clear the search filter and type in user.Read and then select User.Read.All and User.ReadBasic.All

Click on Grant admin consent for MSFT

Click on Yes

Not that the permissions have been set, we need to copy down two more properties in order to configure the Outlook Connector configuration. Click on Overview and copy down the Application (client) ID and the Directory (tenant) ID

You should have the following values before continuing on to the next section:
- Application ID
- Directory ID
- Client Secret
Create Mule Application
This post assumes you have experience building a Mule application in Anypoint Studio. Using the screenshots below, create a new Mule project, add the Outlook 365 Connector from Exchange, and build the following flows.

Additionally, add a configuration properties file into the src/main/resources folder

Add the following properties and fill them in from the first section.
azure:
  client: "<Application (client) ID>"
  secret: "<Secret>"
  scopes: "https://graph.microsoft.com/.default"
  tenant: "<Directory (tenant) ID>"
Be sure to add the Configuration properties global type to the project and point it to the file as well.

Send Mail
HTTP LISTENER
Let’s start with the HTTP Listener. I used the path /send and I changed the port to 8082 and set the protocol to HTTPS for the HTTP Listener configuration.
Transform Message
The format for the payload to be sent be the Outlook365 needs to follow a specific format. Here’s the DataWeave for that payload below. Be sure to change the address to an email address that will receive the message.
%dw 2.0
output application/json
---
{
	"message": {
    	"subject": "Meet for lunch?",
    	"body": {
			"contentType": "Text",
			"content": "The new cafeteria is open."
	    },
    	"toRecipients": [
    		{
    			"emailAddress": {
          			"address": "[email protected]"
        		}
    		}
    	]
    }
}

Outlook365 – Send mail
Click the green plus sign to create a new Outlook365 configuration.
Change the Connection dropdown to OAuth v2.0 Client Credentials. Under the General tab, fill in the Client ID, Client Secret, Token URL, and Scopes using the properties from the properties file.
Click on Test Connection… to make sure the connection properties are correct and then click on OK.

Back in the Mule Properties tab, click on the refresh icon on the User Id field and select your user ID. Leave all the other fields with their default values.

Transform Message
We’re just going to output a JSON message after the email is sent.

List Messages
HTTP LISTENER
I used the path /list and I used the HTTP configuration that we already setup above.
Outlook365 – List Message
We’ll use the Outlook365 configuration that we setup earlier.
Change the User ID dropdown to your user ID. The Mail folder id will be populated afterwards. Select Inbox

Transform Message
Similar to the flow above, we’re just going to take the response and output it as JSON back to the user.

Run Application
With the application configured, go ahead and run the application now. Once it’s deployed and started, switch to your browser and navigate to the following URL
https://localhost:8082/list
You should see the list of email message returned in JSON like the screenshot below.

Let’s test sending a message now. Change the URL to the following
https://localhost:8082/send

Switching to your email, you should have received a message if everything was configured correctly:

Summary
Overall, the MuleSoft Outlook 365 connector simplifies the process of connecting to Outlook 365 and enables efficient integration with mailboxes for real-time message handling, ensuring smooth communication and collaboration within your MuleSoft-powered ecosystem.
]]>This post assumes you already have experience with the MuleSoft Anypoint Studio 7.x and access to Google Cloud Platform and BigQuery.
Create a Google Service Account
Before we can connect to BigQuery, we need to setup a Service Account. In your Google Cloud account, navigate to Service Accounts under IAM & Admin.

Click on Create Service Account at the top.

Fill in all the fields to describe the service account and click on Create and Continue

In step 2, grant this service account access to BigQuery. Click on Select a role, select BigQuery, and click on BigQuery Admin and then click on Continue.

Step 3 is optional, click on Done to continue.

You’ll be redirected to the list of Service accounts. Find and click on the Email for the service account that was just created.

Click on the Key tab and select Add Key and select Create new key

Keep the recommended selection and click on Create

A JSON file will be created and downloaded. Open that file in your text editor and move onto the next step. We’ll need the properties from that file to configure the MuleSoft BigQuery Connector.
Setup Mule Application
You can download a complete version of the project we’re going to configure today here from Github.

I’m going to assume you’re familiar with building flows in Anypoint Studio. Once you add the Google BigQuery connector to your palette, go ahead and use the Query and Insert Job operations and build the flows above.

I used the path /read for the Query operation and /insert for the Insert Job operation and I left the default port (8081) and protocol (HTTP) for the HTTP Listener operation.
BigQuery Configuration
With the JSON file that we downloaded when we setup the Service Account, we can setup the BigQuery Configuration.

After changing the Connection type to JWT Connection, fill in the following fields with the values from the JSON file.
Private key id: = private_key_id
Private key: = private_key
Issuer: = client_email
Project Id: = project_id
You can also use the Configuration properties file mule-properties.yaml under src/main/resources and populate the values there.

Query – Transform Message
In order to run a query against BigQuery, you need to setup the payload to follow the Google REST API Request format.

%dw 2.0
output application/json
---
{
	query: "SELECT Top_Term FROM ehc-djuang-434900.mule_demo_dataset.top_terms LIMIT 10",
	useLegacySql: false
}
Insert Job – Transform Message
Inserting data into BigQuery using the Insert Job operation requires some additional steps on the Google Cloud Platform side. Instead of running a SQL INSERT script, you’re creating a job on the BigQuery side to load data from a CSV file in a Google Cloud Storage Bucket.
As you’re aware, MuleSoft gives you the flexibility to set this up in multiple ways. You can use Mule to generate a *.csv file and upload that into the Bucket first but for the purpose of this post, I’ve create a table in BigQuery called customer_data and I’m uploading a pre-populated *.csv into a Bucket.

You can use the script here:
CREATE TABLE IF NOT EXISTS `ehc-djuang-434900.mule_demo_dataset.customer_data` (
  customer_id INT64,
  first_name STRING,
  last_name STRING,
  email STRING,
  phone_number STRING
);
For the *.csv file, I’m using the following set of data:
1,John,Doe,[email protected],123-456-7890
2,Jane,Smith,[email protected],456-789-0123
3,Alice,Johnson,[email protected],789-012-3456
4,Bob,Brown,[email protected],012-345-6789
5,Eve,Williams,[email protected],345-678-9012
For the Request message that you pass to the Insert Job operation, it needs to follow the following format:

%dw 2.0
output application/json
---
{
	configuration: {
		load: {
			schema: {
				fields: [{
					name: "customer_id",
					"type": "INTEGER"
				},{
					name: "first_name",
					"type": "STRING"
				},{
					name: "last_name",
					"type": "STRING"
				},{
					name: "email",
					"type": "STRING"
				},{
					name: "phone_number",
					"type": "STRING"
				}]
			},
			sourceUris: "gs://mule-bucket/customer.csv",
			writeDisposition: "WRITE_APPEND",
			destinationTable: {
				datasetId: "mule_demo_dataset",
				tableId: "customer_data",
				projectId: "ehc-djuang-434900"
			}
		},
		jobType: "LOAD"
	}
}
Let’s breakdown the different parts of this request:
- The schema needs to contain the column names and type of data that will be loaded into the table.
- The sourceUris needs to point to the Bucket where the *.csv file is located.
- And the destinationTable needs to contain the Dataset ID, the name of the table, and the Project Id.
- Lastly the jobType needs to be LOAD.
Output – Transform Message
For the output on both flows, I just set the response to be formatted in JSON.

Run Mule Application
After running the project, switch to your browser and open up the following URL: http://localhost:8081/read
You should see the following output from BigQuery

Change the URL now and go to the following: http://localhost:8081/insert
You should see the following output. Scroll down and make sure the state is RUNNING and code is REQUESTED

Switching over to BigQuery, you should see the data loaded into the table:

Summary
As you can see, leveraging MuleSoft and the Google BigQuery connector makes your developer’s job easier by reducing the amount of code needed to integrate. This approach allows you to quickly interact and expose or push data into BigQuery from various data sources. Using MuleSoft’s other connectors for various systems such as Salesforce, SAP, ServiceNow, etc… can help you collect and analyze data from these systems in BigQuery to find meaningful insights.
]]>In this article, we’ll walk-through the process of configuring the MuleSoft Kafka connector to connect to Apache Kafka on Heroku through SSL. Using the MuleSoft Kafka Connector, developers can streamline business processes and move data between Kafka and enterprise applications and services. A complete project for this walk-through can be found on Github here.
This article assumes you have a Heroku account with the Apache Kafka on Heroku add-on already added and configured. This article also assumes that you have Anypoint Studio 7.x installed on your local machine and have some experience creating flows.
To start, we’ll need to set up Apache Kafka on Heroku so we have a topic we can publish and consume from within our Mule flow. We also need to generate the keystore files to connect to Kafka over SSL.
Setting up Apache Kafka on Heroku
Assuming you’ve already added the add-on to your app in Heroku, you should have Apache Kafka on Heroku under your list of add-ons under the Resources section.

If not, follow this link and click on the install button on the top right in order to provision an instance to your Heroku app.

Once Kafka is provisioned, click on the add-on name to open the console in a new browser tab. If you already have a topic, you can skip this section and jump to section 2. Otherwise, scroll down and click on Add Topic.

Give your topic a name (e.g. “mule-app”) and set the Partitions field. I just set it to 1 for my project, but you can set this however you need. I left all the other fields with their default values and clicked on Create Topic.

With the topic created, we need to setup a consumer group in Kafka. Unfortunately, I haven’t found a way to set that up from the web console interface. You’ll need to install the Heroku CLI and run the Kafka add-on command to add a consumer group. You can find out how to setup the Heroku CLI here. Once you setup the Heroku CLI, you need to install the plugin for Kafka. You can follow those instructions here on how to setup the plugin.
Because we provisioned Kafka already, you don’t need to provision it from the CLI. But we still need to setup the consumer group for Kafka. Run the following command to set that up with the items highlighted in red with your own names:
| heroku kafka:consumer-groups:create <group name> -a <heroku app name> |

Running the following command will show you the list of groups on your Kafka instance
| heroku kafka:consumer-groups -a <heroku app name> |

Now that is setup, the next section will show you how to gather the SSL URLs and the certificates. It will also show you how to convert the PEM certificates provided in Heroku to JKS which are needed for the MuleSoft Kafka Connector.
Converting PEM certificates and private keys to JKS
Kafka on Heroku supports SSL to encrypt and authenticate connections, and this is the only connection mode supported in the Common Runtime. In Private Spaces, plaintext connections may optionally be used, but this article will only cover SSL connections.
Heroku provides the certificates to connect to Kafka in PEM format. The MuleSoft Kafka Connector requires the certificates to be in JKS format. Therefore, we need to convert the PEM certificates and keys to a PKCS12 file first before we convert them to JKS. We’ll use openssl for that. But first, let’s walk through the process of where to get those certificates and private keys.
Back in the Heroku console for your application, click on the Settings section. Once there, click on the Reveal Config Vars in the Config Vars section.

The Config Vars section will expand and show you various configuration strings for the add-ons of your Heroku app. We need to collect the following configuration variables.
- KAFKA_PREFIX
- Needed for the Group ID.
- KAFKA_URL
- A comma separated list of SSL URLs to the Kafka brokers making up the cluster. You’ll need this string for the Bootstrap Servers field in the Kafka Connector.
The following properties in the table below contain the certificates and keys for authentication. Copy and paste them into files with the names listed next to them. You should save them into the same folder.
- KAFKA_CLIENT_CERT – cert.pem
- KAFKA_CLIENT_CERT_KEY – key.pem
- KAFKA_TRUSTED_CERT – trusted_cert.pem

Next, open up a terminal window and navigate to that folder. Run the following command to generate a pkcs12 file from the cert.pem and key.pem file.
| openssl pkcs12 -export -out cert.pkcs12 -in cert.pem -inkey key.pem |
The command will ask you for an export password. Don’t forget to write that down. You’ll need it for the next step as well as for the configuration of the Kafka Connector.

Once that’s done, you need to convert the pkcs12 file to a JKS. Jetty comes with a utility called PKCS12Import that will do this for you. You can download that jar file (jetty-6.1.7.jar) from here. Copy that file into the same folder where you created the pkcs12 file and run the following command.
| java -cp jetty-6.1.7.jar \ org.mortbay.jetty.security.PKCS12Import \ cert.pkcs12 keystore.jks |

The command will ask for the export password you used previously. Once the command is done, you should have the following files in that folder.

Next, you’ll need to import the certificate into your truststore. We need the trusted_cert.pem file for that. Export the certificate as a DER using the following command:
| openssl x509 -in trusted_cert.pem -out cert.der -outform der |
Then import it into the truststore using the following command. Be sure to keep a note of the password. You’ll need this when you setup the Kafka Connector:
| keytool -importcert -alias mule -file cert.der \ -keystore truststore.jks \ -storepass password |
When the command asks you to trust this certificate, type in ‘yes.’ You should see the following output:
In the folder, you should now have the following files.

The keystore.jks and the truststore.jks files are what we need for the next section.
Create Mule application
I will assume you’re familiar with Anypoint Studio already, so I’ll leave the steps out on how to build the following flow below. There are two flows to this simple application. One flow publishes a message to the topic. The other listens to the topic and writes the message to the console log.

The following subsections provide details on the configurations for the project components.
HTTP listener config element
I kept the HTTP listener configuration with the default values.

Configuration properties element
When you create your project, you also need to create a configuration file with the following variables. You can copy and paste in the following content:
kafka:
  ssl.endpoint.identification.algorithm: " "
  topic: "employees.salesforce.employee__c"
  groupId: ""
  url: "kafka+ssl://ec2-35-172-13-3.compute-1.amazonaws.com:9096"
tls:
  truststore:
    password: ""
  keystore:
    password: ""
    keyPassword: ""
The topic name was setup in Section 1.
And from Section 2, copy and paste the keystore.jks and truststore.jks files into the src/main/resources folder of your project. These will be referenced from the consumer and producer configuration elements.

Kafka producer configuration
This section will walk you through the settings for the producer configuration.

- Change the dropdown value to Producer Plaintext Connection.
- Change the dropdown value to Edit inline
- From Section 2, copy and paste the KAFKA_URL string into the Bootstrap servers field. It’s a comma separated list of URLs pointing to the servers (e.g. kafka+ssl://ec2-35-173-52-55.compute-1.amazonaws.com:9096,kafka+ssl://ec2-34-234-254-237.compute-1.amazonaws.com:9096…)
- Click on the Security tab and move to the next section

- Change the TLS Configuration drop down to Edit Inline
- Set the Key Store Configuration and Trust Store Configuration to the jks files that we created in Section 2 and pasted into the project. Also fill in the passwords for the Key store password and Trust store password.
Once everything is filled in, click on Test Connection. You should see the following window.

Kafka consumer configuration

- Change the dropdown value to Consumer Platintext Connection.
- Change the dropdown value for Bootstrap Server URLs to Edit inline
- From Section 2, copy and paste the KAFKA_URL string into the Bootstrap servers field or use the configuration properties file value. This is the same list from the Producer configuration. It’s a comma separated list of URLs pointing to the servers. (e.g. kafka+ssl://ec2-35-173-52-55.compute-1.amazonaws.com:9096,kafka+ssl://ec2-34-234-254-237.compute-1.amazonaws.com:9096…)
- Change the Topic Subscription Patterns drop down to Edit Inline
- Add the topic name as a value.
- Click on the Security tab and move to the next section

- Change the TLS Configuration drop down to Edit Inline
- Set the Key store location and Trust store location to the jks files that we created in Section 2 and pasted into the project. Also fill in the passwords for the Key store password and Trust store password.
Once everything is filled in, click on Test Connection. You should see the following window.

Run the Mule application
With everything configured, right-click on the canvas and click on Run project…

The console log will look like the following:

Open a browser window and navigate to http://localhost:8081/publish.

The project doesn’t output anything to the browser, but when you switch back to Anypoint Studio, you’ll see the following message in the Console logs. This shows that the message was written to the topic and then the Consumer flow picked the message off the topic and wrote it to the logs.
Lastly, if you switch back to the Apache Kafka on Heroku console, you’ll see the data showing that a message was received and consumed.

Summary
Using the MuleSoft Kafka Connector, and coupled with Apache Kafka on Heroku, developers can streamline business processes and move data between Kafka and enterprise applications and services quickly and easily.
Visit MuleSoft’s Anypoint Exchange to see even more connectors available on Anypoint Platform.
Bedrock Model customization enables you to deliver differentiated and personalized user experiences by privately fine-tuning FMs using your own labeled datasets. But what does this process look like and how can MuleSoft help? This blog post will walk you through an example that we presented at the event.
Prepare Dataset
For the data we used in the demo, we loaded Knowledge Articles from Salesforce. The content was already in the perfect “prompt/completion” format in order to fine tune a FM. As you can see from the screenshot, the content consists of a “Title” and “Chat Answer” already.
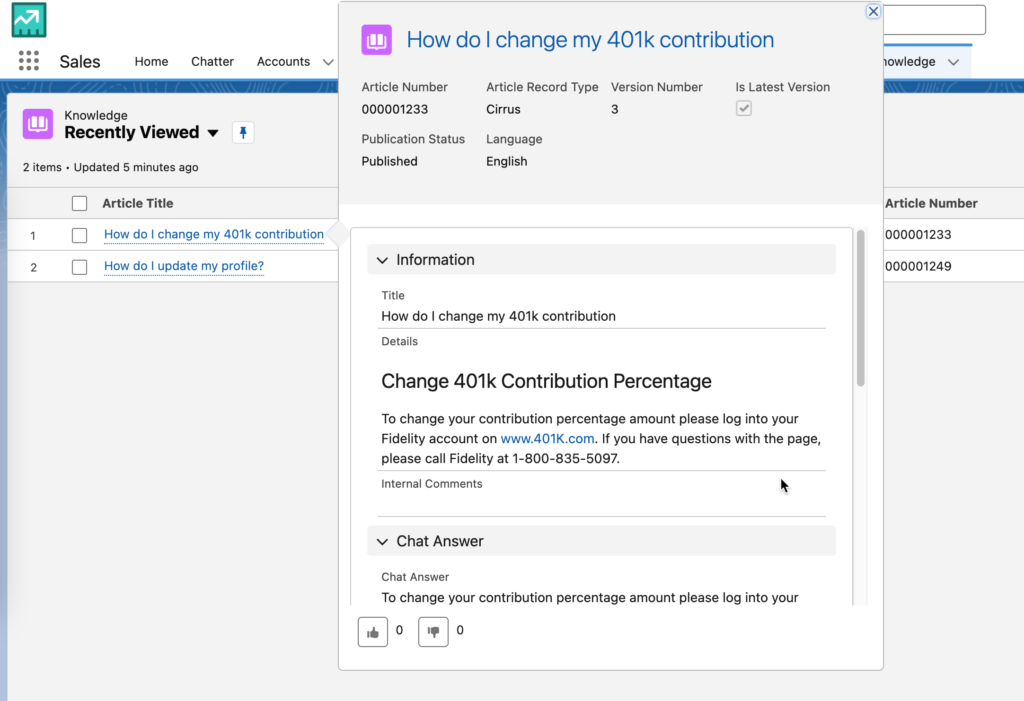
Running the following SOQL query returns the fields you need.
SELECT Title,Chat_Answer__c FROM Knowledge__kav WHERE Language = 'en_US' and Chat_Answer__c <> '' LIMIT 10
But how can we use this data with Amazon Bedrock. That’s where MuleSoft comes in.

Fine-tuning datasets for Amazon Bedrock needs to be a file with multiple JSON lines. This is also known as JSONL. It should look like the following format:
{"prompt": "", "completion": ""}
{"prompt": "", "completion": ""}
{"prompt": "", "completion": ""}
If you’re planning to train an Amazon Titan model, the format needs to have a different set of keys.
{"input": "", "output": ""}
Go to this Github link (https://github.com/djuang1/generate-aws-jsonl-dataset) to download the MuleSoft project. Once you import the project, you’ll see the following flow below.

Let’s walk through the different parts of the flow.
- The flow has an HTTP Listener that allows you to kick off the flow manually. Once the Mule project is running, you can go to http://localhost:8081/load to prepare the dataset.
- The Salesforce Connector is next and leverages the Query operation to go and grab the Knowledge Articles using a SOQL query. The same one we referenced above. With the response data, we transform the results into CSV first before we move to the next component. The DataWeave script to handle this transformation looks like the following:
%dw 2.0
output application/csv
---
payload map ( payload01 , indexOfPayload01 ) -> {
	'input': "'" ++ ((payload01.Title replace "\n" with " ") replace "\"" with "'" default "") ++ "'",
	'output': "'" ++ ((payload01.Chat_Answer__c replace "\n" with " ") replace "\"" with "'" default "") ++ "'"
}
- The Invoke static operation is from the Java connector. This project uses Java code to convert the CSV stream into JSONL. Here’s the function:
public static String convertCSVtoJSONL(InputStream csvInputStream) throws IOException {

		StringBuilder jsonlString = new StringBuilder();

		// Create BufferedReader to read CSV content
        try (BufferedReader br = new BufferedReader(new InputStreamReader(csvInputStream))) {
            // Read the header
            String headerLine = br.readLine();
            String[] headers = headerLine.split(",");

            String line;
            while ((line = br.readLine()) != null) {
                // Split the CSV record using StringTokenizer
                StringTokenizer tokenizer = new StringTokenizer(line, ",");
                ObjectNode jsonNode = new ObjectMapper().createObjectNode();

                // Populate JSON object with CSV data
                for (String header : headers) {
                    if (tokenizer.hasMoreTokens()) {
                        jsonNode.put(header, tokenizer.nextToken());
                    }
                }

                // Convert JSON object to JSON string and append to the result
                jsonlString.append(jsonNode.toString()).append("\n");
            }
        }

        return jsonlString.toString();
	}
- Once the JSONL has been generated, the code leverages the Scatter-Gather scope to write the JSONL to two locations. A local folder so you can see the output, and an AWS S3 bucket that Bedrock will use to fine-tune the FM. Here’s what the file will look like:

Once the JSONL file is loaded into S3, you can create a fine-tuning job in Amazon Bedrock. The output of the flow should look like the following screenshot below:

Create Fine-tuning Job
Switching over to Amazon Bedrock, let’s look at how to create a fine-tuning job. After you log into the AWS console and open Amazon Bedrock, navigate to Custom models in the left-hand navigation bar.

Click on Customize model and then click on Create Fine-tuning job

Select a source model. For the demo we used Amazon Titan Text G1 – Lite and then give the fine-tuned model a name (e.g. mule-model)

Give the job a name (e.g. mule-model-job) and then under the Input data section, select the location of the JSONL file that you created in S3

Adjust the Batch size under the Hyperparameters section if you have a small sample size to test against. In this case, I dropped it to 1. Then select the S3 location to store the tuned model under the Output data section.

Lastly create a new service role or use an existing service role and click on Fine-tine model

When the job is completed successfully, you’ll see the fine-tuned model under the list of custom models

Using the Model
Before you can use the custom model, you’ll need to configure Provisioned Throughput. Once that is configured, you can test it out in the playgrounds. Click on Chat on the left-hand navigation bar and then click Select model

Select Fine-tuned models, the name of the model you created, and then the throughput you provisioned. Click on Apply.

Summary
Preparing the data to fine-tune the model is an important aspect of using Functional Models. Using MuleSoft, you can grab data from any system of record and transform it to the correct format in order to be used for training. Let me know how your experience is going with Amazon Bedrock or if you run into any issues in the comments below.
]]>Setup PowerBI
Before we can connect to Power BI, we need to setup an Azure AD application. Login to Azure and navigate to App registrations and click on New registrations.

Give the application a name (e.g. Power BI App), check Accounts in any organizational directory for Supported account types. Under Redirect URI, select Web from the dropdown and type in https://127.0.0.1:8082/callback. Click on Register

In the newly created app, click on Certificates & secrets and click on New client secret

Give the secret a name and set the expiration date.

Copy down the value and secret ID, you’ll need these when you configure the Mule application.

Next click on API permissions and click on Add a permission

Select Power BI Service

Click on Delegated permissions

Select all the items or just the items that you’d like to provide access to the user/connector and click on Add permissions
That’s it from the Azure side. You can leave this tab open because you’ll need to come back and reference some URLs and IDs as you setup the connector.

Create MuleSoft Application
This tutorial assumes you already know how to build a Mule flow so I’ll skip to the configuration steps of the main pieces of this flow.

HTTP Listener
Let’s start with the HTTP Listener. Because we’re using OAuth to connect to Power BI, we need to configure the flow to expose an HTTPS endpoint in order for the redirect URL to work. In the General tab, select HTTPS for the Protocol and set the Port to 8082.

Under the TLS tab, configure the Key Store Configuration. You can use your own *.jks file or use the one here as an example. The settings are in the screenshot below.

Back in the Mule configuration properties tab, configure the following:

That’s it for the HTTP Listener. Move to the next step to see how to configure the Power BI connector.
Power BI – Get Reports
We’re going to use the Get Reports operation to get a list of reports from your Power BI workspace. The properties tab is pretty straighforward:

In the Global Element Properties window, here are the fields that need to be configured.
The Consumer key and Consumer secret fields are from the Certificates & secrets section when you setup the App in Azure.
You can get the Tenant ID from the Overview page:

The Scope field should be set to https://analysis.windows.net/powerbi/api/.default
Lastly the Callback path and Authorize path should be set to \callback and \authorize respectively.
Move on to the next step to transform the output to JSON.
Transform Message
The last component will just transform the response from Power BI to JSON and return that back to the user in the browser:
%dw 2.0
output application/json
---
payload

That’s for the flow. In the next section, we’re going to run the application and test it out.
Test Application
Let’s test the application, right click on the canvas and click on Run

Once the app is deployed successfully, switch to a browser and navigate to the following URL
| https://localhost:8082/authorize |
Because we’re using OAuth, it’ll direct you to login to your Azure account.

If configured correctly, you’ll be redirected back to the callback URL.

Either open a new tab or change the URL to the following:
| https://0.0.0.0:8082/reports |
The Power BI connector will used the access token that was generated and authenticate the user and make the call to the Power BI endpoint to retrieve the list of reports.

This will correspond to your workspace in Power BI

And that’s it! You’ve successfully configured the Power BI connector. You can use the configuration with any of the available operations. Just be sure to authorize the connector before making any of the calls.
Summary
As we conclude this tutorial, you’ve taken a significant step toward becoming a data integration expert. By using MuleSoft to connect any data source to Power BI, you’ve learned how to seamlessly bridge the gap between data sources and visual insights, putting you in the driver’s seat when it comes to harnessing the power of your organization’s data. Remember that mastering this integration is an ongoing journey, and there are countless opportunities to refine and expand your skills. With this newfound knowledge, you can empower your organization to make data-driven decisions, gain a competitive edge, and drive success.
If you have any questions or need further assistance, feel free to reach out. Stay tuned for more insightful tutorials and guides as we continue to explore the exciting world of data integration and analytics!
Since then, MuleSoft has released a connector and Gen 2 was released. If you search for Gen 2, in the Azure portal, you won’t find it under that name surprisingly. The service is called “Storage Accounts” now which is a bit confusing.
In this post, I’ll show you how to use MuleSoft to connect to Gen 2, or Storage Accounts, using the Azure Data Lake Store connector in Anypoint Studio. So let’s get started.
Requirements
- Anypoint Studio
- Azure Data Lake Connector
- Azure
Setup Azure Storage Account
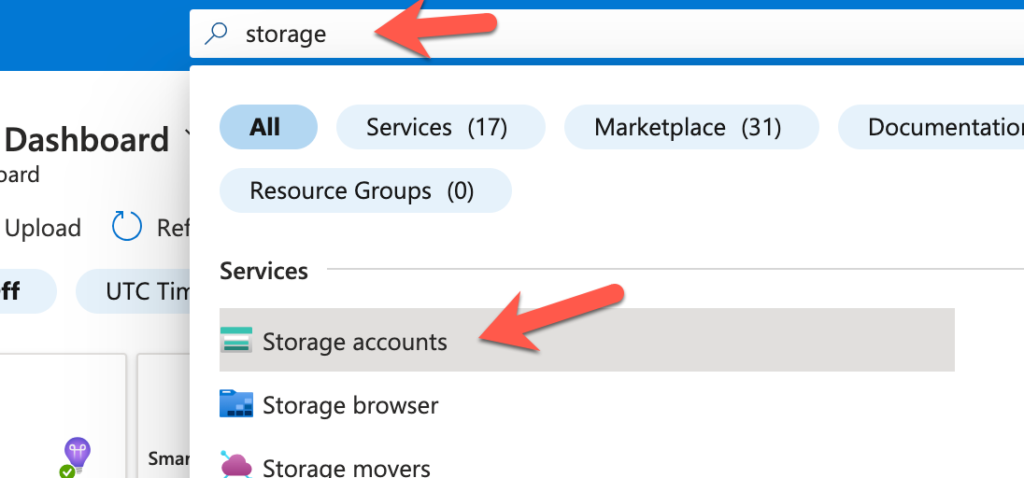
The first thing we need to do is setup a Storage Account. Log in to Azure and in the top search bar, search for “Storage”. From the results, click on “Storage accounts”
Click on “Create”

In the Basics section, give the Storage account a name in the Storage account name field and then click on Next : Advanced
In the Advanced section, check the Enable hierarchical namespace checkbox to enable Gen 2 and then click on Review

Lastly, click on Create

Before we move on to the next step, click on Shared access signature under Security + networking.

Leave this screen open because we’ll need to generate the token when we setup the connection with the Connector later.
Create Mule Project and flow
For the purpose of this post, I’m going to assume that you’re familiar with building Mule applications using Anypoint Studio. After you created a new Mule project, you added the Azure Data Lake Connector (1.0.3) through the Search in Exchange dialog window.

Once you added the connector, you should be able to create the a flow by dragging and dropping components from the palette to the canvas so it looks like the screenshot below.

The flow will expose an HTTP endpoint that creates a new folder in Azure Data Lake. We’re going to use the Create File System operation to achieve this. Once the folder is created, it’ll return any response data back to the user in JSON format.
Configure HTTP Listener
For the HTTP Listener operation, you should use the default settings (e.g. HTTP and port 8081) and the Path field should be set with the value /create so it looks like the following.

Configure Azure Data lake storage Connector
Let’s walk through the connector configuration for the Azure Data Lake Connector. Once you open the dialog window, change the dropdown for the Connection field to Shared Access Signature

Switch back to Azure for the next step. We need to generate the SAS token before we proceed.
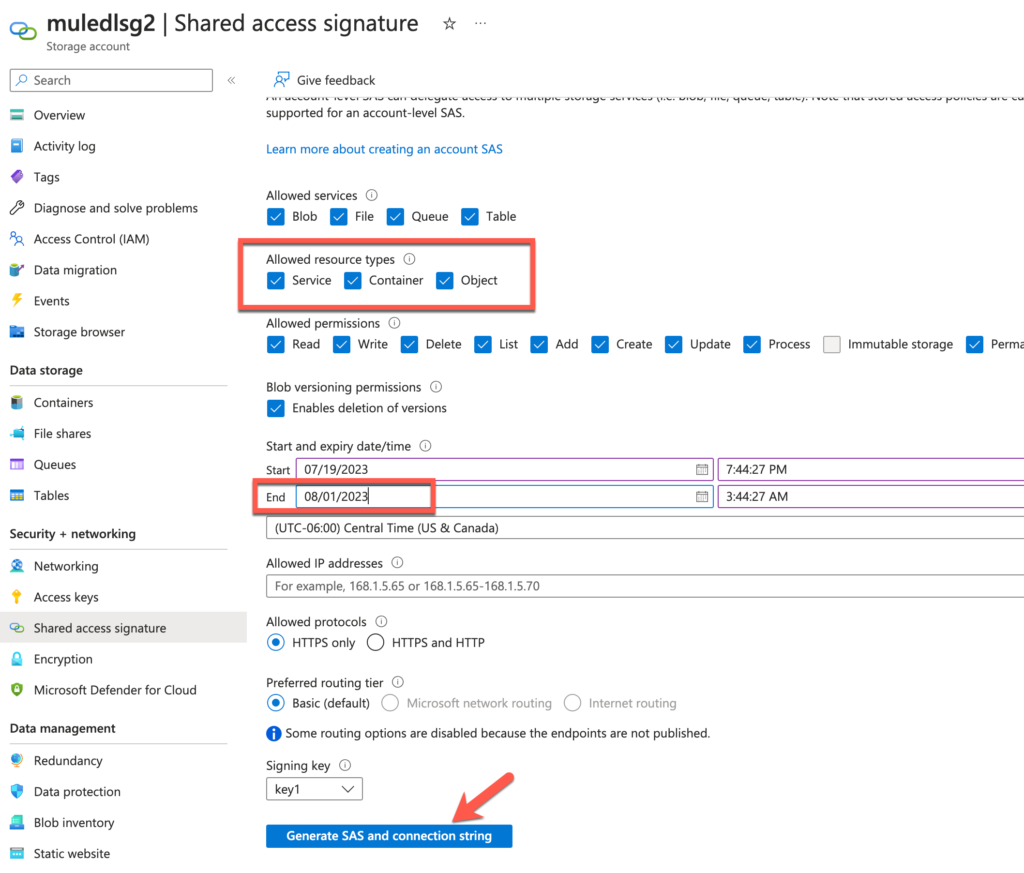
A new section will be displayed with the SAS token. Copy that token by clicking on the copy icon on the right.

Switch back to Anypoint Studio and paste that token in to the SAS token field. Also fill in the Storage account name with the name of the storage account that you created in Azure earlier and use dfs.core.windows.net for the DNS Suffix field.

Click on Test Connection to make sure everything is setup correctly.

Close the dialog window and go back to the Mule properties tab for the connector. Fill in the File System with a folder name (e.g. muledemo) and Timeout field with the value 60.

Configure Transform message
We just want to return anything the Azure Data Lake Connector returns in JSON so the DataWeave script should look like the following:

Run and Test Application
Back on the canvas, right click and select Run project <project name>

Once the app is deployed, switch to your browser and open the URL http://localhost:8081/create

Then switch back to Azure and click on Containers under Data storage and you’ll see the newly created folder.

Summary
Compared with my first post, this method of connectivity with the Azure Data Lake connector is significantly easier. Hopefully this post gets you up and running quickly on connecting to Azure Data Lake. If you run into any issues, leave a comment below. Here are some additional resources to help you.
]]>