Redgate’s DLM Dashboard: The awesome continues

The artist formerly known as SQL Lighthouse, underwent a HUGE overhaul, and now goes by the name DLM Dashboard. This tool allows you to: “monitor your database schemas and alerts you to schema changes, including database drift”. And even though I find Redgate’s tools awesome, I’m still going to be brutally honest in this blog (and I know they appreciate that!).

In the second half of this blog post, there is also a Q&A with a Product Marketer of Redgate. In that Q&A, he answers a few open questions that will clarify the product and the future of this product.

 
Download and install
When you download and install the Redgate DLM Dashboard, you get a number of things. The most important things the installation folder (C:\Program Files (x86)\Red Gate\DLM Dashboard 1) contains are a webserver and a monitoring service. These are used to host the webinterface of the DLM Dashboard, and the service needed for monitoring your environments and databases. There are also 3 Windows services installed: “DLM Dashboard Monitoring Service”, “DLM Dashboard Storage Service” and “DLM Dashboard Web Server”.

 
Configuring your environment
After the installation, the DLM Dashboard is started:

 
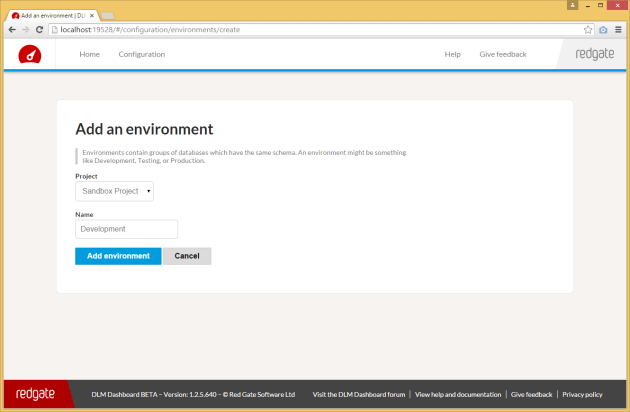
When you click on “Set up DLM Dashboard”, you are redirected to the configuration page. First you need to add a project:

 
I created a Sandbox project, in which eventually all my environments will be configured. So my project will contain my 4 environments (DTAP). DTAP stands for Development, Test, Acceptance and Production. More on DTAP can be found here. In this test, I’m going to start with configuring a Development environment:

 
After adding that, you need to add a server:

I’m using the sa account to connect to this server, because it’s on a stand-alone server. If you start using the DLM Dashboard (or any other software), it’s bad practice to use the sa account. So if you want to use this in your environment, don’t use the sa account!!!

 
In the next screen you see, you get the question if you want to run the monitoring script yourself, or if you want the DLM Dashboard to run it:

 
When the script completes, you end up with a new database on the server that you configured in the dashboard. The database is named Redgate, and the name of the database can’t be changed at this point. For further information on this, check out the Q&A at the bottom of this post.

This database contains only 1 table named “DDL_Events”, to store all the changes that happened in your database(s).

The DLM Dashboard also creates a server DDL-trigger called “RG_SQLLighthouse_DDLTrigger” (which can be found under “Server Objects” -> “Triggers” in SSMS). This trigger registers all the changes on your database, and stores those changes in the Redgate database.

Now you need to combine all the configured items (Environment, Server and Database) in 1 last configuration:

 
I’ve executed these steps (configure an environment, add a server, and add a database) twice, to add a test environment as well. I’ve skipped the Acceptance and Production (which would complete the DTAP) in this test. So now my dashboard looks like this:

 
This is the default view when you just configured your databases. The schema of your database is basically a snapshot of your current database status.

 
Making changes, and marking versions
After you’ve configured the dashboard with all your environments (in my case 2 environment, just for testing purposes), it’s time to make some changes in your databases. Let’s add a table to the Sandbox database on development:

USE Sandbox
GO


CREATE TABLE dbo.TriggerSchemaChange
  (ID INT IDENTITY(1,1),
   Value VARCHAR(10))

 
If you wait for a few seconds (the dashboard will automatically refresh), you see that one of your databases is starting to “drift”:

 
If you click on “Review”, you get an overview of the changes that were made, and by who they were made:

 
In this case, I’ll tag this version as 1.0.0.1, and save that change. The dashboard changes, and the new version is shown. And if we execute the same change on the other database, the DLM Dashboard automatically recognizes the version:

 
You just need to acknowledge the “new” version on the test environment, just like on the development environment, and your dashboard looks all okay again:

 
The world ain’t all sunshine and rainbows…
Even though I think this is a wonderful way to keep an eye on your environment, there are still a few things that are missing in my opinion. I’ve asked Redgate these questions, and Andrew Denty (Blog | @andrewdenty), who is a Product Marketer at Redgate, was kind enough you answer these questions. This Q&A is published after getting permission from Andrew and Redgate. Thanks again Andrew!

 
1) What is the delay in tracking changes and refreshing the webpage, and can we change that?

The DDL trigger we install on the SQL Server puts entries into a table each time a database is changed.

Currently we poll the server every 13 seconds and query that table to see if there have been any changes.

This at the moment is not configurable, but should be as it is not a lot of work (and will probably be done before we leave beta). It’s also worth pointing out that you don’t need to hit refresh or anything – the dashboard live refreshes on its own.

 
2) Can we change the port number on which the webinterface runs (default 19528)?

Yes see http://documentation.red-gate.com/display/SL1/Changing+the+port+SQL+Lighthouse+uses

 
3) Can we change the database name (rename from RedGate to DBA for example), or log events to a dedicated database or server? And how does it react when the target server isn’t available?

At the moment no, the Redgate database is hard coded into the application, and is expected to be on the same server as the databases we are monitoring. The DDL trigger lives on the server so it always runs if the server is running. If DLM dashboard cannot reach the SQL server it will show you in the UI the server is not available. When it becomes available again DLM dashboard will check if there has been changes whilst it has been unavailable’.

 
4) Why do you use a DDL trigger, instead of Extended Events?

In SQL Lighthouse, because our DDL Trigger runs when a change happens, and crucially because it runs synchronously with the change, i.e. the change is temporarily blocked until we return. Therefore we not only get the information that we’re given, but we can also ask for other information, like the:

1. Accurate date it happened
2. The application that made the change
3. The IP address that made the change
4. The nest level, e.g. was this a change made directly, or did a change run a DDL Trigger + that DDL Trigger made this change
5. The transaction ID to help us group changes together

In contract, events run asynchronously, so by the time we see the message on the queue, the information above *may* still be queryable, but will probably not be available, and we can’t rely on it. The plus side of events is that they can’t break anything, because they run asynchronously, whereas if the DDL Trigger throws an error it’ll break what the user is doing.

In summary, we want the extra information so had to go with DDL Triggers.

 
5) The configuration limitations, are these just in the beta? The current configuration limitation is 5 database per environment

At the moment the beta isn’t designed to scale. We’re going to be working on improving the performance and scalability over the coming month. When we leave beta we’re planning to have a pro and the current free version. The pro version will allow you to monitor more instances and databases than the free version which will have some limitations. We’re still working out the exact details though.

 
6) Is there any SQLCompare integration planned? So for example, an overview of the differences between 2 environments (Development and Test), or syncing of 2 databases on different environments?

Yes, we’d like to add this to the Dashboard (assuming you have SQL Compare as well). We’d like to do this later this year– but we’re being agile and responding to feedback so we might change our plans and do something else first. Please do vote this up on UserVoiceas we’re using that to help us decide what to do next.

 
7) What is the plan on Octopus Deploy integration? We’re looking into that for automatic deploys, and it would be great to deploy a version from DLM Dashboard for example

Triggering deployments from the Dashboard isn’t something we have planned, though we do want to help be part of your release management process. I’d like us to be able to report back to Octopus if there has been drift away from the release it thinks is deployed (e.g .a hotfix has been made directly on production), so that you can get those changes back into process. Our SQL Releaseproduct (which is a database deployment plugin for Release Management tools like Octopus) may well use elements of the dashboard in the future.


Bugs
There are still a few bugs in the software:

– If you remove your project, the whole dashboard is empty, the database monitoring is still active, but you’re not asked if you want to disable/remove it completely
– If you remove your database, the database monitoring is still active, and Redgate database isn’t removed
– If you’re adding a column to a table, 2 columns are marked as changed (bugfix in progress)
– Cancel button that doesn’t work on the email notification screen (bugfix in progress)
– Can’t mark your initial version to a certain name (for example, tag it as version 1.0.0.0) (bugfix in progress)
– If your machine name is long, it’s trimmed in the review changes screen (bugfix in progress)
– Sometimes the webservice doesn’t start after a reboot of the machine, and you need to start it manually (bugfix in progress)

As mentioned, most of these bugs are already fixed, and ready for the next release. Redgate is really fast with picking up on bugs and fixing them. So if you find any bugs, please let them know!

 
Recap
Looking at the possibilities of the DLM Dashboard, and the version that is available now, I’m pretty confident this can become a great product! Redgate haven’t announced the differences between the free and paid versions yet, but there will always be a free version. Also, knowing Redgate, getting the paid version won’t be the biggest problem to overcome. Their licenses are pretty affordable, and the tools are indispensable if you ask me.

I think Redgate discovered a whole new market with this. They are jumping on the “release early, release often” train, and they do it quite well on the first try! I’ve never seen database professionals do this, in all the companies I’ve seen in the past. Only the .NET developers did that, and we all mocked them for it. But now, we’re starting to see a shift in the market, and Redgate is willing to help us on this. And for that, I want to thank the people of Redgate!

Speeding up your backups

Last week, I watched the SQLRally session of Pieter Vanhove (Blog | @Pieter_Vanhove), where he talked about Advanced Backup and Restore. He mentioned striped backups (taking a backup of a database, divided over a number of files). After watching the video, I started to wonder what made the biggest difference: the number of files, the number of disks, compression.

 
Test setup
In order to test this, I restored a copy of the AdventureWorks2012 database, that you can download from msftdbprodsamples.codeplex.com. But because this database is only 200MB, taking a backup would only take a second. In order to make this a bit more interesting, I used a script Adam Machanic (Blog | @AdamMachanic) wrote. This script creates 2 new objects in the AdventureWorks database (dbo.bigProduct and dbo.bigTransactionHistory), which results in a database of 2.8GB. You can download the script here.

 
What matters most?
In order to test the differences in performance, I’ve tested multiple combinations:

– Multiple files on single disk
– Multiple files on 2 disks
– Both options above, with and without backup compressions

After running all the different tests, I’ve added the results to an Excel sheet:

 
The results you see are in milliseconds. The analysis on these numbers is a bit difficult, so let’s put these numbers in a graph:


As you can see, the number of files (when looking at a minimum of 2 files) isn’t the biggest difference. The number of disks, and compression vs no compression make the biggest difference. In my case, I tested it on 2 SSD’s, but you may have more disks in your server. Or better yet, you are able to take backups on multiple LUN’s on your storage, and the LUN’s use multiple disks. The more spindles you can use, the faster your backup will become.

But there’s also a downside to this. When you want to restore a backup, you need all the files to do that. So when you restore a normal backup, you only need 1 file. If you’re going to stripe your backup over 16 files for example, you need all 16 files to perform a restore. So basically, the chance of having a corrupt backup file is 16x as high, compared to a normal (single file) backup. For every advantage, there’s always a disadvantage…

If you want to read more about backups, don’t forget to check out these blog posts:

Julie Koesmarno: On sabbatical
Mickey Stuewe: Transaction Log Backups for the Accidental DBA
Chris Yates: Backups – They Are Needed, Who Knew?

Find SQL Server Agent job history retention with T-SQL

In SQL Server, the Job Agent has its own retention that you can set. This retention determines how much execution history of SQL Server Agent jobs is being kept. But if you have a lot of instances across your domain, or if you reinstall a new server, how do you determine if this value is set correctly?

 
Doing it old-school: via the GUI
You can check the SQL Server agent retention via the GUI, by right-clicking on the SQL Server Agent, and clicking on properties. In the window that popped-up, click on History, and you’ll see something like this:

 
T-SQL / Registry
The way I wanted to check it is with T-SQL. Because I want to run the statement against a 40+ instances, I use a multi-server query for that. The reason I do that, is that this returns all the results in a single table, which makes reviewing and comparing the results a lot easier.

But there doesn’t seem to be a way to query the set values. But with a little bit of searching, I found out that you use the stored procedure below to change one of the values:

EXEC msdb.dbo.sp_set_sqlagent_properties @jobhistory_max_rows = 999

 
So by dissecting this procedure, I found out SQL Server just reads the value from a registry key. I took out the piece that I need to read the retention values:

DECLARE @jobhistory_max_rows INT = NULL,
        @jobhistory_max_rows_per_job INT = NULL


EXECUTE master.dbo.xp_instance_regread N'HKEY_LOCAL_MACHINE',
                                        N'SOFTWARE\Microsoft\MSSQLServer\SQLServerAgent',
                                        N'JobHistoryMaxRows',
                                        @jobhistory_max_rows OUTPUT,
                                        N'no_output'
SELECT @jobhistory_max_rows = ISNULL(@jobhistory_max_rows, -1)


EXECUTE master.dbo.xp_instance_regread N'HKEY_LOCAL_MACHINE',
                                        N'SOFTWARE\Microsoft\MSSQLServer\SQLServerAgent',
                                        N'JobHistoryMaxRowsPerJob',
                                        @jobhistory_max_rows_per_job OUTPUT,
                                        N'no_output'


SELECT @jobhistory_max_rows, @jobhistory_max_rows_per_job

 
But when I wanted to look up the values in the registry, to see if it returned the correct results, I couldn’t find the actual keys. I thought I was losing my mind, but there’s a catch…

 
xp_instance_regread vs xp_regread
There are 2 stored procedures you can use to read registry keys from your SQL Server:

DECLARE @jobhistory_max_rows INT = NULL

EXECUTE master.dbo.xp_instance_regread N'HKEY_LOCAL_MACHINE',
                                        N'SOFTWARE\Microsoft\MSSQLServer\SQLServerAgent',
                                        N'JobHistoryMaxRows',
                                        @jobhistory_max_rows OUTPUT,
                                        N'no_output'

SELECT @jobhistory_max_rows

 
or

DECLARE @jobhistory_max_rows INT = NULL

EXECUTE master.dbo.xp_regread N'HKEY_LOCAL_MACHINE',
                                        N'SOFTWARE\Microsoft\MSSQLServer\SQLServerAgent',
                                        N'JobHistoryMaxRows',
                                        @jobhistory_max_rows OUTPUT,
                                        N'no_output'

SELECT @jobhistory_max_rows

 
The difference between the two is perfectly explained in this Stack Overflow thread:

xp_regread reads the literal registry path that you specify. xp_instance_regread “converts” the path you specify so that it matches the instance of SQL Server that you’re currently using.

 
So if you run multiple instances on your machine, you want to use the instance version of the stored procedure. If you’re just running 1 (default) instance, you can use both versions.

So eventually, I searched for the instance folder, and I did find the registry keys:

 
Conclusion
Especially for very large environments, it’s a good idea to write system- and/or server-checks in T-SQL. That way, you can script them in SCOM (or another monitoring tool), or if you use SQL Server Policy Based Management (and I would really like to recommend this Pluralsight course from a very good friend of mine: Boris Hristov (Blog | @BorisHristov)!), or just a multi-server query.

Creating a free SQL Server test environment in 15 minutes

In order to test new SQL Server tools or other applications, I use a small test environment on my laptop. I wanted to share how I normally (and pretty quickly) set up a test environment.

 
Installing Hyper-V
Right now, I rely on Hyper-V to host my virtual machines. This is build-in in Windows, and easy to use. Before I could use that, I enabled and installed Hyper-V on my Windows 8 machine.

 
Adding network connectivity for your VM’s
When you enabled Hyper-V, and before you create your first VM, you want to add a virtual network card to your VM. You can do that by clicking on “Virtual Switch Manager” on the right of the Hyper-V Manager. In the window that pops up, you choose “External”, and click on “Create Virtual Switch”. Because I work on a laptop, I can choose between 2 adapters: UTP and WiFi. But because I want my VM to work within the company network, I choose the external network adapter (personal preference).

 
Create a VM and install Windows Server 2012
Now that you have a working Hyper-V setup, you can download Windows Server 2012 Evaluation. Just create a new VM in the Hyper-V Manager, go through the options (configure number of CPU’s, memory, etc.), and double click on the VM you created. In the menu bar, click on “Media”, and mount the Windows ISO in the DVD Drive menu. Start the VM, and run through the Windows setup.

Approximate time needed: 6 minutes

 
Enable .NET Framework 3.5
For some reason, when enabling or installing .NET Framework 3.5, Windows Server 2012 throws an error. I haven’t been able to figure out why this fails, but you can’t manage without it because it’s needed to install SQL Server.
After the installation of Windows Server 2012, you can run the command below in either command prompt or PowerShell (Change X: to the driveletter with the Windows installation files):

Dism /online /enable-feature /featurename:NetFx3 /All /Source:X:\sources\sxs /LimitAccess

Approximate time needed: < 1 minute

 
Changing the machine name
To make it easier for yourself to work with SQL Server (and possible connections to and from other machines on the network) later on, you should change the machine name. If you don’t do that, you need to connect to “WIN-ABCD1E2F3GH\InstanceName” with SSMS. A shorter machine name is more useful and meaningful. This prevents mix-ups of multiple VM’s, or really long connectionstrings in application config files.

You can do that by pressing Windows Key + X, click on “System”, “Change Settings”, “Change”, and change the “Computer name” value. When you change that, you need to restart your VM.

Approximate time needed: < 1 minute

 
Installing SQL Server
Now that you have a working environment, we can start with the actual important bit: installing SQL Server. For my test environment, I use SQL Server 2014. You can just download the SQL Server 2014 Evaluation Edition from the Microsoft website. Personally, I just install the engine and the tools (SSMS), but that depends on the reason I create that machine.

Approximate time needed: 6 minutes

 
Was that fast or what?!
As a result, you have a fully working test environment that lasts 180 days (the duration of the evaluation editions), without the cost of licenses. And the more you need a test VM, the faster you can do it. Personally, I store both ISO files in a directory on my laptop. If I need a test environment, it takes me about 10 minutes to install a brand new VM (depending on disk performance). You just need to create a new VM, install the operating system, install SQL Server, and it’s ready to go!

Enjoy your testing or learning!

How to determine SQL Server uptime?

Determining the SQL Server uptime can be difficult. Because SQL Server is a Windows service that can be stopped and started without restarting the OS, the uptime of your SQL Server can be completely different compared to your server uptime. So how do you determine both uptimes from within SQL Server?

 
tempdb
One of the ways to determine the last restart of SQL Server, is by looking at the tempdb. Because the tempdb is recreated on SQL Server startup, you could get an indication of the uptime of your SQL Server, by querying the creation date:

SELECT create_date AS START_TIME_INSTANCE FROM sys.databases WHERE name = 'tempdb'

 
SQL Server error log
In the SQL Server error log, the startup time is stored on a regular basis, together with a process ID. This information can be retrieved in 2 ways. You can look for either the process id event:

DECLARE @XREL TABLE
    (LogDate DATETIME,
     ProcessInfo VARCHAR(100),
     Text VARCHAR(MAX))

/* Insert current log */
INSERT INTO @XREL
EXEC xp_readerrorlog
 
/* Insert previous log */
INSERT INTO @XREL
EXEC xp_readerrorlog 1
 
SELECT TOP 1 *
FROM @XREL AS X
WHERE X.TEXT LIKE '%Server process ID is%'
ORDER BY LogDate DESC

 
or look for the informational message regarding the process ID:

DECLARE @XREL TABLE
    (LogDate DATETIME,
     ProcessInfo VARCHAR(100),
     Text VARCHAR(MAX))

/* Insert current log */
INSERT INTO @XREL
EXEC xp_readerrorlog
 
/* Insert previous log */
INSERT INTO @XREL
EXEC xp_readerrorlog 1
 
SELECT TOP 1 *
FROM @XREL AS X
WHERE X.Text LIKE '%This instance of SQL Server has been using a process %'
ORDER BY LogDate DESC

 
In the first query, you can look at the LogDate. In the second query, you need to extract the datetime from the Text column.

 
sysprocesses
Another way to find out the startup time, is by looking at the view sys.sysprocesses. This contains information about running processes. And when you look at SPID 1 (system process), you’ll find the startup time of SQL Server:

SELECT
  login_time AS START_TIME_INSTANCE
FROM sys.sysprocesses
WHERE spid = 1

 
sys.dm_os_sys_info
The last possibility for SQL Server uptime I want to share is querying the sys.dm_os_sys_info view. Looking at MSDN, this view contains “a miscellaneous set of useful information about the computer, and about the resources available to and consumed by SQL Server.” Also, the instance startup time:

SELECT sqlserver_start_time AS START_TIME_INSTANCE
FROM sys.dm_os_sys_info

 
Server startup
Not only SQL Server uptime can be important, but also the server uptime (the hardware on which SQL Server runs). But if you run Windows 8 or Windows Server 2012, this isn’t always accurate. But you can retrieve the accurate with T-SQL:

SELECT
  DATEADD(MILLISECOND, (sample_ms * -1), GETDATE()) AS BOOT_TIME_MACHINE
FROM sys.dm_io_virtual_file_stats(DB_ID(N'tempdb'), 2)

 
Dashboard Report
Another way to retrieve the server startup time (without T-SQL, and without using the event viewer in the OS or other tools), is to use the SQL Server Dashboard Report. You can view this report, by right-clicking on the servers name in SQL Server Management Studio (SSMS), and select Reports -> Standard Reports -> Server Dashboard. If you look at the report, in the left table you’ll see the Server Startup time.

Published CDC article

A few years ago, I made a list of goals I wanted to work towards, and things I wanted to achieve. One of those things was speaking (which I achieved in January 2015). Another point on the list was to write an article for a published magazine. Today, I’m proud to announce I can cross that goal off my list as well!

In December 2014, I saw a tweet from Marcel Meijer (Blog | @MarcelMeijer ), asking who wanted to write an article for SDN Magazine. After thinking about it for a while, I decided to just go for it.

Earlier this week, I saw the magazine was available for download on the SDN website. I’m honored my article was published, and I can only hope the people who read the magazine like it.

If you read the article, I’d love to hear your opinion!

Avoid a big SSISDB by logging less…?

Last week I blogged about how logging can grind your SSIS to a halt. After posting the blog, I got a really interesting reaction from Koen Verbeeck (Blog | @Ko_Ver):

I knew there were different logging levels in SSIS, but I couldn’t recall the difference in levels. So I discussed about the difference with Koen. At first glance we thought that the biggest difference is the fact that performance logging only logs warnings and errors. So basically, you decrease the amount of messages logged, which should results in a slightly better performance. But is that really the case?

 
Different logging levels
In SSIS there are 4 different logging levels. So what are the options, and what’s the difference between them? You can read all about it on MSDN, but the short version is:

None: Logging is turned off
Basic (default value): All evens are logged, except custom- and diagnostic events
Performance: Only performance statistics, OnError and OnWarning events are logged
Verbose: All events are logged

 
The next questions is: where to change these options. For example, how do I change my logging level to performance?

 
SSISDB / Catalog
When you want to change the logging level for all your deployed SSIS packages, you could change the setting on your catalog. You can do that by opening the “Integration Services Catalogs” on your instance, right-click on your catalog, and choose an option for “Server-wide Default Logging Level”:

 
If you change this, the logging level for all packages in this catalog will change. But maybe you don’t want that, and you only want it for a specific package.

 
SQL Server Agent Job
Another option is do configure this in your SQL Server Agent job:

 
If you use this option, the logging level will change for the package that is executed in the job step. So no permanent change, but only for the duration of the job.

 
At package execution
Another option is to do it at package runtime:

 
Personally I don’t use that option of executing packages, but you might. The same applies as the change on the SQL Server Agent job, this will only change the option for the duration of the execution, so no permanent change.

 
How to determine your best choice
Making a good decision is difficult in this case. When something goes wrong, you want to log everything. But when things run smoothly, it’s a waste of time to log every event that passes by in SSIS. And how do you determine the level of logging you need, without knowing what data is in your SSISDB? If you want to analyze that, you could use a query like this:

SELECT
  EventCounts.EventName,
  EventCounts.NumberOfEvents,
  CONVERT(FLOAT,(CONVERT(FLOAT,[NumberOfEvents]) / SUM(NumberOfEvents) OVER ()) * 100) AS 'Percentage'
FROM
  (
    SELECT
      EM.event_name AS 'EventName',
      COUNT(*) AS 'NumberOfEvents'
    FROM SSISDB.catalog.event_messages AS EM
    WHERE EM.event_name IS NOT NULL
    GROUP BY EM.event_name
  ) EventCounts
ORDER BY EventCounts.EventName ASC

 
This shows you the type of events stored in your SSISDB, the amount of events, and a percentage over the whole dataset. This can help you determine the logging level you need in your specific case.

 
But here’s the catch…
Performance logging doesn’t actually make your packages run faster… Koen sent me this blog post from Matt Masson (Blog | @mattmasson). In his blog post, he explains what events are logged at the specific levels. And this is what he says about performance level:

The Performance log level should be used when you are doing benchmarking and performance tuning for your packages. While it actually logs less messages to the [catalog].[operation_messages] view than Basic, it captures a lot more events internally to analyze the performance of the data flow components. As a result, there is a bit more overhead during execution – packages run with Basic will actually run a little faster than Performance (in this case Performance means “give me all of the performance details”, not “run my packages as fast as you can”).

 
Conclusion
Even though SSIS is easy to use, there are some pros and cons. The longer I work with SSIS (and that’s not on a daily basis), the more of these pitfalls I discover. And even though they can be fixed pretty fast, it normally takes you time to figure out the problem, because I’m not that familiar with the inner-workings of SSIS. And even when you think you have found a solution for your problem, SSIS just works slightly different than expected. I’m just glad I have friends like Koen to help me out when needed! Thanks again Koen!

SSISDB: Why bigger isn’t always better

Two weeks ago I encountered some strange issues with the SSISDB. Packages and processes started failing, and all we could find is this error message:

 
The image above is an extract of the standard SSMS “All Executions” report. You can find this by right-clicking your SSISDB, click on Reports, then Standard Reports, and choose the “All Executions” report.

While the packages started failing, we couldn’t find a cause. Deploying new packages wasn’t possible either. There were no events logged in the report, in the Windows event viewer, or in the SQL Server error log. So there was no starting point to further investigate this issue.

 
Finding the cause
Checking the size of the SSISDB showed some possible cause of the issue: it was 72GB big! This seemed odd, because we don’t store a lot of packages in the SSISDB. I knew SSISDB contained some logging information, but I didn’t knew how much. Checking the “Disk usage per table” report (another standard report in SSMS), the problem became a bit more obvious:


So basically there were over 67 million records in the database! This shouldn’t have happened, because the log retention should be set so 14 days. But we quickly found the problem:


The retention was set to 365 days. This could only mean the the SSISDB was re-created, and this setting wasn’t changed after the deploy. This resulted in a lot of extra logging data in the database. Because of the amount of record, the standard “SSISDB Maintenance job” ran for 40+ minutes, instead of a maximum of 8 minutes (which it normally needs to clean up logging). But setting the retention to 14 days and running the maintenance job would just result in an endless running job. So how could you prevent that?

 
Grabbing the bigger hammer
In most cases, grabbing a bigger hammer to solve the problem isn’t your best option. In this case, I didn’t see another way. After some searching, I found this blog post about truncating the log tables in SSISDB. Below you find the copy of the script. The credits for this script go to Ibrahim Naji (Blog | @thinknook).


CREATE PROCEDURE [internal].[cleanup_server_retention_window_truncateall]
AS  
     
SET NOCOUNT ON
     
DECLARE @enable_clean_operation bit
DECLARE @retention_window_length INT
     
DECLARE @caller_name nvarchar(256)
DECLARE @caller_sid  varbinary(85)
DECLARE @operation_id BIGINT
     
EXECUTE AS CALLER
    SET @caller_name =  SUSER_NAME()
    SET @caller_sid =   SUSER_SID()
REVERT
          
     
BEGIN TRY
    SELECT @enable_clean_operation = CONVERT(bit, property_value) 
        FROM [catalog].[catalog_properties]
        WHERE property_name = 'OPERATION_CLEANUP_ENABLED'
         
    IF @enable_clean_operation = 1
    BEGIN
        SELECT @retention_window_length = CONVERT(INT,property_value)  
            FROM [catalog].[catalog_properties]
            WHERE property_name = 'RETENTION_WINDOW'
                 
        IF @retention_window_length <= 0 
        BEGIN
            RAISERROR(27163    ,16,1,'RETENTION_WINDOW')
        END
             
        INSERT INTO [internal].[operations] (
            [operation_type],  
            [created_time], 
            [object_type],
            [object_id],
            [object_name],
            [STATUS], 
            [start_time],
            [caller_sid], 
            [caller_name]
            )
        VALUES (
            2,
            SYSDATETIMEOFFSET(),
            NULL,                     
            NULL,                     
            NULL,                     
            1,      
            SYSDATETIMEOFFSET(),
            @caller_sid,            
            @caller_name            
            ) 
        SET @operation_id = SCOPE_IDENTITY() 


        -- Remove all [internal].[executions] dependancies
        TRUNCATE TABLE [internal].[executable_statistics]
        TRUNCATE TABLE [internal].[execution_component_phases]
        TRUNCATE TABLE [internal].[execution_data_statistics]
        TRUNCATE TABLE [internal].[execution_data_taps]
        TRUNCATE TABLE [internal].[execution_parameter_values]
        TRUNCATE TABLE [internal].[execution_property_override_values]


        -- Remove all [internal].[event_message_context] dependancies
        TRUNCATE TABLE [internal].[event_message_context]

        -- Remove all non-dependant tables
        TRUNCATE TABLE [internal].[operation_os_sys_info]
        TRUNCATE TABLE [internal].[operation_permissions]
        TRUNCATE TABLE [internal].[validations]
        TRUNCATE TABLE [internal].[extended_operation_info]

        -- Deal with [internal].[event_messages] and [internal].[operation_messages]
        ALTER TABLE [internal].[event_message_context] DROP CONSTRAINT [FK_EventMessageContext_EventMessageId_EventMessages]
         
        TRUNCATE TABLE internal.event_messages
         
        ALTER TABLE [internal].[event_message_context]  WITH CHECK ADD  CONSTRAINT [FK_EventMessageContext_EventMessageId_EventMessages] FOREIGN KEY([event_message_id])
        REFERENCES [internal].[event_messages] ([event_message_id])
        ON DELETE CASCADE

        ALTER TABLE [internal].[event_messages] DROP CONSTRAINT [FK_EventMessages_OperationMessageId_OperationMessage]
         
        TRUNCATE TABLE [internal].[operation_messages]

        ALTER TABLE [internal].[event_messages]  WITH CHECK ADD  CONSTRAINT [FK_EventMessages_OperationMessageId_OperationMessage] FOREIGN KEY([event_message_id])
        REFERENCES [internal].[operation_messages] ([operation_message_id])
        ON DELETE CASCADE

        -- Deal with [internal].[executions]

        ALTER TABLE [internal].[executable_statistics] DROP CONSTRAINT [FK_ExecutableStatistics_ExecutionId_Executions]
        ALTER TABLE [internal].[execution_component_phases] DROP CONSTRAINT [FK_ExecCompPhases_ExecutionId_Executions]
        ALTER TABLE [internal].[execution_data_statistics] DROP CONSTRAINT [FK_ExecDataStat_ExecutionId_Executions]
        ALTER TABLE [internal].[execution_data_taps] DROP CONSTRAINT [FK_ExecDataTaps_ExecutionId_Executions]
        ALTER TABLE [internal].[execution_parameter_values] DROP CONSTRAINT [FK_ExecutionParameterValue_ExecutionId_Executions]
        ALTER TABLE [internal].[execution_property_override_values] DROP CONSTRAINT [FK_ExecutionPropertyOverrideValue_ExecutionId_Executions]

        TRUNCATE TABLE [internal].[executions]

        ALTER TABLE [internal].[execution_property_override_values]  WITH CHECK ADD  CONSTRAINT [FK_ExecutionPropertyOverrideValue_ExecutionId_Executions] FOREIGN KEY([execution_id])
        REFERENCES [internal].[executions] ([execution_id])
        ON DELETE CASCADE

        ALTER TABLE [internal].[execution_parameter_values]  WITH CHECK ADD  CONSTRAINT [FK_ExecutionParameterValue_ExecutionId_Executions] FOREIGN KEY([execution_id])
        REFERENCES [internal].[executions] ([execution_id])
        ON DELETE CASCADE

        ALTER TABLE [internal].[execution_data_taps]  WITH CHECK ADD  CONSTRAINT [FK_ExecDataTaps_ExecutionId_Executions] FOREIGN KEY([execution_id])
        REFERENCES [internal].[executions] ([execution_id])
        ON DELETE CASCADE

        ALTER TABLE [internal].[execution_data_statistics]  WITH CHECK ADD  CONSTRAINT [FK_ExecDataStat_ExecutionId_Executions] FOREIGN KEY([execution_id])
        REFERENCES [internal].[executions] ([execution_id])
        ON DELETE CASCADE
         
        ALTER TABLE [internal].[execution_component_phases]  WITH CHECK ADD  CONSTRAINT [FK_ExecCompPhases_ExecutionId_Executions] FOREIGN KEY([execution_id])
        REFERENCES [internal].[executions] ([execution_id])
        ON DELETE CASCADE
         
        ALTER TABLE [internal].[executable_statistics]  WITH CHECK ADD  CONSTRAINT [FK_ExecutableStatistics_ExecutionId_Executions] FOREIGN KEY([execution_id])
        REFERENCES [internal].[executions] ([execution_id])
        ON DELETE CASCADE
         

        -- Deal with [internal].[operations]
        DECLARE @deleted_ops TABLE(operation_id BIGINT, operation_type SMALLINT)

        DELETE --TOP (@delete_batch_size)
        FROM [internal].[operations] 
        OUTPUT DELETED.operation_id, DELETED.operation_type INTO @deleted_ops
        WHERE operation_id != @operation_id


        DECLARE @execution_id BIGINT
        DECLARE @sqlString              nvarchar(1024)
        DECLARE @key_name               [internal].[adt_name]
        DECLARE @certificate_name       [internal].[adt_name]
             
             
        DECLARE execution_cursor CURSOR LOCAL FOR 
            SELECT operation_id FROM @deleted_ops 
            WHERE operation_type = 200
             
        OPEN execution_cursor
        FETCH NEXT FROM execution_cursor INTO @execution_id
             
        WHILE @@FETCH_STATUS = 0
        BEGIN
            SET @key_name = 'MS_Enckey_Exec_'+CONVERT(VARCHAR,@execution_id)
            SET @certificate_name = 'MS_Cert_Exec_'+CONVERT(VARCHAR,@execution_id)
            SET @sqlString = 'IF EXISTS (SELECT name FROM sys.symmetric_keys WHERE name = ''' + @key_name +''') '
                +'DROP SYMMETRIC KEY '+ @key_name
                EXECUTE sp_executesql @sqlString
            SET @sqlString = 'IF EXISTS (select name from sys.certificates WHERE name = ''' + @certificate_name +''') '
                +'DROP CERTIFICATE '+ @certificate_name
                EXECUTE sp_executesql @sqlString
            FETCH NEXT FROM execution_cursor INTO @execution_id
        END
        CLOSE execution_cursor
        DEALLOCATE execution_cursor

        END
END TRY
BEGIN CATCH
         
         
    IF (CURSOR_STATUS('local', 'execution_cursor') = 1 
        OR CURSOR_STATUS('local', 'execution_cursor') = 0)
    BEGIN
        CLOSE execution_cursor
        DEALLOCATE execution_cursor            
    END
         
    UPDATE [internal].[operations]
        SET [STATUS] = 4,
        [end_time] = SYSDATETIMEOFFSET()
        WHERE [operation_id] = @operation_id;       
    THROW
END CATCH
     
RETURN 0

 
After running this on the test environment, I found out it worked as I expected. I started the script on production (where the problem was found in the first place), and when it finished I changed the retention from 365 to 14 days:


After doing that, I ran the “SSISDB Maintenance job” (which ran fine), and an SSIS package as a test (worked fine as well). And looking at the record counts, it worked fine:


I’m not saying you should run this on your system, but I’m just saying this works fine on my system, and in my specific case. If you find any code on the internet, test it on a non-critical system first, before you run it in production!!!

 
Conclusion
Having error logging is a good thing. It can help you determine problems, and you can see if and how process grow over time. But too much logging for SSIS causes performance issues, prevents you from deploying new packages, and can even cause unexpected termination of SSIS packages. One way to prevent that is by changing the history retention of your SSISDB.

SQLUGBE Session – Resources

Last week I presented a session to the SQL Server User Group Belgium. The session about CDC was my first ever UG presentation, and it was exciting and scary at the same time. But I was glad there were some familiar faces in the audience. Not only Pieter Vanhove (Blog | @Pieter_Vanhove) was attending, but also Koen Verbeeck (Blog | @ko_ver) and Johan Bijnens (@alzdba). This made it a bit easier to talk to the group of attendees (about 25), because I knew I could use their help if things didn’t go as planned. But the session went okay. I felt a bit too nervous, talked too fast, and didn’t really watch the time. All rookie mistakes of course. There was a 2,5 hour timeslot reserved, and in the end I talked about CDC for 2 hours and 15 minutes! Surprisingly, it didn’t feel like that at all! Sorry to all the attendees for that!

A few attendees came by after the session, and told me their opinion on the session. That first feedback was better than I could imagine. The rest of the feedback will be send to me later, so hopefully that feedback will be as good as the first feedback I got. This experience convinced me I want to look for the next challenge. A new event, a different audience, and new topic(s).

For all the attendees (and the ones who just want to check out the slides and demos), I shared the resources:

 
Slide deck (pdf)
Slide deck + demos (zip)

 
Thanks again to all attendees, thank you SQL Server User Group Belgium for organizing the session, and thank you Kohera for sponsoring the session!


UPDATE:
The evaluation just came in, and it’s better than I could ever expect!

Question: Fulfilled this evening your technical expectations?
Score: 7.8 / 9

Question: How do you evaluate presentation skills?
Score: 7.56 / 9

Question: How do you evaluate presenters knowledge?
Score: 8.2 / 9

Looking back at 2014, and forward to 2015

The last year was a little bumpy, and had a lot of ups and downs. Looking back at 2014, I accomplished a lot of cool things, and set some things in motion for 2015 already. So what happened for me in 2014?

 
FORG
2014 was the first year I joined the Friends of Red Gate (FORG) program. I was surprised and felt honored, that I got the confirmation in February that I was a part of FORG. Red Gate has always been a company I respected a lot (so much, that some people asked if I had Red Gate stocks, when I mentioned them again in a conversation). The fact that they let me in their program was a huge honor for me. They enabled me to contact the product teams directly, which (hopefully) ended up in us (FORG members and Red Gate developers) improving the tooling this year.

For next year, I’m hoping I can continue working with Red Gate. There are a lot of things I would like to do in cooperation with Red Gate, that I didn’t or couldn’t do this year. Hopefully 2015 will be the year that I can do some of the things I have on my to-do list!

 
SQLCoop
In February of 2014, I started SQLCoop with 3 other people:

Julie Koesmarno (Blog | @MsSQLGirl)
Mickey Stuewe (Blog | @SQLMickey)
Chris Yates (Blog | @YatesSQL)

 
We wrote a total of 8 posts this year, in which we talked about a number of subjects. Hopefully for next year, there will be more posts about various subjects.

 
Blogging
My blogging in 2014 didn’t go exactly as planned. At the end of last year, I set myself a goal: try to blog more often, and try to write a blog post once a week. I really tried to keep up with that pace, but unfortunately I lost that pace early in the year. But I did manage to publish 30 posts this year (including this one). This is one more than last year. So I did reached my goal (blog more than last year), but not as much as I would’ve liked.

 
Blog traffic
The blog traffic increased again, in a way I didn’t expect. Between 2012 and 2013, the traffic to this blog was quadrupled. This was a stunning success, and I didn’t expect any growth for this year. But looking at the statistics right now, I see that the visitors to my blog are more than doubled comparing to last year! I was hoping for a small increase, but not this much! Looking at that, I can only hope I helped a lot of people save time, with the ramblings I call blog posts!

 
Events
This was the year of the great events. In July, I attended SQLBits in Telford, UK. This was a great event, wonderfully organized, and certainly an event everyone needs to visit at least once! People told me this was the biggest and nicest SQL event in Europe, and I can tell you: they weren’t lying! What an event, what an attendees, and what a great job from the organizers!

In October there was SQL Saturday Holland. This year was (again) better than last year, and it was a great event! Also, I got the chance to volunteer at the event. Definitely something I’m doing again next year. It was really great to help the organizers out. It was a wonderful day with great sessions, and it was the moment I got my first speaking opportunity. Nothing but good things happened that day.

 
New friends
This year I’ve also met a number of wonderful people from the community. A lot of them I met at SQLBits this year, but also at SQL Saturday. It was great to meet Matan, Tobiasz, Chris, Julie, Nicky, Pieter, Brent, Kevin, Grant, etc, or talk to them again. Meeting all those people really shows how big and diverse the community is, and it reminds me why I like this community so much. I’m confident I will meet a lot of cool people next year, and catch up with people again after not seeing them for too long.

 
Speaking
This year I started to seriously think about speaking at events and user groups. All the good stories I heard from friends in the community made me consider this. In July during SQLBits, I submitted 3 sessions for SQL Saturday Holland, and that was the first step. I wasn’t surprised that I didn’t get picked. There were a lot of good speakers, and I was a newcomer with no experience. But at SQL Saturday Holland, I met Pieter Vanhove (Blog | @Pieter_Vanhove). We talked about all different kinds of subjects (including speaking), and he invited me to do a session at the SQL Server User Group Belgium in January 2015. This means I’m speaking at my first ever User Group session. Hopefully this will be the start of something good, with which I can give back to the community in time.

 
I want to with you all a very happy, successful and interesting new year! Go and try to make 2015 your year, and take that leap of faith when you have the chance! I know I did! 🙂

Design a site like this with WordPress.com
Get started