It’s common to have multiple Claude sessions open at once, a few git worktrees or clones checked out side by side, and several Simulator windows on screen as a natural consequence of juggling multiple work streams.
One window might be running a quick bug fix, another might be testing a refactor, and a third might be a clean build from main. Once you start working that way, the Simulator stops being self-explanatory.
SimTag exists to solve exactly that problem.
SimTag is a macOS menu bar app that figures out which git branch produced the app currently running in each Simulator window, then renders that branch as a small persistent overlay on top of the window.
The goal is simple: remove the guesswork - no more staring at a Simulator and wondering which build you are looking at.

What sounded like a small utility turned into a much deeper problem than I expected.
To answer a seemingly simple question like "what branch is this app from?", SimTag has to answer a chain of smaller questions. This post walks through the implementation step by step, with the real data structures and intermediate outputs along the way.
The Pipeline
Every ~250ms, SimTag runs a pipeline that looks like this:
- Distinguish Simulator windows from all other open macOS windows
- Match Simulator windows to simulator UDIDs (e.g.
simctl) - Find the most recently installed app on each Simulator
- Hash the binary in the Simulator, match it to a
DerivedDatabuild, and recover the project directory - Read the git branch from that project directory
- Detect whether the build is stale
- Position an overlay badge on the Simulator
We'll go through these steps in more detail, but at a high level, data flows through the system like this:
┌──────────┐    ┌──────────┐    ┌──────────┐    ┌─────────────┐
│ macOS    │    │ simctl   │    │ Simulator│    │ DerivedData │
│ Window   │    │ (booted  │    │ device   │    │ + git repo  │
│ APIs     │    │ devices) │    │ sandbox  │    │             │
└────┬─────┘    └────┬─────┘    └────┬─────┘    └──────┬──────┘
     │               │              │                  │
     ▼               ▼              │                  │
  Window IDs      UDIDs +           │                  │
  + frames        device names      │                  │
     │               │              │                  │
     └───────┬───────┘              │                  │
             │                      │                  │
             ▼                      ▼                  │
      Match window ──────────► Find app                │
      to UDID                  binary                  │
                                 │                     │
                                 ▼                     ▼
                              MD5 hash ──────────► Match hash
                                                   to project
                                                       │
                                                       ▼
                                                  Read branch
                                                  + staleness
                                                       │
                                                       ▼
                                                  Position
                                                  overlay
Step 1: Finding Simulator Windows
The first question SimTag has to answer is: which Simulator windows are actually on screen right now?
This is where CGWindowListCopyWindowInfo comes in. It's the macOS API that gives you the current on-screen window list, including window IDs, owners, bounds, z-order, and, if permission is granted, titles.
In other words, this is the raw desktop snapshot and includes every visible app window - not just Simulator windows. Those window IDs matter later because they let SimTag track position changes, z-order, and occlusions of windows over time.
This API requires Screen Recording permission to read window titles. Without it, the window names would come back as nil.
let windowList = CGWindowListCopyWindowInfo(
    [.optionOnScreenOnly, .excludeDesktopElements],
    kCGNullWindowID
) as? [[String: Any]] ?? []
Each entry is a dictionary that looks like this:
─── CGWindowListCopyWindowInfo ───────────────────────────
kCGWindowNumber:    5847
kCGWindowOwnerName: "Simulator"
kCGWindowOwnerPID:  41592
kCGWindowName:      "iPhone 16 Pro"
kCGWindowLayer:     0
kCGWindowAlpha:     1.0
kCGWindowBounds: {
    X:      306.0
    Y:      134.0
    Width:  404.0
    Height: 883.0
}
──────────────────────────────────────────────────────────
This gives SimTag enough information to do an initial filter on the windowList:
kCGWindowOwnerName == "Simulator"so we only keep Simulator windowskCGWindowLayer == 0so we skip menu bar and HUD-style elementskCGWindowAlpha >= 0.1so we ignore nearly invisible helper windowsWidth > 200 && Height > 200so we ignore accessory panels and tiny utility windows
That sounds straightforward, but it's also where the first real problem appears.
The Missing iOS Version
CGWindowList tells us the window title is "iPhone 16 Pro". That's fine until there are two iPhone 16 Pro simulators open on different runtimes (e.g. iOS 17 vs iOS 18). At that point, the title is no longer specific enough to identify the window.
To disambiguate those windows, SimTag also queries the Accessibility framework through AXUIElement.
This API plays a different role in the lookup chain: it gives richer UI metadata for the same windows, including the full title with the runtime version attached.
This requires Accessibility permission, which is separate from the Screen Recording permission needed earlier for CGWindowList.
let axApp = AXUIElementCreateApplication(simulatorPID)
var windowsRef: CFTypeRef?
AXUIElementCopyAttributeValue(axApp, kAXWindowsAttribute as CFString, &windowsRef)

for axWindow in (windowsRef as? [AXUIElement]) ?? [] {
    var titleRef: CFTypeRef?
    AXUIElementCopyAttributeValue(axWindow, kAXTitleAttribute as CFString, &titleRef)
    // titleRef → "iPhone 16 Pro - iOS 18.5"
}
Looking at the two APIs side by side makes the tradeoff clear:
─── CGWindowList ─────────────────────
Title: "iPhone 16 Pro"
Frame: (306, 134, 404, 883)
ID:    5847

─── AXUIElement ──────────────────────
Title: "iPhone 16 Pro - iOS 18.5"
Frame: (306.0, 134.0, 404.0, 883.0)
ID:    (not available)
CGWindowList gives us the CGWindowID, which we need later. AXUIElement gives us the fully qualified title, which we also need later. Neither API gives both.
The key observation is that both APIs report the same frame rectangle for the same window. That means the frame can act as a join key:
// From AXUIElement pass: build frame → full title map
var axTitlesByFrame: [String: String] = [:]

for axWindow in axWindows {
    var posRef: CFTypeRef?, sizeRef: CFTypeRef?
    AXUIElementCopyAttributeValue(axWindow, kAXPositionAttribute as CFString, &posRef)
    AXUIElementCopyAttributeValue(axWindow, kAXSizeAttribute as CFString, &sizeRef)

    var pos = CGPoint.zero, size = CGSize.zero
    AXValueGetValue(posRef as! AXValue, .cgPoint, &pos)
    AXValueGetValue(sizeRef as! AXValue, .cgSize, &size)

    let frameKey = "\(Int(pos.x)),\(Int(pos.y)),\(Int(size.width)),\(Int(size.height))"

    var titleRef: CFTypeRef?
    AXUIElementCopyAttributeValue(axWindow, kAXTitleAttribute as CFString, &titleRef)
    axTitlesByFrame[frameKey] = titleRef as? String
}
─── axTitlesByFrame ──────────────────────────────────────
"306,134,404,883" → "iPhone 16 Pro - iOS 18.5"
"812,98,1024,1406" → "iPad Pro 13-inch (M4) - iOS 18.5"
──────────────────────────────────────────────────────────
Then, when processing CGWindowList, SimTag looks up the enriched title by frame:
let cgFrame = windowInfo[kCGWindowBounds as String] as! [String: CGFloat]
let frameKey = "\(Int(cgFrame["X"]!)),\(Int(cgFrame["Y"]!)),\(Int(cgFrame["Width"]!)),\(Int(cgFrame["Height"]!))"
let fullTitle = axTitlesByFrame[frameKey] ?? cgTitle
Now the tracking layer has window IDs and full titles in the same structure:
─── trackedWindows ───────────────────────────────────────
[0] windowID: 5847
    title:    "iPhone 16 Pro - iOS 18.5"
    frame:    (306, 134, 404, 883)
    ownerPID: 41592
    isSimulatorFrontmost: true
    isDragging:  false
    isOccluded:  false
    simulatorUDID: nil      ← TODO

[1] windowID: 5902
    title:    "iPad Pro 13-inch (M4) - iOS 18.5"
    frame:    (812, 98, 1024, 1406)
    ownerPID: 41592         ← same PID, different window
    isSimulatorFrontmost: true
    isDragging:  false
    isOccluded:  false
    simulatorUDID: nil      ← TODO
──────────────────────────────────────────────────────────
At this point SimTag knows which Simulator windows exist, but it still needs to map each one to a specific booted simulator device. That device mapping is what lets SimTag move from window metadata to the simulator's filesystem, where the installed app binary can actually be identified.
Step 2: Matching Windows to Simulator UDIDs
So, to reiterate, the next question is: which booted simulator device does each window represent?
This is where simctl becomes the source of truth. simctl is Xcode's command-line interface to CoreSimulator, the subsystem that manages simulator devices, runtimes, and their on-disk data.
Running it through xcrun matters because xcrun resolves the copy of the tool that belongs to the currently selected Xcode installation.
So when SimTag runs xcrun simctl list devices booted -j, what it gets back is the list of currently booted simulator devices, along with each device's UDID, runtime, and sandbox data path.
That matters because the rest of the pipeline is keyed off the UDID, which is the stable identifier for a specific simulator device. Once SimTag knows the UDID for a Simulator window, it can look inside that simulator's filesystem, find installed apps, and start tracing the binary back to the original build.
$ xcrun simctl list devices booted -j
{
  "devices": {
    "com.apple.CoreSimulator.SimRuntime.iOS-18-5": [
      {
        "state": "Booted",
        "name": "iPhone 16 Pro",
        "udid": "B3F4E2A1-7C89-4D56-A123-9E8F7B6C5D4A",
        "isAvailable": true,
        "dataPath": "/Users/aryaman/Library/Developer/CoreSimulator/Devices/B3F4E2A1-.../data"
      },
      {
        "state": "Booted",
        "name": "iPad Pro 13-inch (M4)",
        "udid": "F7A1B2C3-D456-E789-F012-3A4B5C6D7E8F",
        "isAvailable": true,
        "dataPath": "..."
      }
    ]
  }
}
The JSON is keyed by runtime identifier, so SimTag parses the version back out:
"com.apple.CoreSimulator.SimRuntime.iOS-18-5"
  → split by "."    → last component: "iOS-18-5"
  → split by "-"    → ["iOS", "18", "5"]
  → platform = first element: "iOS"
  → version  = remaining elements joined by ".": "18.5"
  → result   = "iOS 18.5"
That becomes a computed displayIdentifier for each device:
─── simulatorDevices ─────────────────────────────────────
[0] udid:              "B3F4E2A1-7C89-4D56-A123-9E8F7B6C5D4A"
    name:              "iPhone 16 Pro"
    runtimeVersion:    "iOS 18.5"
    displayIdentifier: "iPhone 16 Pro - iOS 18.5"

[1] udid:              "F7A1B2C3-D456-E789-F012-3A4B5C6D7E8F"
    name:              "iPad Pro 13-inch (M4)"
    runtimeVersion:    "iOS 18.5"
    displayIdentifier: "iPad Pro 13-inch (M4) - iOS 18.5"
──────────────────────────────────────────────────────────
Now the matching step becomes a string comparison between the enriched window title and each simulator device's display identifier:
Window:    "iPhone 16 Pro - iOS 18.5"
  vs
Device[0]: "iPhone 16 Pro - iOS 18.5"   ← match → UDID: B3F4E2A1...
Device[1]: "iPad Pro 13-inch (M4) - iOS 18.5"  ← no match
The Accessibility API uses an en-dash in the window title, while the simctl-derived identifier uses a plain hyphen. Those strings look almost identical, but == still fails. This subtle bug took longer to find than it should have....
SimTag normalizes both en-dash and em-dash characters to a plain hyphen before matching:
let normalized = title.replacingOccurrences(of: "\u{2013}", with: "-")
                      .replacingOccurrences(of: "\u{2014}", with: "-")
// "iPhone 16 Pro - iOS 18.5" ✓
After that pass, each TrackedWindow gets its simulatorUDID:
─── trackedWindows (after UDID matching) ─────────────────
[0] windowID: 5847
    title:         "iPhone 16 Pro - iOS 18.5"
    simulatorUDID: "B3F4E2A1-7C89-4D56-A123-9E8F7B6C5D4A"  ← matched!

[1] windowID: 5902
    title:         "iPad Pro 13-inch (M4) - iOS 18.5"
    simulatorUDID: "F7A1B2C3-D456-E789-F012-3A4B5C6D7E8F"  ← matched!
──────────────────────────────────────────────────────────
At this point, SimTag has connected each visible Simulator window to a specific booted device UDID, which means it now knows both where the window is on screen and which simulator filesystem it belongs to, but it still hasn't identified the app bundle, binary, DerivedData build, or git branch behind it.
Step 3: Finding the Installed App
Once SimTag has the UDID, it can stop reasoning about windows and start reasoning about the simulator's filesystem.
This is another place where a little under-the-hood context helps. Each booted simulator is really just a directory tree on disk managed by CoreSimulator. When you run an app from Xcode, that app bundle gets copied into the simulator's own sandbox. So once SimTag knows which simulator device it is dealing with, it can inspect that sandbox like any other filesystem.
In other words, every simulator device has its own data directory under CoreSimulator - installed app bundles live in a well-known location inside that sandbox:
~/Library/Developer/CoreSimulator/Devices/<UDID>/data/Containers/Bundle/Application/
Inside that directory, each installed app sits in a UUID-named container. Those folder names are just installation containers. They are not the simulator's UDID, and they are not directly useful on their own except as the place where the copied app bundle lives:
─── ls ~/Library/.../B3F4E2A1.../Containers/Bundle/Application/ ──
4A2B8F91-C3D4-5E6F-7890-1A2B3C4D5E6F/
  └── MyApp.app/
        ├── MyApp              ← the executable
        ├── Info.plist
        ├── Assets.car
        └── ...
7B8C9D0E-F1A2-3B4C-5D6E-7F8091A2B3C4/
  └── WidgetExtension.appex/
        └── ...
SimTag picks the most recently modified .app bundle, which is usually the app the developer most recently built and ran.
From there, it reads CFBundleExecutable out of the app's Info.plist to find the binary name, then hashes the executable with /sbin/md5:
─── Simulator app binary ────────────────────────────────
Path:       .../4A2B8F91.../MyApp.app/MyApp
Executable: MyApp
Size:       14.2 MB
Modified:   2026-03-03 14:28:00
MD5:        a7f3b2c1d4e5f6a7b8c9d0e1f2a3b4c5
──────────────────────────────────────────────────────────
That hash becomes the fingerprint SimTag uses to search Xcode's build output. At this point, SimTag still doesn't know which project produced the app. It just has a concrete binary fingerprint it can use to look for the matching build artifact in DerivedData.
Why Not Mach-O UUIDs?
My first version used dwarfdump --uuid to read the Mach-O UUID from the binary header. That felt like the obvious solution. Mach-O UUIDs exist specifically to identify a build.
But this broke in exactly the workflow SimTag was meant to support.
With git worktrees, identical source compiled from different working directories can produce binaries with the same Mach-O UUID. The UUID is tied to compilation inputs, not to the fact that the build happened in a different worktree or at a different path.
For SimTag, that is not good enough. If two worktrees can produce binaries that look identical at the UUID level, then the branch lookup becomes ambiguous.
Hashing the entire executable works better here. Even when the source is the same, the actual binary bytes often differ because the compiler embeds build-specific details such as absolute source paths in debug info, __FILE__ references, timestamps, and other metadata. In practice, the full MD5 hash distinguishes builds more reliably than Mach-O UUIDs does.
Step 4: Matching the Hash to DerivedData
At this point SimTag knows which binary is running in the simulator. The next question is what project that binary came from.
This is the job of DerivedData. If you have not spent much time in there, DerivedData is Xcode's scratch space. It stores build products, intermediates, indexes, logs, and metadata for the projects and workspaces you build locally. So if SimTag can find the matching build (same hash) product there, it can work backwards to the original workspace or project directory.
The default search path is ~/Library/Developer/Xcode/DerivedData, but users can also add custom search paths, which matters in worktree-heavy setups or nonstandard Xcode configurations.
This step is easier to follow if you think of it as two separate phases:
- Build an index by scanning
DerivedData, hashing every simulator build product, and remembering which project directory each hash came from. - Take the
MD5from the app currently installed in the Simulator and look it up in that index.
In other words, SimTag is not searching all of DerivedData from scratch every time it needs to identify a running app. It periodically precomputes a lookup table, then uses the live simulator binary hash as the key into that table.
Here is that flow as a sequence:
[Phase 1: Build the index]

DerivedData scanner
  -> find candidate DerivedData folders
  -> read each folder's info.plist
  -> extract WorkspacePath
  -> scan Build/Products/*-iphonesimulator
  -> hash each executable it finds (MD5)
  -> store:
       executable hash -> projectDir + buildTime

[Phase 2: Query the index]

Running app in Simulator
  -> compute MD5 of installed executable
  -> look up that MD5 in the hash index
  -> get back:
       projectDir + buildTime
The directory walk below is what builds that index. The cache dump after it is what the finished lookup table looks like once that scan is complete.
─── DerivedData scan ─────────────────────────────────────
Search path: ~/Library/Developer/Xcode/DerivedData/
Scanning...

Found: MyApp-abc123def456/
  info.plist → WorkspacePath: "/Users/aryaman/Projects/MyApp/MyApp.xcworkspace"
  Scanning Build/Products/*-iphonesimulator/...
    Debug-iphonesimulator/MyApp.app/MyApp
      → hash: a7f3b2c1d4e5f6a7b8c9d0e1f2a3b4c5
      → buildTime: 2026-03-03 14:28:00
    Release Internal-iphonesimulator/MyApp.app/MyApp
      → hash: b8d4e2f1a3c5d6e7f8a9b0c1d2e3f4a5
      → buildTime: 2026-03-02 22:10:00

Found: OtherProject-xyz789/
  info.plist → WorkspacePath: "/Users/aryaman/Projects/Other/Other.xcodeproj"
  Scanning Build/Products/*-iphonesimulator/...
    Debug-iphonesimulator/Other.app/Other
      → hash: e1d2c3b4a5f6e7d8c9b0a1f2e3d4c5b6
      → buildTime: 2026-03-03 09:15:00

Indexed 3 builds from 24 DerivedData folders.
──────────────────────────────────────────────────────────
The resulting cache is a hash-to-project mapping:
─── hashToProjectCache ───────────────────────────────────
"a7f3b2c1d4e5f6a7b8c9d0e1f2a3b4c5"
  → projectDir: "/Users/aryaman/Projects/MyApp"
    buildTime:  2026-03-03 14:28:00

"e1d2c3b4a5f6e7d8c9b0a1f2e3d4c5b6"
  → projectDir: "/Users/aryaman/Projects/Other"
    buildTime:  2026-03-03 09:15:00
──────────────────────────────────────────────────────────
Now the lookup becomes straightforward. The MD5 hash we computed from the app currently installed in the Simulator matches a cached build product in DerivedData.
Once that match is found, the WorkspacePath in the DerivedData folder's info.plist tells SimTag which .xcworkspace or .xcodeproj produced the binary, and the parent directory of that path becomes the project directory used for the git lookup in the next step.
One detail that turned out to matter here is build configuration names. Xcode doesn't stop at Debug and Release. Plenty of projects use configurations like Release Internal, Staging, or Beta, each of which gets its own directory under Build/Products/.
So SimTag does not hardcode configuration names. It discovers them dynamically by scanning for anything that ends with -iphonesimulator:
let allConfigs = (try? fm.contentsOfDirectory(atPath: buildProductsPath))?
    .filter { $0.hasSuffix("-iphonesimulator") } ?? []
for config in allConfigs {
    // scan each configuration's .app bundles...
}
This cache is rebuilt every 10 seconds because DerivedData changes continuously while Xcode is building. Periodically refreshing the index lets SimTag discover new simulator binaries and keep the hash lookup accurate without requiring an app restart.
At this point, SimTag has gone from a live app binary back to the project directory that produced it.
Step 5: Reading the Git Branch
At this point, DerivedData has done its job. We no longer need build metadata. We have a real project path on disk, which means the next step is just a git lookup.
In the normal case, this is straightforward. Git stores the current branch reference in .git/HEAD:
─── cat /Users/aryaman/Projects/MyApp/.git/HEAD ──────────
ref: refs/heads/feature/new-onboarding
──────────────────────────────────────────────────────────
Everything after ref: refs/heads/ is the branch name.
The Worktree Wrinkle
If the project is a git worktree, the lookup is a little more involved because the working directory doesn't store git metadata in quite the same way. SimTag has to resolve that indirection first, then read the branch from the correct location.
The important part is that the result is the same: once the repository metadata is resolved, SimTag can still determine the active branch and continue the pipeline normally.
Getting the Commit Hash
To show a short commit hash alongside the branch name, SimTag also reads the ref file itself. This is a separate lookup from reading .git/HEAD.
HEAD tells us which branch is active, while the ref file tells us which commit that branch currently points to.
─── cat .git/refs/heads/feature/new-onboarding ───────────
c9d0e1f2a3b4c5e6d7f8a9b0c1d2e3f4a5b6c7d8
──────────────────────────────────────────────────────────

Short hash: c9d0e1f
Knowing the branch name is progress, but it still leaves some ambiguity: is the app currently on screen actually up to date with that branch?
Step 6: Staleness Detection
Knowing the branch is useful. Knowing whether the build is out of date is often even more useful.
A branch label alone is not enough to tell you whether the app on screen actually reflects the current state of the project. You may have edited code after the last build, or even switched branches after launching the app in the Simulator. In both cases, the branch label may still be technically correct, but it is no longer telling the full story. So SimTag also asks: has the source changed since Xcode last built this app?
The answer comes from comparing three timestamps.
The Three Timestamps
build.db lives under DerivedData at Build/Intermediates.noindex/XCBuildData/build.db. This is Xcode's build system database. It records build graph state, commands, dependencies, and outputs, and Xcode touches it whenever it performs a build, including incremental ones. In practice, this timestamp is a good approximation of "when did Xcode last build this project?"
.git/index is git's staging area. Its modification time changes on a surprising number of working tree operations: git add, git checkout, git merge, git stash, git rebase, and more. It is a coarse signal that something in the working copy changed.
.git/refs/heads/<branch> changes only when the branch tip itself moves, for example after git commit, git merge, git pull, or git cherry-pick.
Those files move at different granularities. build.db tells us when Xcode last built. .git/index tells us the working tree changed somehow. The branch ref tells us whether a commit happened. Comparing all three gives SimTag a more useful answer than any two-file comparison can.
─── Staleness timestamps ─────────────────────────────────
build.db:    .../DerivedData/MyApp-abc123/Build/Intermediates.noindex/XCBuildData/build.db
             → modTime: 2026-03-03 14:28:00

.git/index:  /Users/aryaman/Projects/MyApp/.git/index
             → modTime: 2026-03-03 14:28:00

refs/heads/: /Users/aryaman/Projects/MyApp/.git/refs/heads/feature/new-onboarding
             → modTime: 2026-03-03 14:25:00
──────────────────────────────────────────────────────────
If the build timestamp is at least as new as the index timestamp, SimTag treats the build as current:
build.db (14:28) >= .git/index (14:28)?
  → YES → .fresh ✅  "Build is up-to-date"
Now watch what happens after you edit a file and stage it:
─── After editing + git add ──────────────────────────────
build.db:    2026-03-03 14:28:00
.git/index:  2026-03-03 14:35:00   ← newer!
refs/heads/: 2026-03-03 14:25:00   ← hasn't moved

build.db (14:28) >= .git/index (14:35)?
  → NO → index changed
refs/heads (14:25) > build.db (14:28)?
  → NO → no new commit
  → .stale ⚠️  "Pending Build"
──────────────────────────────────────────────────────────
And after a commit:
─── After git commit ─────────────────────────────────────
build.db:    2026-03-03 14:28:00
.git/index:  2026-03-03 14:40:00
refs/heads/: 2026-03-03 14:40:00   ← moved forward

build.db (14:28) >= .git/index (14:40)?
  → NO → index changed
refs/heads (14:40) > build.db (14:28)?
  → YES → a commit happened after the build
  → .possiblyStale 🟡  "Build May Be Stale"
──────────────────────────────────────────────────────────
Here is the decision tree as a flowchart:
        ┌───────────────────────────┐
        │     Read 3 timestamps     │
        │  build.db  .git/index     │
        │  .git/refs/heads/<branch> │
        └─────────────┬─────────────┘
                      │
        ┌─────────────▼─────────────┐
        │    build.db >= index?     │
        └──────┬─────────────┬──────┘
            YES│             │NO
               ▼             ▼
        ┌────────────┐ ┌─────────────────┐
        │   .fresh   │ │ Detached HEAD?  │
        └────────────┘ └──┬──────────┬───┘
                       YES│          │NO
                          ▼          ▼
           ┌────────────────┐ ┌──────────────────┐
           │ .possiblyStale │ │ ref > build.db?  │
           └────────────────┘ └──┬───────────┬───┘
                              YES│           │NO
                                 ▼           ▼
                  ┌────────────────┐ ┌────────────┐
                  │ .possiblyStale │ │   .stale   │
                  └────────────────┘ └────────────┘
The distinction matters:
.stalemeans code definitely changed after the last build.possiblyStalemeans a commit happened after the build, but that does not guarantee the running target is actually outdated.freshmeans the build is at least as new as the working tree signals SimTag can observe
enum BuildStaleness {
    case fresh          // build.db >= index
    case stale          // index > build.db, but no new commit
    case possiblyStale  // both index and ref moved past build.db
}
Why Three Timestamps Instead of Two?
Early versions of SimTag only compared build.db and .git/index. That worked, but it didn't explain why the index moved.
Did the developer change source and stage it? Or did a commit land, which also updates both the index and the branch ref? Those cases should not produce the same warning.
That difference is mostly about user trust. If SimTag says "Pending Build," that should mean something concrete. The third timestamp makes the warning more honest.
Once SimTag has both pieces, branch identity and build freshness, it has everything it needs for the badge content itself. The last remaining job is purely visual: keep that badge aligned with the correct Simulator window.
Step 7: Positioning the Overlay
By this point, SimTag has solved the data problem. The final problem is UI: how do you make that information feel attached to a moving Simulator window in a way that looks stable and native?
The key detail is that SimTag isn't actually rendering inside Simulator.app. There is no API that lets you embed a SwiftUI view into another app's window. Instead, SimTag creates its own borderless NSWindow, presents it like any normal macOS app would, and continuously repositions that window so it appears visually attached to the matching Simulator window.
CGWindowList and AXUIElement make that possible by giving SimTag the title, frame, and movement of the target window. Once that information is available, the badge itself is just another floating macOS window that SimTag controls:
let overlay = NSWindow(
    contentRect: .zero,
    styleMask: .borderless,
    backing: .buffered,
    defer: false
)
overlay.isOpaque = false
overlay.backgroundColor = .clear
overlay.level = .floating + 1
overlay.collectionBehavior = [.canJoinAllSpaces, .fullScreenAuxiliary, .stationary]
overlay.contentView = NSHostingView(rootView: OverlayBadgeView(...))
The difficult part is making that separate window feel like it belongs to the Simulator window underneath it, which means computing the correct frame every time the target window moves.
CGWindowList reports window frames in CoreGraphics coordinates, where the origin is at the top-left of the primary display and Y increases downward. NSWindow positioning uses AppKit coordinates, where the origin is at the bottom-left and Y increases upward.
That means every overlay placement requires a coordinate transform:
─── Coordinate conversion ────────────────────────────────
Primary screen height: 1080

Simulator window (CG coords):
  origin: (306, 134)    ← top-left origin
  size:   (404, 883)

Convert to NS coords:
  nsY = screenHeight - cgY - cgHeight
      = 1080 - 134 - 883
      = 63

Simulator window (NS coords):
  origin: (306, 63)     ← bottom-left origin
  size:   (404, 883)

Overlay badge size: (280, 24)
Position: topCenter
  overlayX = simX + simWidth/2 - badgeWidth/2
           = 306 + 202 - 140
           = 368
  overlayY = nsSimY + simHeight + margin
           = 63 + 883 + 4
           = 950

Final overlay frame (NS): (368, 950, 280, 24)
──────────────────────────────────────────────────────────
One critical lesson here: always use NSScreen.screens.first for the screen height, not NSScreen.main.
NSScreen.main follows keyboard focus, so on a multi-monitor setup it changes when you click between displays. If you use that for coordinate conversion, overlays jump to the wrong place. NSScreen.screens.first remains tied to the primary display and stays stable.
Adaptive Polling
The overlay also has to move when the Simulator window moves. That raises a practical question: how often should SimTag poll window state?
Polling at 60fps works, but wastes CPU. Polling once a second keeps CPU low, but makes dragging look bad. The compromise is adaptive polling based on mouse state:
─── Polling state transitions ────────────────────────────
[Normal mode]  4Hz (250ms interval)
  └─ Mouse down on Simulator.app window
     └─ [Fast mode]  20Hz (50ms interval)
        └─ Mouse up + 100ms delay
           └─ [Normal mode]  4Hz
──────────────────────────────────────────────────────────
The normal 4Hz loop is not just for drag tracking. It is the background heartbeat that catches everything else that changes without a mouse event:
- the user switches back to Simulator with Cmd+Tab
- another app uncovers or occludes a Simulator window
- a Simulator window closes
- the user changes Spaces and the visible window set changes entirely
SimTag uses NSEvent.addGlobalMonitorForEvents to detect system-wide mouse events and temporarily raise the poll rate while a drag is likely in progress:
NSEvent.addGlobalMonitorForEvents(matching: .leftMouseDown) { [weak self] _ in
    let frontmost = NSWorkspace.shared.frontmostApplication?.bundleIdentifier
    if frontmost == "com.apple.iphonesimulator" {
        self?.startPolling(fast: true)  // 20Hz
    }
}

NSEvent.addGlobalMonitorForEvents(matching: .leftMouseUp) { [weak self] _ in
    if self?.isInFastPollingMode == true {
        DispatchQueue.main.asyncAfter(deadline: .now() + 0.1) {
            self?.startPolling(fast: false)  // Back to 4Hz
        }
    }
}
There is also a cheap signature-based optimization. On each poll, SimTag computes a string signature from:
- Simulator window IDs
- frame rectangles
- z-order indices
- the current frontmost app bundle identifier
If the signature has not changed since the last poll, SimTag skips the expensive overlay update work entirely. In the common case, where Simulator windows are sitting still while you write code, the polling loop is almost free.
Putting It All Together
Once the whole pipeline runs, the system has enough information to produce a final per-window result like this:
─── Pipeline result ──────────────────────────────────────
Window #5847: "iPhone 16 Pro - iOS 18.5"
  ├── frame:      (306, 134, 404, 883)
  ├── udid:       B3F4E2A1-7C89-4D56-A123-9E8F7B6C5D4A
  ├── app:        MyApp.app (hash: a7f3b2c1...)
  ├── project:    /Users/aryaman/Projects/MyApp
  ├── branch:     feature/new-onboarding
  ├── commit:     c9d0e1f
  ├── buildAge:   2m ago
  ├── staleness:  .fresh ✅
  └── overlay:    visible @ (368, 950, 280, 24)
──────────────────────────────────────────────────────────
One subtle but important point to reiterate is that none of this ends with SimTag "attaching" a view to Simulator.app. What it actually does is much simpler and much more macOS-native: it presents its own small borderless windows, then uses the polled window metadata to keep those windows aligned with the corresponding Simulator windows as they move around the screen.
In practice, the final handoff looks something like this:
for trackedWindow in trackedWindows {
    guard let udid = trackedWindow.simulatorUDID else { continue }

    // Hide the badge while the target window is moving or mostly covered.
    if trackedWindow.isDragging || trackedWindow.isOccluded {
        overlaysByWindowID[trackedWindow.windowID]?.orderOut(nil)
        continue
    }

    let branchInfo = branchDetector.branchInfo(forUDID: udid)
    let frame = overlayFrame(for: trackedWindow.frame, badgeSize: badgeSize)

    let overlay = overlaysByWindowID[trackedWindow.windowID] ?? makeOverlayWindow()
    overlay.contentView = NSHostingView(
        rootView: OverlayBadgeView(branchInfo: branchInfo)
    )
    overlay.setFrame(frame, display: true)
    overlay.orderFront(nil)

    overlaysByWindowID[trackedWindow.windowID] = overlay
}
That's the full connection point between the earlier stages:
trackedWindowscomes fromCGWindowListandAXUIElementsimulatorUDIDlinks the visible window to a specific booted simulatorbranchInfo(forUDID:)provides the branch, commit, build age, and staleness state derived from the app binary andDerivedDatamatchoverlayFrame(for:)converts the Simulator's frame into the correct position for SimTag's own overlay window
From there, the effect is mostly persistence. SimTag keeps polling, keeps recomputing frames, and keeps moving its own windows so the badges appear to trail the Simulator windows in real time.
The badge shows the branch name, short commit hash, build age, and, when relevant, a staleness warning. You can click to copy the branch name or right-click to add a custom label.
Branch prefixes also get distinct SF Symbol icons and colors:
task/*                            → number                          (mint)
feature/* or feat/*               → sparkles                       (blue)
hotfix/*, fix/*, bugfix/*, bug/*  → ant.fill                       (red)
release/*                         → shippingbox.fill               (purple)
main/master                       → arrow.triangle.branch          (green)
develop/dev                       → arrow.triangle.branch          (cyan)
detached HEAD                     → exclamationmark.triangle.fill  (orange)
other                             → arrow.triangle.branch          (white)
Things That Broke Along the Way
A non-exhaustive list of issues that surfaced while building this:
The dash normalization bug. The Accessibility API returns titles with an en-dash, not a plain hyphen. SimTag now normalizes both en-dash and em-dash characters before comparing.
Multi-monitor coordinate conversion. Using NSScreen.main made overlays jump between monitors because .main follows focus.
All Simulator windows share one PID. processIdentifier is useless for distinguishing devices because every window belongs to the single Simulator.app process.
Mach-O UUID collisions across worktrees. That approach looked correct and still failed in the exact workflow the tool was built for.
.git/index changes more often than expected. Checkout, merge, rebase, stash, and add all touch it. The staleness heuristic needed three timestamps to become trustworthy.
Occlusion math. SimTag hides overlays when another window covers more than 70% of the Simulator window, but it has to exclude its own overlay windows and other Simulator windows from that calculation. Otherwise the app would treat the system it is observing as an occluder.
Custom build configurations. Scanning only Debug-iphonesimulator and Release-iphonesimulator missed real builds in configurations like Release Internal. The fix was to discover all *-iphonesimulator directories dynamically.
Space changes. During macOS Space transitions, CGWindowListCopyWindowInfo can briefly return stale data. SimTag listens for NSWorkspace.activeSpaceDidChangeNotification, clears tracked windows immediately, then re-polls after a short delay to avoid ghost badges.
This was one of those projects where each solved problem exposed the next layer underneath it. By the end, something that started as "show me the branch on the Simulator window" had turned into a pipeline across macOS window APIs, Accessibility, CoreSimulator, Xcode build artifacts, and git internals.
Try SimTag
This whole project started from a simple frustration: moving fast with agentic coding and losing track of what was actually running in the Simulator. SimTag turns that into something visible, persistent, and immediate.
If that'd be useful in your workflow, you can get it here.

All future updates are included.
]]>I've been a professional iOS developer for about 10 years. I've shipped apps at companies, contributed to open source, and built plenty of side projects the traditional way.
At work, I use Claude with guardrails - code review, tests, careful commits. But for indie projects, where code quality matters less and the goal is simply validating an idea and shipping something I'd actually use, I wanted to try the opposite: a fully hands-off approach where AI drives the entire process while I observe how my workflow and instincts change.
The question wasn't whether vibe coding could handle a hard problem. It was simpler: how fast can I go from idea to the App Store when I stop writing code entirely and just give in to the vibe.
The project: a daily word puzzle game called UnJumbl, built for both iOS and Web. My girlfriend and I play the NYT games every day, so I knew I'd actually use this. The core mechanic is simple (unscramble letters, find words) - the project itself isn't particularly complex. There are a few genuinely interesting technical problems — consistent hashing algorithms between iOS and Web so both platforms deterministically select the same puzzle each day, local persistence and caching strategies, advanced animations — but nothing that should stump a seasoned developer or, in theory, AI.
I did almost no upfront planning. I started with a single sentence describing the idea, bounced it between Claude and ChatGPT to generate a rough requirements doc, and then handed it back to Claude to implement without even reading through it myself.
I gave zero design guidance — no fonts, no color schemes, no mockups of what the gameplay view should look like. All of that emerged from the dialogue between ChatGPT and Claude as they handed the evolving requirements back and forth. I wanted to see how far it could get on its own with minimal hand-holding.
24 hours later, the Web version was deployed and the iOS app was in review.
What I Built
UnJumbl gives you 6 scrambled letters each day and you find all the valid 3-to-6-letter English words hiding in them. Same puzzle for everyone, every day. There's streak tracking, a GitHub-style contribution heatmap, a share card, and a reward system where you get 3 free reveals per puzzle with more available via rewarded ads.

Both platforms were built within the same 24-hour window. The Web version went live immediately, while the iOS app landed on the App Store a few days later after clearing review.
The Tech Stack
iOS: SwiftUI, MVVM, Google AdMob, Firebase Analytics, Lottie
Web: Next.js 16, TypeScript, Tailwind CSS, Google AdSense, GA4, Lottie
Both platforms share the same word dictionary and use identical puzzle generation logic. There's a server for hosting the website, but there's no database, no API, and no backend logic. All the game logic runs on the user's device.
How the Vibe Coding Workflow Played Out
The workflow was almost entirely hands-off. I used a Ralph loop — an automated feedback cycle where Claude writes code, builds, encounters errors, and fixes them on its own without me intervening. I passed in the Markdown requirements doc and set the iteration count to 3. What came out the other side was a perfectly playable game. Shippable even.
From there, I had a few minor iterations to lock down font sizes and animation timings, but these were trivial corrections. The core gameplay, the UI, the state management — all of it landed in that first automated pass.
What went fast:
- Setting up the project structure and boilerplate: ad integration, analytics, privacy prompts. The kind of work that is well documented but tedious to wire up manually.
- Porting the game logic from the iOS app to the website. When it came time to build the Web version, I could basically say, “Here’s how this works on iOS. Do the same thing for the Web matching it 1:1.” Claude produced a working version in its first iteration.
- All the behind-the-scenes Web details: metadata that makes links look good when shared on social media, a sitemap so Google can discover the pages, privacy manifests, and other peripheral pieces you normally have to remember to add.
What didn’t go fast:
- Anything involving timing and race conditions. The auto-submit feature (valid words submit themselves after a short delay) had edge cases that Claude kept cycling on. Tapping letters quickly could trigger a submit before you were done spelling. It kept generating solutions that looked right but had subtle sequencing bugs, and it took several rounds of prompting before Claude converged on a fix.
- Ad integration was painful. Rewarded ads specifically. The flow of "load ad, show ad, wait for completion, grant reward, handle failure, hide ad banner if no ads availabe" touches a lot of state and has to work with the Google SDK's lifecycle, which is... not always intuitive. Claude burned through several iterations on this before it stabilized.
- Anything that required taste. How long should the auto-clear delay be? How should the tiles animate? What does "done" look like for the results screen? Should the result screen feel celebratory or minimal? These are judgment calls. The AI can implement any answer to these questions, but it can't tell you which answer is the right one.
Features That Emerged During the Process
Several technical decisions and features appeared that I never explicitly prompted for. I only noticed them after the implementation was already finished.
My original prompt was just a single sentence describing the idea. As Claude and ChatGPT iterated on the requirements, additional capabilities made their way into the build without me ever specifying them directly.
Deterministic push notification previews. Because the puzzle is fully deterministic, the iOS app can pre-generate tomorrow’s puzzle and include the scrambled letters directly in a scheduled local push notification. Users get a teaser like “Today’s letters: R A M B L E” before even opening the app.
Drag-to-select with line drawing. Both platforms ended up with a draggable letter selection system where a line is drawn between selected tiles in real time, with a dashed preview line from the last tile to the current finger or cursor position. The original idea only mentioned selecting letters, but the implementation expanded that into drag-to-select with visual feedback.
Onboarding spotlight cutouts. The first-launch tutorial highlights specific UI elements by punching transparent holes in a dimmed overlay. The final implementation included a full spotlight system with animated cutouts. Each platform used a different rendering approach, but the visual result is the same.
Share card rendering. The results screen generates a shareable image on both platforms. The implementation includes the full pipeline: rendering the results view to an image and passing it to the native share sheet.
What It Cost
Basically nothing. The domain unjumbl.app was $13 and that was the only new expense. I already have a VPS where I host all of my other websites, including this blog, so hosting the Web version didn't add anything to my existing fixed yearly fee. The iOS app runs entirely on the user's device, so there's no server cost there either.
The Apple Developer Program is $99/year, but I already had that for other projects. No database, no cloud functions, no ongoing costs beyond what I was already paying.
Things I'd Do Differently
The project wasn't hard. These aren't lessons about the technical challenges — they're about learning how to delegate to AI more effectively.
Start with the Web version. I built iOS first because it's what I know. Bad call. For a daily puzzle game, the Web is the distribution channel. Wordle didn't take off because of an app. It took off because people could share a link directly to the puzzle. Beyond distribution, the tooling gap matters — AI-assisted development on the Web is significantly more mature. MCP tools like XcodeBuildMCP exist for iOS, but the Web ecosystem has had tighter feedback loops for longer. Claude can spin up a dev server, inspect the DOM, and iterate in ways that aren't as seamless with a simulator. If I'd built the Web version first and let AI iterate to a working product with full visibility, then done a one-shot port to iOS, I think the total time would have been even shorter.
Curate your word list manually from the start. Claude's initial attempt at generating a word dictionary was rough. It included obscure three-letter words that no normal person would know — the kind of words that make players feel like the game is broken. When I gave it that feedback, it pivoted to finding existing open-source word lists on GitHub and repurposing them, which was smarter. But even after many rounds of prompting to distill the list down to only common, recognizable words, it still wasn't great. I eventually had to do a manual pass myself, and even now I'm occasionally finding words that probably shouldn't be in there. For a game where the word list is the product, this isn't something you can fully delegate.
Build one platform as the reference, then port. Write comprehensive tests for the first platform, then use those tests as the acceptance criteria when porting to the second one. This would have caught cross-platform bugs way earlier.
What I Actually Learned
Here's the thing I keep coming back to: I never once opened Xcode to look at code during this project. Not once. Everything was done through Claude, Xcode CLI tools, and the terminal. I didn't read a single line of Swift or TypeScript. For someone who has spent 10 years as a professional developer — someone who would normally be deep in the debugger, stepping through breakpoints, reading stack traces — that felt genuinely surreal. And it worked.
The biggest takeaway is that for a project like this, the coding was almost an afterthought. What actually took the most time was assembling the App Store screenshots, writing the descriptions, choosing the right keywords, designing the icon. The meta-work around shipping took longer than the development itself. That's a strange thing to type, but it's true.
My relationship with commits changed too. In professional development, I commit frequently and in small, well-scoped chunks. On this project, my commits were large and infrequent. The iteration speed was so fast, and I knew Claude's snapshot system would let me roll back easily, so incremental progress tracking just stopped being front of mind. That felt atypical for me, but it also felt... fine?
One thing that worked surprisingly well was the only bit of preemptive setup I gave Claude before the experiment started.
I pointed it at my personal projects directory and asked it to study my existing apps. Look at how I handle things like app review prompts, contact-the-developer flows, privacy policy links, error dialogs, and the other small details that polished apps usually include.
These are the kinds of peripheral features you rarely think to mention in a prompt, but they’re part of what makes an app feel complete.
I then asked Claude to write a CLAUDE.md file documenting those patterns so it could reuse them when building my projects.
That was the only upfront guidance. The actual project prompt for UnJumbl was still just a single sentence. Claude and ChatGPT went back and forth a few times to expand it into a rough requirements doc, which I never read, and then Claude entered the Ralph loop and implemented everything.
Because of that CLAUDE.md file, UnJumbl still shipped with all those additional touches without me ever explicitly asking for them. Even better, that file now lives alongside my other projects, so future apps can inherit the same conventions without any extra prompting.
By the Numbers
| Metric | Value |
|---|---|
| Lines of code | ~8,000 |
| Time to launch | <24 hours |
| Total new cost | $13 (domain name) |
| Components per platform | ~20 |
| Platforms | iOS + Web |
Wrapping Up
Let me be honest: this is a simple app. Of course vibe coding could handle it. A daily word game with no backend, no auth, no real-time multiplayer — this is squarely in the sweet spot of what AI-assisted development handles well today. The animations, the ad integration, the analytics wiring, the App Store metadata — all of this would have taken me several hours to assemble by hand. Claude did it in one sitting. For a side project where I just wanted something that worked, that's a genuine shift in what's possible.
But I don't want to overstate it. Not every project will go like this. I recently built SimTag, which involved significantly more nuance — and in that project, the cracks in vibe coding were much more visible. I'm finding this to be true of my professional work at Luma AI as well - more on all this in the next post.
What I'll say is this: as a professional developer who spends all day writing careful, reviewed, well-tested code, there was something strangely freeing about being able to ignore all of that for a weekend project.
I didn’t read a single line of code. I didn’t open a debugger. I didn’t step through the plan.
I wrote one sentence describing the app I wanted — and it appeared.
Less than 24 hours later it was live, people were playing it, and the whole thing worked well enough to ship.
That’s not how you build production software. But for indie projects, experiments, and small ideas that might otherwise never exist, it might be exactly how you start.
Try the game if you want:
unjumbl.app (Web)
unjumbl.app (iOS)
]]>
- Watching stock or crypto price dashboards
- Testing local development changes
- Waiting on sneaker or ticket drops
- Refreshing sports scores during a game
Eventually you
]]>- Watching stock or crypto price dashboards
- Testing local development changes
- Waiting on sneaker or ticket drops
- Refreshing sports scores during a game
Eventually you ask yourself why you're manually doing this.
Since Safari doesn’t offer a native way to reload a page every X seconds, automatic refresh on macOS, iOS, or iPadOS requires a Safari extension - and this post walks through how to set that up and get pages auto-reloading properly.
The Cleanest Way to Auto-Reload Safari Pages
I built a small Safari extension called Auto Reloader – Page Refresh that does exactly this.

It works across:
- macOS
- iOS
- iPadOS
Same extension. Same behavior. Just installed once per device.

How to Auto-Reload a Page in Safari
- Install the app from the App Store.
- Open Safari.
- Go to Settings → Extensions and enable Auto Reloader.
- Click the extension in the toolbar.
- Set a refresh interval.
That’s it.
The current tab will reload automatically at your chosen interval.

Who Actually Needs Safari Auto Refresh?
This isn’t a novelty feature. It’s for moments where you’re stuck manually refreshing the same page over and over.
Traders Watching Live Dashboards
Some market pages don’t push updates in real time.
Order books lag. Portfolio pages cache. Charts stall.
So what do you do? You sit there hitting refresh.
Auto Reload keeps the page current without you babysitting it.
Developers Testing Local Changes
If you’re working on:
localhost- staging builds
- CSS/layout tweaks
- dashboards that poll instead of push
Sneaker and Ticket Drop Monitoring
Limited drops usually come down to timing.
If a product page does not automatically update inventory or release status, refreshing every few seconds can matter.
Automating that refresh removes one more manual step.
Sports Score Refresh During Games
Some sports sites do not live update without interaction. If you're watching a score page during a game, automatic refresh keeps it current without touching the screen.
Why Use Safari Instead of Switching Browsers?
You could install a Chrome extension, but if you prefer Safari for:
- Native performance
- Lower battery usage
- iCloud tab sync
- Apple ecosystem integration
It makes more sense to add auto refresh directly to Safari rather than switching browsers just for one feature.
Common Questions
Can I set different refresh intervals?
Yes. You can choose a custom interval for the current tab. For example, you might refresh every 5 seconds for a live dashboard and every 60 seconds for something less time-sensitive.
Does it work per tab?
Yes. The refresh setting applies to the specific tab where you enable it. Other tabs remain unaffected unless you turn it on there as well.
Does it stop when I close the tab?
Yes. Once the tab is closed, refresh stops automatically.
Is my data tracked?
No. The extension does not require accounts, logins, or analytics. It runs locally within Safari.
Does it work on any website?
It works on standard web pages loaded inside Safari. Most dashboards, storefronts, news pages, sports pages, and development environments work as expected.
Will this drain battery?
Because it runs as a lightweight Safari extension and only reloads at the interval you choose, usage depends on how aggressive your refresh timing is. Longer intervals naturally use less battery and network activity.
If you find yourself refreshing the same page more than a few times in a row, that’s usually a sign.
Safari won’t automate it for you.
Auto Reloader will.
Set the interval once. Let it run. Move on.
👉 Download Auto Reloader on the App Store
Even before AI coding, I’d often have multiple copies of the same project open—using git worktrees or separate clones—to work on different branches in parallel.
Now, with multiple Claude Code sessions running at once, each doing
]]>Even before AI coding, I’d often have multiple copies of the same project open—using git worktrees or separate clones—to work on different branches in parallel.
Now, with multiple Claude Code sessions running at once, each doing work on a different branch, that setup is even more common.
The result is multiple simulators running at the same time, all looking identical, with no clear way to tell which branch any of them is actually running. SimTag fixes that.
What SimTag Does
SimTag adds a small, unobtrusive overlay to each iOS Simulator window showing the branch that build came from.
That’s it.


When you glance at a simulator, you immediately know what you’re looking at. No more wondering:
- Did I rebuild after switching branches?
- Which Simulator has the auth changes?
- Am I debugging my own work or a coworker’s branch?
If you do any kind of parallel development—worktrees, PR reviews, or AI-assisted coding—this removes a constant source of confusion.

SimTag is especially useful for power users running parallel workflows. If you use git worktrees, multiple clones, or have several AI coding sessions (e.g. Claude, Codex) building to different simulators, you’ll always know which Simulator is running which branch.
But even if your workflow is simpler, SimTag still helps. A quick glance confirms the Simulator matches the branch you think you’re on. The "Pending Build" indicator catches “forgot to rebuild” moments by warning you when commits exist since the last build. During PR reviews, it acts as a sanity check—you’ll know for sure you’re testing your colleague’s code, not your own.
The overlay is unobtrusive and easy to ignore—until you need it.
Features
Branch overlay
See the git branch for every simulator window at a glance.
Pending build indicator
SimTag detects when you’ve made commits since the last build. A small warning dot tells you the running app might be stale—no more debugging code that isn’t even in the build.
Custom labels
Add your own text to the overlay. Useful for marking simulators as “PR Review”, “Testing”, or whatever helps you stay oriented.
Details
- macOS 13+
- Requires Screen Recording permission (used only to track window positions—not to record anything; setup is guided on first launch)
- Runs in the menu bar
- Optional launch at login
- Overlay position is configurable (any corner, top/bottom center)
I use SimTag every day now. It’s one of those tools you don’t think about—until it’s missing.

Getting Started
- Download SimTag
- Move the application to the Applications folder.
- Launch and allow
Screen & System Audio Recordingpermissions (System Settings → Privacy & Security → Screen & System Audio Recording). - Grant file access permissions when prompted.
That's it!
FAQ
Multiple Xcode projects open?
SimTag figures out which project produced each specific simulator build.
React Native / Flutter?
Works fine. SimTag detects the git branch of whatever Xcode project built the app.
Git worktrees?
Fully supported. Each worktree shows its own branch correctly.
Questions or feedback?
[email protected]
If you write about code in chat, you’ve probably experienced this:
You’re explaining something in Slack or Notion, focused on the idea you’re trying to get across — and only after you send it do you notice nothing’s formatted. Or
]]>If you write about code in chat, you’ve probably experienced this:
You’re explaining something in Slack or Notion, focused on the idea you’re trying to get across — and only after you send it do you notice nothing’s formatted. Or you remember halfway through and start going back to wrap things in backticks.
Or you forget entirely and just hope the other person figures it out.
It’s not hard, and it makes your message more readable, but it pulls you out of the flow every time.
After doing this for years, I finally got annoyed enough to fix it. So, I built - Backtick - a lightweight macOS menu bar app that automatically wraps code-like text in Markdown backticks.
Select the text you want to format — or leave nothing selected to format the whole message — press the keyboard shortcut, and Backtick automatically identifies and formats:
functionNamesvariableNames--cli-flags/file/pathsSCREAMING_CONSTANTS- environment variables, versions, commands, and much more
With just one (customizable) keyboard shortcut (⌥⌘B by default), all of the code terms in your text are automatically identified and formatted:


Backtick works at the system level via the macOS Accessibility APIs, so you can use it in all of the apps you normally use:
- Slack, Discord, Teams
- Notion, Bear, Obsidian
- Notes, TextEdit
- Websites like GitHub, Linear, etc

Most common code patterns are handled automatically, without any setup. But, if there are a few terms you want formatted differently, you can fine-tune it with simple allow and never-format lists (within the "Custom Words" section).

Getting Started
- Download Backtick
- Move the application to the Applications folder.
- Launch and grant
Accessibilitypermissions (System Settings → Privacy & Security → Accessibility). - Write normally
- Press
⌥⌘B - Stop thinking about backticks
Click here to download:

FAQ
Internet required?
No. Everything runs locally.
Already formatted text?
Skipped automatically.
Multi-line code?
Detected and wrapped in triple backticks with language hints.
Is it perfect?
Not quite. It’s a time-saver, not a mind reader — it gets most things right out of the box. It's currently still in Beta.
System requirements?
macOS 14.0 (Sonoma) or newer.
Feedback? Email me at [email protected]
]]>The founder was a retired iOS engineer who'd published a few programming books and built several successful apps - and, being fresh out of college, I wanted to impress him. He was one of my first real bosses, and I figured if anyone could determine whether or not I was cut out for this industry, it’d be someone like him.
Most of his day was spent on client calls, but whenever he wasn't on one, he’d stand behind us watching us code - literally. Occasionally, he’d chime in with some unsolicited live code review that derailed my train of thought entirely.
He’d pick one of us at random to start his surveillance shift, following along from wherever we happened to be in the task. Once we wrapped up whatever we were working on - quick fix or complex new feature - he’d drift over to the other guy. It didn’t matter how big or small the task was; the mission was clear: get his eyes off our back as fast as possible. The other engineer and I never talked about it, but we both instinctively started optimizing for one goal — to escape surveillance.
The experience wasn’t just unpleasant - it warped my sense of what the job, and even the industry, was like. It felt like being stuck in a never-ending coding interview - except instead of whiteboard questions, I was shipping production code with someone second-guessing every decision I made.
That kind of pressure shaped how I approached work. I stopped thinking of code as something to design thoughtfully and started seeing it as something to finish before his next client call ended.
And the incentives? Completely broken:
- If you moved quickly, you bought yourself a little bit of peace and silence - at least until the next ticket was assigned.
- The backlog was endless, and delivery velocity was the only thing being tracked.
- Output mattered. Outcome didn’t.
- You were constantly trying to distance yourself from being the “bottleneck” or, worse, “layoff material.”
- Working alongside others felt competitive - everyone chasing visibility, promotions, or just survival.
- Speed gave you cover; it made you look like someone who had it all under control.
So, you adapt. You start cutting corners without realizing it:
- You make PRs that are functional, but fragile.
- You avoid “scary” parts of the codebase because getting stuck feels riskier than delivering a subpar fix.
- You skip tests because “I’ll come back and add them later.”
- You default to the same solutions because learning new ones might slow you down.
- You skip documentation and deeper reads because those don’t “burn down” the board.
- You move from task to task with the goal of closing, not understanding.
- You get in the habit of copy-pasting from StackOverflow / ChatGPT without pausing to understand what the code is really doing.
And before long, you’re the “fast engineer.” Congrats. A rockstar developer. The one who always gets things done - even if it’s duct tape and dreams holding it together. That's how the bad habits form - not because you’re trying to be reckless, but because the environment makes slowness feel dangerous.
And look, speed can feel great. Early in your career, it gets you noticed and praised. You get labeled as a “10x engineer.” You become the person people turn to when something needs to get done quickly. But the label is a trap.
That mindset followed me to Porsche’s research and development wing - my dream job at the time. But, the focus there was specifically rapid prototyping - building fast was part of the mandate. And without proper checks, I leaned even harder into my speed-over-stability tendencies. One day, a friendly, sassy product manager I worked with started calling me “Bugs Bunny” - because what I built was fast, but often… buggy. Not entirely unfair. It was a joke, of course - we got along well - but it left an impression.
Now, I’m in a new job again. New team, new codebase, new first impressions to make. I’m working alongside some of the sharpest engineers I’ve ever met, and the temptation is real - to make every PR flawless, to move quickly, to prove I belong. But I’ve been reminding myself - sometimes daily - that it’s okay to take a beat.
You can write a great PR tomorrow after learning the system today. You can ask that “dumb” question instead of pretending you already know how it all works. You can flag uncertainty instead of quietly hoping it won’t blow up later. You can hold off on shipping until you’ve triple-checked the edge cases.
Because in the long run, no one’s going to remember whether you shipped that one PR in 20 minutes or two hours. Everyone’s juggling their own deadlines and anxieties. They’re not watching your GitHub Pulse as closely as you think.
This isn’t advice and it's not meant for anyone in particular. It's a note to myself to be a little more honest about the habits I’ve picked up, and the ones I want to leave behind. If it happens to mirror your experience, great - you're not alone.
Here’s what I wish I had internalized sooner:
- Being fast makes you feel valuable. Being thorough makes you trusted. Trust takes longer to build, but it lasts a hell of a lot longer than “Wow, that was quick!”
- You only get so many chances at learning something deeply. Don’t waste them rushing. Understanding the system once saves you from firefighting it ten times.
- The engineer who’s always “busy” is often just the one stuck cleaning up their own shortcuts. There's no badge for that kind of hustle.
- The “slow” path compounds. Reading documentation, writing tests, digging through related files - all of that adds up to better judgment, stronger instincts, and more meaningful contributions. That growth pays off in ways no burndown chart can ever measure.
So, yeah - read the docs. Understand the why. And maybe don’t rely on AI to solve everything for you.
More than anything, give yourself permission to slow down. Not forever. Not for everything - just for the stuff that matters.
Because if you don’t - if you chase speed at all costs - you pay for it eventually. In tech debt. In brittle codebases. In late-night outages. In burnout. In never actually getting better - just faster at doing the same shallow things. Take your time. Ask the "dumb" question. Write that extra test.
And don’t worry - Bugs Bunny already took the hits for you.
]]>So, I built Commuter: Bay Area —
]]>So, I built Commuter: Bay Area —a clean, reliable app that brings schedules from every major Bay Area transit provider into one place; real-time transit info, right when you need it.


The Problem
I was using 3–4 different apps just to plan my daily commute. One had decent schedules, another showed delays, and none of them covered every agency I needed. Even the ones that looked okay were bloated with features I didn’t care about.
I just wanted one app that could quickly tell me when the next train or bus was coming at the stops I care about—without making me dig through menus or switch apps.
What Commuter Does
Commuter gives you real-time transit info for every major Bay Area provider:
- BART
- Caltrain
- SF Muni
- AC Transit
- VTA
- Golden Gate Transit
- And 40+ more…
You can check departures, view live ETAs, and quickly add routes from any agency to your dashboard. It’s built for people who want fast, reliable transit info without extra steps.
Built with SwiftUI and Vapor
The app is built entirely in SwiftUI, with a Vapor backend that fetches and processes real-time data from 511.org.
Sharing models across the iOS app and backend made it easy to iterate quickly and keep everything in sync.
All the routing, filtering, and presentation logic is handled locally in SwiftUI, while Vapor handles syncing schedules, delays, and agency metadata.
Why It’s Useful
Whether you’re heading to work, catching a train into the city, or checking weekend schedules, Commuter Bay Area makes it easy to see what’s coming up next. You can check real-time departures for the stops you care about and get going—without bouncing between websites or dealing with clunky interfaces.

If you’re in the Bay Area and use public transportation regularly, give it a try. And if it saves you time, a quick share or review goes a long way.
Built to solve my own problem—but maybe it solves yours too.
What’s Coming Next
This is just the start. There’s a lot more we want to build into Commuter Bay Area to make it even more useful:
- Notifications – Get alerted when your train or bus is arriving soon
- Route delays – See disruptions and service changes in real-time
- Reminders – Set custom alerts for your regular commutes
- Widgets – Glanceable info right from your Home Screen or Lock Screen
If there’s something you’d love to see in the app, let me know—I’m always looking for feedback.
]]>SwiftUI's TimelineView is a powerful feature for building views that update according to whatever schedule you provide.
Whether you're creating a real-time clock, a countdown timer, or periodic data visualizations, TimelineView simplifies the process by letting you schedule updates with fine-grained control.
What is TimelineView?
A TimelineView is simply a container view in SwiftUI that redraws its contents at scheduled points in time. It's especially useful for time-sensitive or periodic tasks where precision is important, such as:
- Clocks or calendars.
- Periodic updates (e.g., refreshing live data every 10 seconds).
- Animations or visualizations tied to time.
As a container view, it has no appearance of it's own, it simply accepts a closure that creates the content you wish to redraw:
TimelineView(...) { _ in
    // Some view
}
The TimelineView initializer accepts a TimelineSchedule to control when updates happen and there's a few different types of schedules you can pick from:
.periodic(from:by:)
Regularly refresh the view at defined intervals (e.g. every second), perfect for periodic updates like clocks and timers.
struct RealTimeClockView: View {
    var body: some View {
        // Redraws the view every 1 second
        TimelineView(.periodic(from: Date(), by: 1)) { context in
            let currentDate = context.date
            let formattedTime = timeFormatter.string(from: currentDate)

            VStack {
                Text("Current Time")
                    .font(.headline)
                Text(formattedTime)
                    .font(.largeTitle)
                    .bold()
            }
            .padding()
        }
    }

    private var timeFormatter: DateFormatter {
        let formatter = DateFormatter()
        formatter.dateFormat = "hh:mm:ss"
        return formatter
    }
}
.explicit(dates:)
Refresh the view at predefined moments (i.e. alarms / reminders) using a specific list of dates.
struct ScheduledUpdatesView: View {
    let updateTimes = [
        Calendar.current.date(bySettingHour: 9, minute: 0, second: 0, of: Date())!,
        Calendar.current.date(bySettingHour: 12, minute: 0, second: 0, of: Date())!,
        Calendar.current.date(bySettingHour: 18, minute: 0, second: 0, of: Date())!
    ]

    var body: some View {
        TimelineView(.explicit(updateTimes)) { context in
            VStack {
                Text("Next Update")
                    .font(.headline)
                Text("Updated at \(context.date, style: .time)")
                    .font(.largeTitle)
            }
            .padding()
        }
    }
}
.animation(minimumInterval:paused:)
Drive smooth, time-based animations with precise timing.
struct RotatingClockView: View {
    var body: some View {
        // 60 FPS
        TimelineView(.animation(minimumInterval: 1 / 60)) { context in
            let seconds = Calendar.current.component(.second, from: context.date)
            VStack {
                Text("Clock Animation")
                    .font(.headline)
                ZStack {
                    Circle()
                        .stroke(lineWidth: 2)
                        .frame(width: 150, height: 150)

                    Rectangle()
                        .fill(Color.red)
                        .frame(width: 2, height: 75)
                        .offset(y: -37.5)
                        .rotationEffect(.degrees(Double(seconds) * 6)) // Rotate based on seconds
                }
            }
            .padding()
        }
    }
}
.everyMinute
Refreshes the view at the beginning of each minute.
TimelineView(.everyMinute) { context in
    ...
}Custom Schedules
You can create your own custom schedule by subclassing TimelineSchedule:
struct CustomSchedule: TimelineSchedule {
    func entries(from startDate: Date, mode: TimelineScheduleMode) -> [Date] {
        var entries: [Date] = []
        ...
        entries.append(someDateObject)
        return entries
    }
}
For a schedule containing only dates in the past, the TimelineView shows the last date in the schedule. For a schedule containing only dates in the future, the TimelineView draws its content using the current date until the first scheduled date arrives.
Limitations of TimelineView
While TimelineView is great for time-driven updates, it has some limitations:
- Not event-driven: It can’t react to data updates outside of its time schedule (e.g., WebSocket or user input).
- System-managed scheduling: SwiftUI may coalesce updates to conserve resources, so it’s not guaranteed for extremely high-precision tasks like millisecond timing.
- Static timing schedules: Once a
TimelineViewis created, its timing schedule cannot be dynamically modified.
For event-driven use cases (like a real-time data stream), consider using Observation or Combine instead.
In case you missed it, here's a recording of my talk at SwiftCraft earlier this year:
If you're interested in more articles about iOS Development & Swift, check out my YouTube channel or follow me on Twitter.
And, if you're an indie iOS developer, make sure to check out my newsletter! Each issue features a new indie developer, so feel free to submit your iOS apps.
 Indie Watch

To get started, create a new Xcode project and select Screen Saver:

The new
]]>To get started, create a new Xcode project and select Screen Saver:
The new project comes with some starter code, but it's in Objective C:

Fortunately, we can just delete those classes and replace them with their Swift equivalent. No need to create a bridging header either.

Next, we'll need to go into our Project Settings and update the Principal class to match the name of the Swift class we're replacing the starting Objective-C code with. We'll need to provide some namespace information here as well, so make sure to update this value to be in the format of PROJECT_NAME.SWIFT_CLASS_NAME:

Now, creating a macOS screensaver is largely undocumented and riddled with bugs in macOS Sonoma, so implementing this custom screensaver was a bit trickier than expected.
We'll start by making a basic vanilla screensaver to get a feel for the main functions and steps involved and then we’ll replace it up with our SwiftUI version.
Building A Basic Screensaver
In order to create our custom screensaver, we'll start by subclassing ScreenSaverView.
import Foundation
import ScreenSaver

class RotatingLogoScreensaver: ScreenSaverView {

}
Now, we have our first decision to make. We can implement our screensaver relying entirely on CoreAnimation or we can implement it by overriding specific functions on ScreenSaverView.
Core Animation vs. Manual Rendering
If you’re creating smooth, continuous animations—like rotating, scaling, or moving an object—Core Animation is ideal. It’s highly optimized for these types of animations, running efficiently on the GPU without requiring continuous manual updates. Core Animation takes care of frame timing and updates automatically, making it easier to implement animations that need consistent refresh rates (e.g., 60fps) without worrying about defining how the screensaver should work from frame to frame. So, if your building something like a rotating logo, a pulsing effect, or continuous fade-in/out—simple effects that don’t require frame-by-frame custom drawing, I'd recommend you use CoreAnimation directly.
Instead, if you need custom drawing that changes each frame (such as an animation involving path drawing, text changes, or data visualizations), draw(_:) and animateOneFrame() give you full control over the exact contents of each frame. And for screensavers where you want to control the exact update frequency and timing independently of the display refresh rate, animateOneFrame() offers more flexibility in setting custom frame rates.
If you want to proceed with the manual rendering approach, you'll need to override the following methods:
init?(frame: NSRect, isPreview: Bool)
Creates a newly allocated screen saver view with the specified frame rectangle. isPreview tells the system whether it should use this screensaver as the preview in System Settings.
func draw(NSRect)
The draw(_:) method is for static rendering, allowing you to draw shapes, images, or text without continuous updates—ideal for screensavers without animation.
func animateOneFrame()
This is called repeatedly at the screensaver’s frame rate, making it perfect for animated elements where you’re updating positions, colors, or other properties over time. Since animateOneFrame() can manage both updating and rendering animated content, you generally don’t need to use draw(_:) alongside it, as they’re almost mutually exclusive in practice.
Implementation
Since we're after a simple rotating image screensaver, we can rely on CoreAnimation directly.
import Foundation
import ScreenSaver

class RotatingLogoScreensaver: ScreenSaverView {
    override init?(frame: NSRect, isPreview: Bool) {
        super.init(frame: frame, isPreview: isPreview)
        setupLayers()
    }

    required init?(coder: NSCoder) {
        super.init(coder: coder)
        setupLayers()
    }

    private func setupLayers() {
        // 1
        wantsLayer = true // Enable layer-backed view for animations

        // 2
        layer = CALayer()
        layer?.backgroundColor = NSColor.black.cgColor

        // 3
        let logoLayer = CALayer()
        logoLayer.contents = Bundle(for: Self.self).image(forResource: "Logo")

        // Scales the logo to 35% of the view's dimensions
        let defaultLogoSize: CGFloat = 150.0
        var logoDimension: CGFloat = defaultLogoSize
        if let currentWidth = layer?.frame.width {
            logoDimension = currentWidth * 0.35
        }
        logoLayer.frame = CGRect(x: 0, y: 0, width: logoDimension, height: logoDimension)

        // Center the logoLayer in the view
        logoLayer.position = CGPoint(x: bounds.midX, y: bounds.midY)

        // Apply the rotation animation
        let rotation = CABasicAnimation(keyPath: "transform.rotation.z")
        rotation.fromValue = 0
        rotation.toValue = CGFloat.pi * 2
        rotation.duration = 4.0 // Adjust for rotation speed
        rotation.repeatCount = .infinity // Repeat indefinitely

        // 5
        logoLayer.add(rotation, forKey: "rotate")

        // 6
        layer?.addSublayer(logoLayer)
    }
}
- Enable Layer-Backed View:
wantsLayer = truetells the view to use a Core Animation layer as its backing store. This allows us to add sublayers and apply animations directly to them. - Set the Background Layer: By setting
layer = CALayer(), we create a new custom root layer for this view. Then,layer?.backgroundColor = NSColor.black.cgColorfills the background with black, giving the screensaver a clean slate to work with. - Create the Logo Layer: The next step is to create a
logoLayerto display the image we want to animate.logoLayer.contentsloads the image resource from the app bundle and assigns it to the layer, which acts as the logo’s "canvas." - Add a Rotation Animation: To make the logo rotate continuously, we create a
CABasicAnimationon thetransform.rotation.zkey path. - Adding this animation to
logoLayerstarts the rotation. - Add
logoLayerto the Main Layer: Finally,layer?.addSublayer(logoLayer)attaches the logo layer (with its rotation animation) to the main view’s root layer, making it visible and active in the screensaver.
Testing
With our testing complete, we can now focus on testing our new screensaver. We can't "Run" our screensaver directly from Xcode, so we'll need to grab the Build Product from Derived Data.
Inside Derived Data, in your project's Products folder, you'll find the new .saver file which you can now double-click to install.

Next, you'll be asked to approve the installation of the screen saver; you'll only be asked this the first time you install it.

You should now see a preview of your screensaver in System Preferences:

Now, creating and testing custom screensavers in macOS Sonoma is a bit of a mess.
I ran into an issue where the preview in System Settings was showing the correct behavior, but when I ran the screensaver, I just saw a black screen.
According to this article, the issue is that the previous screensaver process isn't actually terminating; instead, it's just being reused. To get around this, I found that opening Activity Monitor and force-quitting any processes related to "legacyScreensaver" forced the system to recognize the updated version of the .saver.

My recommended testing workflow would be to:
- Quit System Preferences.
- In Activity Monitor, search for "legacy" and delete relevant entries.
- Build Xcode screensaver project.
- Open Derived Data and install new
.saverfile. - Rinse and repeat.
I also noticed that sometimes the Derived Data build product wouldn't update even if the code did, so you may need to delete Derived Data and build again if you don't see the "Last Modified" timestamp change.
Adding SwiftUI
You can turn any SwiftUI View into a screensaver. Simply implement your SwiftUI screen in your typical way and wrap it in a NSHostingController.
We'll be borrowing the implementation from my Recreating The DVD Screensaver In SwiftUI article.
Note: The original implementation was for iOS, so I had to make some minor tweaks to make the implementation work for macOS.
class DVDScreensaverScreensaverView: ScreenSaverView {
    override init?(frame: NSRect, isPreview: Bool) {
        super.init(frame: frame, isPreview: isPreview)

        // Enable layer-backed view for better rendering compatibility with SwiftUI
        wantsLayer = true

        let timeView = ContentView()
        let hostingController = NSHostingController(rootView: timeView)

        // Set frame directly to bounds and enable autoresizing
        hostingController.view.frame = bounds
        hostingController.view.autoresizingMask = [.width, .height]
        addSubview(hostingController.view)
    }

    required init?(coder decoder: NSCoder) {
        super.init(coder: decoder)
        fatalError("Not implemented.")
    }
}
That's all we need to do to make any SwiftUI experience available as a screensaver!
The rest of the process is the same; simply build the project and install the new .saver file:

The source code for this project is available here:
In case you missed it, here's a recording of my talk at SwiftCraft earlier this year:
If you're interested in more articles about iOS Development & Swift, check out my YouTube channel or follow me on Twitter.
And, if you're an indie iOS developer, make sure to check out my newsletter! Each issue features a new indie developer, so feel free to submit your iOS apps.
Indie WatchHave you ever lost track of a link, a song, or some other recommendation a friend has sent you in a busy chat? It happens to all of us and, fortunately, that's exactly what the Shared with You feature on iOS is meant to solve.
What is Shared with You?
Shared with You makes it easy for users to find content that's been shared with them in Messages directly within the relevant apps. For example, here we can see all of the website links that have been shared with me by my contacts and I can keep the conversation going without ever leaving Safari:

This was originally introduced in iOS 16, but very few apps are taking advantage of it. It's really easy to implement as you'll soon see, so if your app has shareable content of any kind, I highly recommend adding this feature to your app.
Getting Started
Before we jump into the code, there’s a few things you should know first:
- In order for your app to support Shared With You, your app needs to support Universal Links since this is how Apple verifies that the links shared in Messages belong to your app.
- Since Shared with You relies on Messages, you’ll need to test your app on a physical device.
- The framework only pulls content from saved contacts, so make sure the person who sent you the link is saved in your contacts when you're testing your implementation.
Our only real setup step is to add the Shared with You capability to our Xcode project:

Implementation Overview
In most Shared with You implementations, you’ll see two components - the shelf and the attribution view.

Shelf
The shelf lists all of the content shared with you in Messages in a single convenient location. The system automatically organizes this shelf, starting with Siri Suggestions based on recent interactions with the content, then pinned messages, and finally, it sorts everything else chronologically.
Attribution View
The attribution view lets you see who shared the content with you and shows you their name, their profile picture, and provides a link back to the original message in the conversation.
Now, as far as I know, you’re not required to have a dedicated shelf in your implementation, but Apple does recommend it. If you prefer, you can just use the attribution view directly to call out shared content in your app.
Let's add Shared with You support to this app.
The first tab shows a list of blog posts from this website, and in the second tab, we’ll create a shelf to display posts shared with us by our contacts.

Retrieving Links
To get a list of links shared with the user, we’ll create an instance of SWHighlightCenter, the main class responsible for retrieving and managing shared links.
import SharedWithYou

// Provides the application with a priority-ordered list of
// universal links which have been shared with the current user.
private let highlightCenter = SWHighlightCenter()
Next, we'll use the SWHighlightCenter to get a list of highlights. A highlight represents a single shared item, so anytime you see highlight, think of it simply as the link shared with the user.
We’ll save the highlights to a @Published property which we’ll eventually use to populate our shelf:
import SharedWithYou

final class SharedWithYouService: NSObject, ObservableObject {

    // Each highlight represents a shared link
    @Published var highlights: [SWHighlight] = []

    // Provides the application with a priority-ordered list of universal links
    // which have been shared with the current user.
    private let highlightCenter = SWHighlightCenter()

    override init() {
        super.init()

        highlights = highlightCenter.highlights
    }
}
Then, we'll implement the HighlightCenterDelegate function so we can get notified whenever the highlights change:
import SharedWithYou

final class SharedWithYouService: NSObject, ObservableObject, SWHighlightCenterDelegate {

    // Each highlight represents a shared link
    @Published var highlights: [SWHighlight] = []

    // Provides the application with a priority-ordered list of universal links
    // which have been shared with the current user.
    private let highlightsCenter = SWHighlightCenter()

    override init() {
        super.init()

        highlights = highlightsCenter.highlights
        highlightsCenter.delegate = self
    }

    func highlightCenterHighlightsDidChange(_ highlightCenter: SWHighlightCenter) {
        highlights = highlightsCenter.highlights
    }
}
Don’t forget to implement this delegate otherwise you won’t receive any content.
And, that's it! That's all the code we need to get a list of the content shared with the user. We now have a real-time updating list of links that we can use to populate our shelf.
All that’s left to do is render the attribution view.
Feel free to skip this section and continue with the implementation details below.
Closer Look at SWHighlight
The SWHighlight also includes details like who shared the content and a reference to the original message, but the only public properties we have access to are the identifier and URL fields:
SW_EXTERN @interface SWHighlight : NSObject <NSSecureCoding, NSCopying>

/*!
    @abstract The unique identifier for this highlight
 */
@property (copy, readonly, nonatomic) id <NSSecureCoding, NSCopying> identifier;

/*!
    @abstract The surfaced content URL
 */
@property (copy, readonly, nonatomic) NSURL *URL;

- (instancetype)init NS_UNAVAILABLE;
+ (instancetype)new NS_UNAVAILABLE;
@end
Fortunately though, all we really need is the URL. We can use the information in the URL to figure out what data we need to fetch from our backend.
For instance, in our earlier Podcast example, the URL would likely contain a podcastID that we could send to a backend endpoint to retrieve the remaining details needed to display the podcast on our shelf, like the thumbnail, author, length, etc.

Displaying Links
The Shared with You framework includes the SWAttributionView class for displaying attribution views, but it doesn't have SwiftUI support out of the box. We can easily add support by making a custom UIViewRepresentable and passing in the highlight we want the attribution view to be tied too.
We’ll start by creating an instance of our SWAttributionView and we’ll start configuring it.
The displayContext informs the system about the environment we’re showing the attribution view in - we want to use .summary when we’re presenting the view in a top-level list and .detail when we’re showing the view in some kind of detail page. Knowing the context the user is encountering the attribution view in helps the system rank this highlight in the shelf.
struct SWAttributionViewRepresentable: UIViewRepresentable {
    let highlight: SWHighlight

    func makeUIView(context: Context) -> UIView {
        let attributionView = SWAttributionView()
        attributionView.horizontalAlignment = .leading

        // Change `.summary` to `.detail` if presenting in
        // a detail view.
        attributionView.displayContext = .summary
        attributionView.highlight = highlight
        attributionView.backgroundStyle = .default
        attributionView.menuTitleForHideAction = "Remove Article"

        return attributionView
    }

    func updateUIView(_ uiView: UIView, context: Context) {}
}
This view is really locked down and the only things Apple lets us customize here are some basic layout properties - no colors, no fonts, not even the height.
We'll explore some customization options in a moment, but let's finish implementing our shelf.
Creating The Shelf
We’ll use the SharedWithYouService we created earlier and the SWHighlightCenter to get a list of highlights (remember a highlight is just how the framework represents a shared link).
We’ll integrate over all of them and create an attribution view and BlogPostRow for each which will give us this:
struct SharedWithYouShelf: View {
    @StateObject var sharedWithYouService = SharedWithYouService()

    var body: some View {
        NavigationView {
            List(sharedWithYouService.highlights, id: \.url.absoluteString) { highlight in
                VStack {
                    SWAttributionViewRepresentable(highlight: highlight)
                    BlogPostRow(blogPost: getBlogPostFrom(highlight))
                }
            }
        }
    }
}
Now, Apple’s documentation suggests that your shelf should offer a rich preview of the content, including a thumbnail, title, subtitle, and attribution view, which you can see we’ve implemented here for each highlight.
Apple wants the presentation of these attribution views to be secure and they don’t want to reveal any information about the recipients or the conversations, so Apple creates these views on your behalf “out of process”. This means that this view is rendered by a separate process off the main thread, so you can add this feature to your app without worrying about it really affecting your app’s performance.
And that it’s - that’s all the code we need to build our shelf and call out shared content in our apps.
Customizing The Menu
In our current implementation, if we were to long press on the SWAttributionView, we'd see a supplemental menu with some default actions:
- "Reply" will bring up the relevant message in the conversation allowing us to reply without leaving the app.
- "Remove Article" will prevent this link from appearing in Shared with You.

Now, while Shared with You is generally very locked down, Apple exposes some customization options here that allow us to add a few more options to this menu.
In order to do that, we'll need to update our UIViewRepresentable implementation from earlier.
First, we'll add a series of custom UIActions that we want to add to this menu. These will be specific to your use case, but in the case of our list of blog posts, we may want to expose actions for saving to the user’s reading list, translating the article, and bookmarking it.
func makeUIView(context: Context) -> UIView {
    let attributionView = SWAttributionView()
    ...

    // Action to save the article to a reading list
    let saveToReadingListAction = UIAction(
        title: "Save to Reading List",
        image: UIImage(systemName: "book")
    ) { _ in ... }

    // Action to translate the article
    let translateAction = UIAction(
        title: "Translate",
        image: UIImage(systemName: "globe")
    ) { _ in ... }

    // Action to bookmark the article
    let bookmarkAction = UIAction(
        title: "Bookmark",
        image: UIImage(systemName: "bookmark")
    ) { _ in ... }
Then, we can just define our new menu, specify a title and the children to show and assign it to the attribution view's supplementalMenu property.
func makeUIView(context: Context) -> UIView {
    let attributionView = SWAttributionView()
    ...

    // Action to save the article to a reading list
    let saveToReadingListAction = UIAction(
        title: "Save to Reading List",
        image: UIImage(systemName: "book")
    ) { _ in ... }

    // Action to translate the article
    let translateAction = UIAction(
        title: "Translate",
        image: UIImage(systemName: "globe")
    ) { _ in ... }

    // Action to bookmark the article
    let bookmarkAction = UIAction(
        title: "Bookmark",
        image: UIImage(systemName: "bookmark")
    ) { _ in ... }

    attributionView.supplementalMenu = UIMenu(
        title: "Extras",
        children: [
            saveToReadingListAction,
            translateAction,
            bookmarkAction
        ]
    )
    return attributionView
}
And now we have these custom options appearing whenever we interact with the SWAttributionView.

Testing
Lastly, I want to call out some things to make your testing easier.
- In the Settings app, go to Messages, and verify that Shared with You is enabled globally across your device. This should be true by default, but it’s good to double-check.
- Apple lets users disable automatic sharing, both globally and for individual apps, so make sure Shared with You is turned on explicitly for your app too.
- Pinning content in Messages is a great way to verify your implementation since it automatically grants Shared with You permissions. So, if you’ve pinned a message from a known contact and still aren’t seeing results in the
HighlightCenter, the issue likely lies elsewhere in your implementation.

In case you missed it, here's a recording of my talk at SwiftCraft earlier this year:
If you're interested in more articles about iOS Development & Swift, check out my YouTube channel or follow me on Twitter.
And, if you're an indie iOS developer, make sure to check out my newsletter! Each issue features a new indie developer, so feel free to submit your iOS apps.
Indie Watch
https://github.com/aryamansharda/SharedWithYouDemo
 aryamansharda
Debugging can be tricky, especially with custom types. Clear and informative debug output is essential for understanding the behavior of your code.
That's where the CustomDebugStringConvertible protocol and @DebugDescription macro come in. In this article, we'll take a look at how to work with this protocol and how to use this new macro in Xcode 16 to make debugging even easier. 😊
Using CustomDebugStringConvertible
The CustomDebugStringConvertible protocol allows you to customize the debug description of your custom types, providing more detailed and readable debug output.
When you conform to this protocol, you implement a computed property debugDescription that returns a String. This string is used when you print the object in a debug context, such as when using print() or inspecting variables in Xcode's debug console:
struct Book: CustomDebugStringConvertible {
    let title: String
    let author: String
    let pageCount: Int

    var debugDescription: String {
        // Ace the iOS Interview - Aryaman Sharda [330]
        "\(title) - \(author) [\(pageCount)]"
    }
}
This is especially helpful when dealing with complex custom types since a custom formatted output is often more useful than the default one.
Before implementing the CustomDebugStringConvertible protocol, our output looks like this:
let book = Book(
    title: "Ace the iOS Interview",
    author: "Aryaman Sharda",
    pageCount: 330
)

print(book)
Book(title: "Ace the iOS Interview", author: "Aryaman Sharda", pageCount: 330)
With this conformance in place, our debugger output now looks like this:
struct Book: CustomDebugStringConvertible {
    let title: String
    let author: String
    let pageCount: Int

    var debugDescription: String {
        // Ace the iOS Interview - Aryaman Sharda [330]
        "\(title) - \(author) [\(pageCount)]"
    }
}

print(book)
Ace the iOS Interview - Aryaman Sharda [330]

(lldb) po book
▿ Ace the iOS Interview - Aryaman Sharda [330]
  - title : "Ace the iOS Interview"
  - author : "Aryaman Sharda"
  - pageCount : 330
This is clearly a noticeable improvement, but there's still one small issue....
I'd much rather inspect my variables in Xcode's Variable Inspector instead of adding print statements in my code or typing po book to utilize our new custom debugging format.

What if we could change how our variables appear here directly? What if we could see the debugDescription at the top-level without having to expand the book variable? Fortunately, the @DebugDescription macro allows us to do just that.
@DebugDescription
By simply annotating our type with the new DebugDescription macro, we can now use our debugDescription in Xcode's Variable Inspector and crash logs:
@DebugDescription
struct Book: CustomDebugStringConvertible {
    let title: String
    let author: String
    let pageCount: Int

    var debugDescription: String {
        // Ace the iOS Interview - Aryaman Sharda [330]
        "\(title) - \(author) [\(pageCount)]"
    }
}

debugDescription is available here so I no longer need to expand book to see the relevant variables or use print(book) or po book.It's definitely a nice quality of life improvement, but how does it all work? And what if I can't use Xcode 16 yet?
How It Works
In order to display a custom debug description, LLDB - the debugger used in Xcode - needs to evaluate the code that generates this description. In other words, it needs to actually execute the debugDescription computed property.
This process is called "expression evaluation". LLDB usually performs this evaluation only when you explicitly ask for it, commonly using the po (print object) command. Outside of these explicit commands, LLDB avoids the overhead of expression evaluation which can often be complex and slow (or just simply unavailable).
Luckily, we can avoid the need for expression evaluation altogether by defining an LLDB Type Summary. This tells LLDB how to display your type without needing to run any extra code.
For example, in the debugger, we can manually add a Type Summary for Range with the following command:
type summary add --summary-string "${var.lowerBound}..<${var.upperBound}" "Range<MyModule.MyString.Index>"
Since the format is pre-defined, LLDB doesn't need to evaluate any expressions or execute any code to display the summary. It simply replaces the placeholders with the actual values of the properties. This means that LLDB will always be able to display the debug output quickly and reliably, regardless of the state of the program or the availability of expression evaluation.
So, simply put, when we annotate our type with DebugDescription, it's just creating a LLDB Type Summary for it under the hood and then, at compile time, bundling these summaries with the binary.
If you're interested in reading more about the proposal and evolution of this macro, check out the discussion in the Swift forums:
 lorentey
Macro Alternatives
For those who can't use Xcode 16 yet, an alternative is to use LLDB Type Summaries and configure them in your .lldbinit file. The .lldbinit file is a configuration file that Xcode automatically loads when you start a debugging session. It allows you to define custom scripts and commands to control how types are displayed in the debugger.
By writing Type Summaries in the .lldbinit file, you can customize the debug output for your most important models, providing meaningful and formatted information during debugging - even without the new macro.
You can also share the .lldbinit configuration with your team which would allow everyone to benefit from the same enhanced debugging experience. Then, whenever your team is in a position to use Xcode 16, you can migrate to using the new macro.
You can find instructions on setting up the .lldbinit file here:

If you're interested in more articles about iOS Development & Swift, check out my YouTube channel or follow me on Twitter.
And, if you're an indie iOS developer, make sure to check out my newsletter! Each issue features a new indie developer, so feel free to submit your iOS apps.
Indie WatchBlend modes play a crucial role in digital design, enabling designers to easily create complex visual effects like overlays and textures. They're essential for tasks like photo manipulation, creating lighting effects, and adding depth to images.
Blend modes, as the name suggests, blends the colors of multiple layers of pixels using mathematical formulas to determine each pixel's influence on the final image. You can combine any number of layers, but at a minimum, you'll need 2 layers - a base layer and a blend layer to create a blend mode effect.
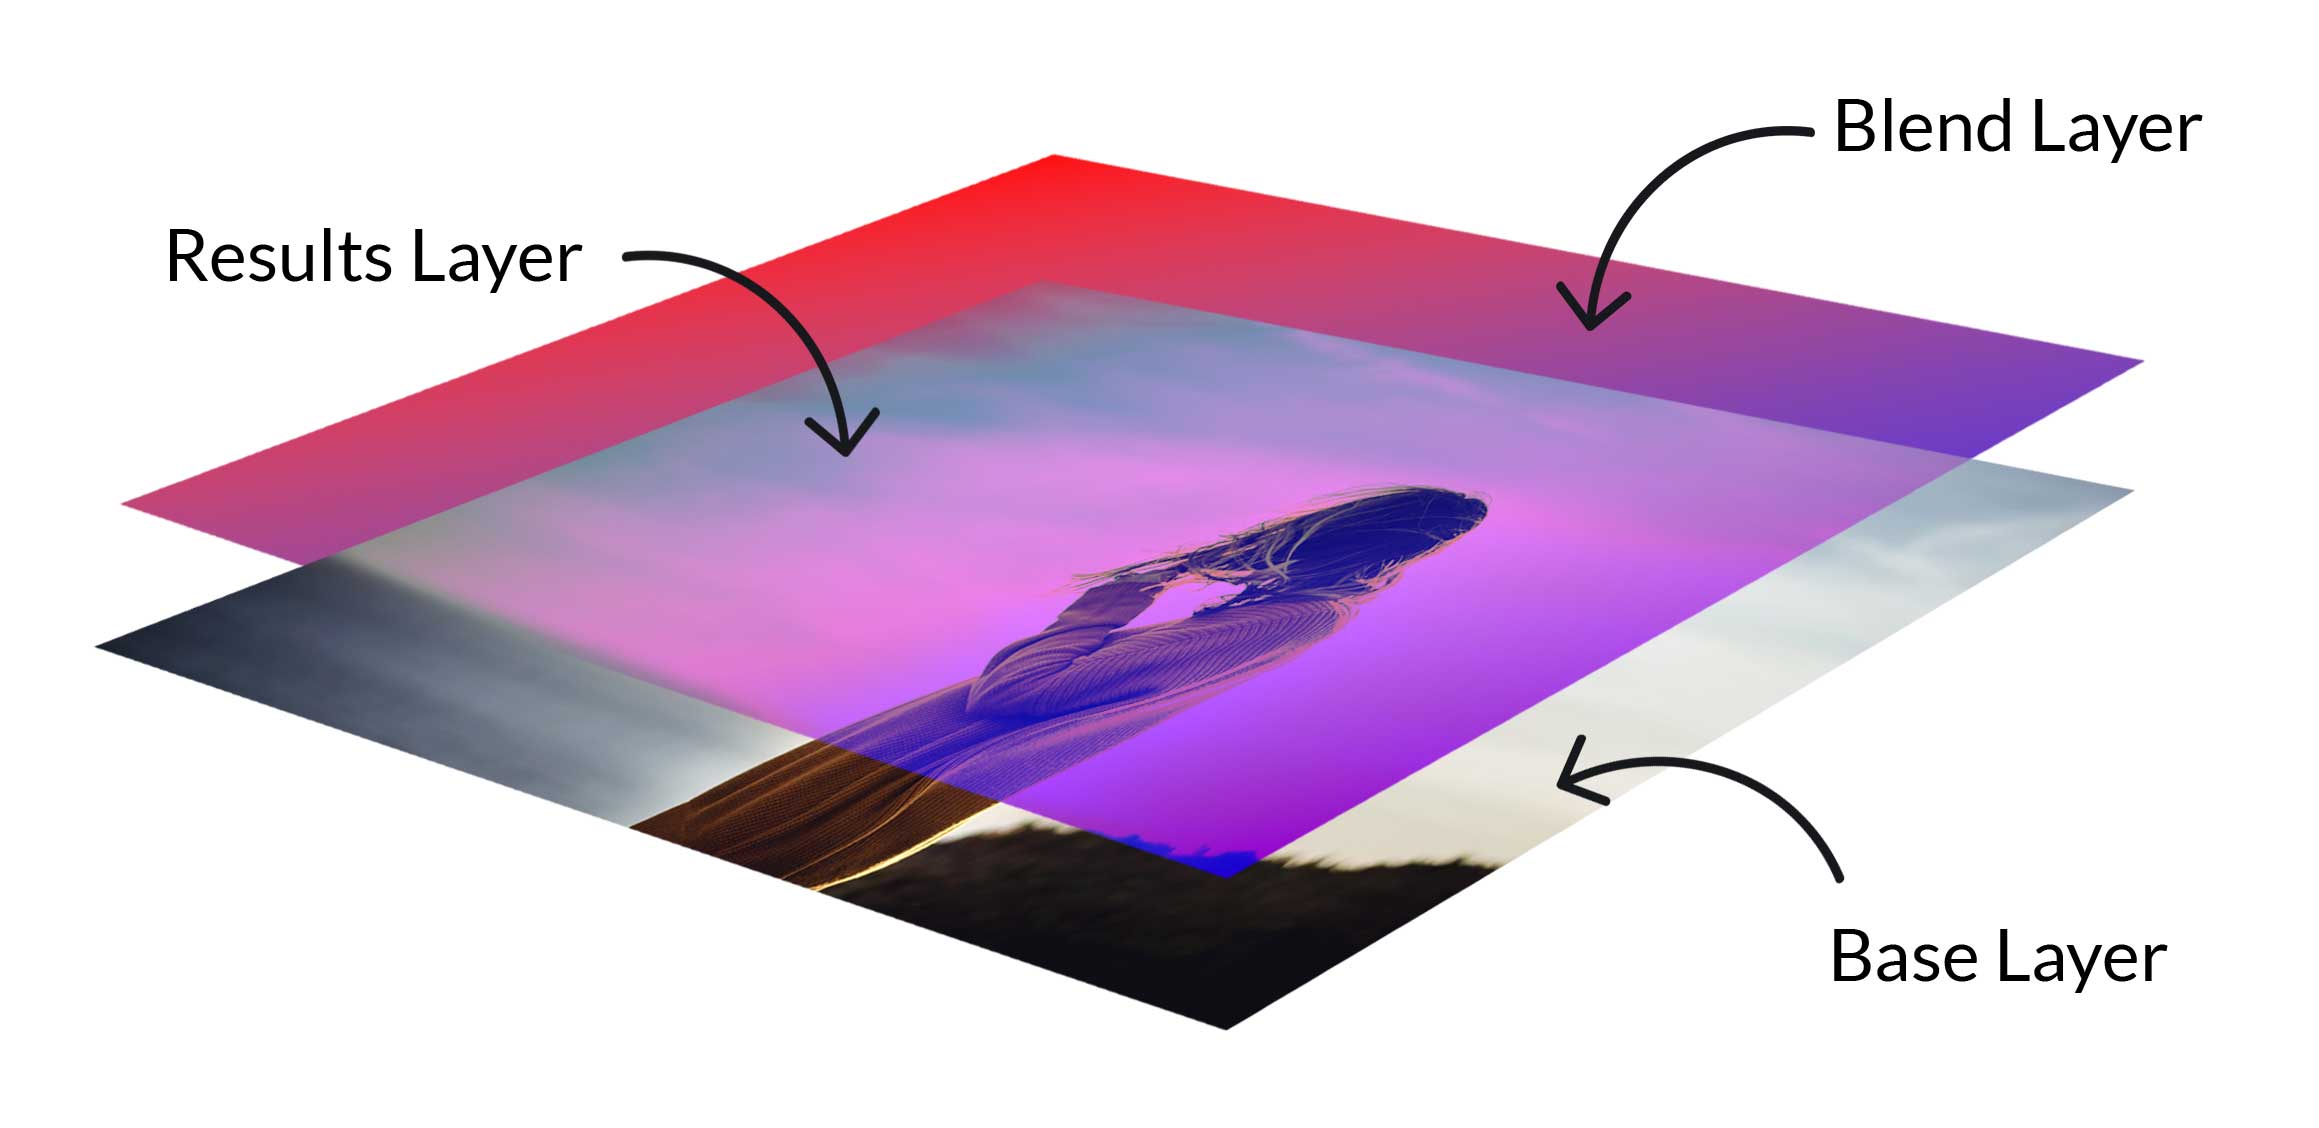
In this article, we'll dive deeper into blend modes, why they're important, how they're implemented, and how to use them in SwiftUI.
Blend Modes in SwiftUI
SwiftUI supports the following blend modes:
public enum BlendMode : Sendable {
    case normal
    case multiply
    case screen
    case overlay
    case darken
    case lighten
    case colorDodge
    case colorBurn
    case softLight
    case hardLight
    case difference
    case exclusion
    case hue
    case saturation
    case color
    case luminosity
    case sourceAtop
    case destinationOver
    case destinationOut
    case plusDarker
    case plusLighter
}
Blend modes can be applied to a variety of components, not just images. In SwiftUI, blend modes can be used with any view, including text, shapes, and even entire containers that hold multiple elements.
However, for simplicity sake, the examples in this article will just use an image.
Here's the SwiftUI setup I'll use to explore different blend modes:
struct ContentView: View {
    var body: some View {
        ZStack(alignment: .trailing) {
            Image("porsche")
                .resizable()
                .scaledToFill()

            Rectangle()
                .fill(Color.red)
                .frame(height: 178)
        }
        .frame(width: 533, height: 355)
    }
}
This results in the following starting image:

Normal
The normal blend mode displays the top layer as is, without blending it with the layer beneath. This is the default mode, ensuring each layer appears as intended.

So, by adding .blendMode(.normal) to the Rectangle, we get an identical image to our starting one:
Multiply
The multiply blend mode darkens the image by multiplying the color values [RGB] of the top and bottom layers. It's great for adding shadows and creating depth.

Since color values range from 0 to 255, multiplying both values and then dividing by 255 makes it easier to normalize the result within this range.

Screen
The screen blend mode lightens the image by combining the color values of the layers. It's useful for highlights and creating a glowing / dreamy effect.


Overlay
The overlay blend mode enhances textures by increasing contrast, darkening dark areas, and lightening light areas. It combines the multiply and screen modes, based on the pixel values of the bottom layer.


Hard Light
Hard light applies the same principles as overlay, but swaps the roles of the layers.
It increases contrast by considering the brightness of the top layer, making it ideal for dramatic lighting effects.
Both blend modes enhance contrast, but overlay focuses on the brightness of the bottom layer, while hard light focuses on the brightness of the top layer. Overlay is typically used to enhance textures and add depth, whereas hard light is favored for creating intense lighting effects and dramatic highlights or shadows


Color Dodge
Color dodge brightens the image by dividing the bottom color by the inverse of the top color. It creates vivid highlights, often used to add depth and realism.


Experimenting with blend modes in SwiftUI can significantly enhance your design's visual appeal. For more on the formulas behind these blend modes, check out this Wikipedia article:
 Contributors to Wikimedia projects
If you're interested in more articles about iOS Development & Swift, check out my YouTube channel or follow me on Twitter.
And, if you're an indie iOS developer, make sure to check out my newsletter! Each issue features a new indie developer, so feel free to submit your iOS apps.
Indie WatchSwiftUI makes creating animations a breeze, but sometimes you need a bit more control over how things move and animate.
In this article, we'll explore Animatable and AnimatablePair and we'll see how we can use these APIs to craft more advanced animations in our apps. But, before we do that, let's make sure we understand the problem it solves.
In the following code, whenever the user taps on the Rectangle, I want to animate the change in dimensions:
Hmm, do you see how the Rectangle just snaps to its new dimension without any animation? I'm using withAnimation and updating the width and height - what's going on?
When dealing with custom objects, such as a new Shape with a custom Path, SwiftUI doesn't know how to interpolate custom properties like width and height between their initial and final states.
To handle this, we need to use the Animatable protocol to explicitly tell SwiftUI how to interpolate these properties.
Animatable
Luckily for us, all Shape's in SwiftUI already conform to Animatable:
/// A 2D shape that you can use when drawing a view.
///
/// Shapes without an explicit fill or stroke get a default fill based on the
/// foreground color.
///
/// You can define shapes in relation to an implicit frame of reference, such as
/// the natural size of the view that contains it. Alternatively, you can define
/// shapes in terms of absolute coordinates.
@available(iOS 13.0, macOS 10.15, tvOS 13.0, watchOS 6.0, *)
public protocol Shape : Sendable, Animatable, View
/// A type that describes how to animate a property of a view.
@available(iOS 13.0, macOS 10.15, tvOS 13.0, watchOS 6.0, *)
public protocol Animatable {
/// The type defining the data to animate.
associatedtype AnimatableData : VectorArithmetic
/// The data to animate.
var animatableData: Self.AnimatableData { get set }
}If you are trying to synchronize animation between properties on other types, don't forget to make the type conform to Animatable.So, it would appear that all we need to do is tweak the implementation of animatableData.
Ultimately, I want to animate the width and height together, but I can only return one value (i.e. var animatableData: Double). So, let's see what happens when I modify just the width:
var animatableData: Double {
    get { width }
    set { width = newValue}
}With this addition, we finally have animation, but you'll notice that the change to the height is applied immediately and then the width is animated. Progress, I guess?
We're heading in the right direction, but since Animatable will only allow us to return one value - either width or height - we'll have to use another solution to animate these properties in sync.
AnimatablePair
If we want to synchronize the animation of the multiple properties together, we need to use AnimationPair instead:
/// A pair of animatable values, which is itself animatable.
@available(iOS 13.0, macOS 10.15, tvOS 13.0, watchOS 6.0, *)
@frozen public struct AnimatablePair<First, Second> : VectorArithmetic where First : VectorArithmetic, Second : VectorArithmetic
So, let's change our Animatable conformance to return an AnimatablePair instead of a Double:
var animatableData: AnimatablePair<CGFloat, CGFloat> {
    get {
        AnimatablePair(width, height)
    }
    set {
        width = newValue.first
        height = newValue.second
    }
}Great! The width and height are finally animating together!
Now, that we have a way of synchronizing the animation of 2 properties, we can start to build some really cool animations.
If you find yourself needing to synchronize more than 2 properties, you can extend AnimatablePair like this:
var animatableData: AnimatablePair<AnimatablePair<CGFloat, CGFloat>, CGFloat> {
    get {
        AnimatablePair(AnimatablePair(width, height), labelScale)
    }
    set {
        width = newValue.first.first
        height = newValue.first.second
        someOtherProperty = newValue.second
    }
}Morphing Shapes
Let's say you want to animate a Shape that morphs between a circle and a rounded rectangle. We can use AnimatablePair to help animate the cornerRadius and size simultaneously.
struct MorphingShape: Shape {
    var size: CGFloat
    var cornerRadius: CGFloat

    var animatableData: AnimatablePair<CGFloat, CGFloat> {
        get {
            AnimatablePair(size, cornerRadius)
        }
        set {
            size = newValue.first
            cornerRadius = newValue.second
        }
    }

    func path(in rect: CGRect) -> Path {
        let adjustedSize = min(size, rect.width, rect.height)
        let rect = CGRect(
            x: (rect.width - adjustedSize) / 2,
            y: (rect.height - adjustedSize) / 2,
            width: adjustedSize,
            height: adjustedSize
        )
        return Path(roundedRect: rect, cornerRadius: cornerRadius)
    }
}

struct ContentView: View {
    @State private var size: CGFloat = 100
    @State private var cornerRadius: CGFloat = 50

    var body: some View {
        MorphingShape(size: size, cornerRadius: cornerRadius)
            .fill(Color.green)
            .frame(width: 200, height: 200)
            .onTapGesture {
                withAnimation(
                    .spring(
                        response: 1.0,
                        dampingFraction: 0.5,
                        blendDuration: 1.0
                    )
                ) {
                    size = CGFloat.random(in: 50...150)
                    cornerRadius = CGFloat.random(in: 0...75)
                }
            }
    }
}Synchronizing Text
As we've already seen, there are several types of animations and transitions that do not have built-in interpolation mechanisms in SwiftUI and require the implementation of the Animatable protocol:
- Custom Shapes: If you create custom shapes with properties that need to animate (e.g., path points), you need to conform to
Animatableto provide smooth transitions. - Complex Property Combinations: When you have multiple properties that need to animate together, such as the position and size of a
Shape, or the corner radius and shadow radius of aView. - Non-Numeric Properties: Properties that are not inherently numeric, such as color components or certain
enumvalues, require custom interpolation. - Non-Standard Animations: Any non-standard or complex animations that involve more than simple position, size, rotation, or opacity changes typically require
Animatable.
This also extends to Text, where SwiftUI can easily animate properties like opacity or font size but struggles with animating the actual text content.
In this example, we aim to animate changes to the Text component's content.
Without using Animatable or AnimatablePair, SwiftUI defaults to a fade animation, which looks clunky:
Once we add Animatable and AnimatablePair, the animation looks much better, as SwiftUI can now use animatableData to accurately interpolate between the starting and ending values:
struct AnimatableTextView: View, Animatable {
    var value1: Double
    var value2: Double

    var animatableData: AnimatablePair<Double, Double> {
        get {
            AnimatablePair(value1, value2)
        }
        set {
            value1 = newValue.first
            value2 = newValue.second
        }
    }

    var body: some View {
        VStack {
            Text(String(format: "%.2f", value1))
                .font(.largeTitle)
                .foregroundColor(.red)
                .padding()
            Text(String(format: "%.2f", value2))
                .font(.largeTitle)
                .foregroundColor(.blue)
                .padding()
        }
    }
}

struct ContentView: View {
    @State private var value1: Double = 0.0
    @State private var value2: Double = 0.0
    @State private var animate = false

    var body: some View {
        VStack {
            AnimatableTextView(value1: value1, value2: value2)
            Button("Animate Values") {
                withAnimation(.easeInOut(duration: 2)) {
                    value1 = animate ? 100.0 : 0.0
                    value2 = animate ? 200.0 : 0.0
                }
                animate.toggle()
            }
        }
        .frame(width: 300, height: 200)
        .padding()
    }
}
If you're interested in more articles about iOS Development & Swift, check out my YouTube channel or follow me on Twitter.
And, if you're an indie iOS developer, make sure to check out my newsletter! Each issue features a new indie developer, so feel free to submit your iOS apps.
Indie WatchIn this post, we'll cover a bunch of handy aliases for Xcode, CocoaPods, Git, and more that will help make your workflow more efficient. These tips will help you spend less time context switching and more time coding.
ℹ️ We'll look at how to add
]]>
In this post, we'll cover a bunch of handy aliases for Xcode, CocoaPods, Git, and more that will help make your workflow more efficient. These tips will help you spend less time context switching and more time coding.
ℹ️ We'll look at how to add these to your .bashrc file at the end.
Disclaimer: I don't use or endorse all of these aliases equally - use whichever ones make sense to you.
Git
# Show the status of the working directory and staging area
alias stat='git status'

# Show a compact log of commits with a graphical representation of branches
alias glg='git log --oneline --graph --decorate'
# Display a compact log of commits with custom formatting
alias glp='git log --pretty=format:"%h - %an, %ar : %s"'

# List local branches
alias gb='git branch'
# List all branches, including local and remote
alias gba='git branch -a'

# Commit with a message
alias gcm='git commit -m'
# Commit all changes to tracked files
alias gca='git commit -a'
# Commit all changes to tracked files with a message
alias gcam='git commit -am'
# Amend the last commit
alias gcae='git commit --amend'

# Undo the last commit but keep the changes staged
alias gundo='git reset HEAD~1 --soft'
# Discard all changes and reset to the last commit
alias gtoss='git reset --hard'
CocoaPods
# Install the pods specified in the Podfile
alias podi='pod install'

# Install the pods and update the repo to ensure the latest versions are fetched
alias podiru='pod install --repo-update'

# Update all pods to the latest versions allowed by the Podfile
alias podu='pod update'

# Remove the Pods directory and Podfile.lock, then reinstall all pods
alias podnuke='rm -rf Pods Podfile.lock && pod install'
Derived Data
# Deletes the DerivedData folder
alias ddd='rm -rf ~/Library/Developer/Xcode/DerivedData/*'
iOS Simulator
# Erase all simulators
alias simerase='xcrun simctl erase all'

# Change a particular user default value
# Usage: simdefaults [APP_BUNDLE_ID] [DEFAULTS_KEY] [VALUE]
alias simdefaults='xcrun simctl spawn booted defaults write [APP_BUNDLE_ID] [DEFAULTS_KEY] [VALUE]'

# Open a deep link
# Usage: simdeeplink [URL_SCHEME] [URL_PATH]
# Usage: simdeeplink turo://search
alias simdeeplink='xcrun simctl openurl booted'

# Set location
# Usage: simlocation [LATITUDE] [LONGITUDE]
# Usage: simlocation 37.7749 -122.4194
alias simlocation='xcrun simctl location booted set [LATITUDE] [LONGITUDE]'

# Adjust privacy settings
# Usage: simprivacy [SERVICE] [ACCESS_LEVEL]
alias simprivacy='xcrun simctl privacy booted grant [SERVICE] [ACCESS_LEVEL]'

# Handle push notifications
# Usage: simpush [PAYLOAD_PATH]
alias simpush='xcrun simctl push booted [APP_BUNDLE_ID] [PAYLOAD_PATH]'

# Reset all user defaults for a particular app ID
# Usage: simresetdefaults [APP_BUNDLE_ID]
alias simresetdefaults='xcrun simctl spawn booted defaults delete [APP_BUNDLE_ID]'
I'm usually only working on one app at any given time, so I hardcode the aliases to include the relevant Bundle ID, URL Scheme, etc., so I only need to provide a value for the "last" parameter:
# Basic Alias
# Usage: simdeeplink [URL_SCHEME] [URL_PATH]
# Usage: simdeeplink turo://search
alias simdeeplink='xcrun simctl openurl booted'

# What I Use
# Usage: simdeeplink search (resolves to ....booted turo://search)
alias simdeeplink='xcrun simctl openurl booted turo://'
For easier testing of Universal Links and your Apple App Site Association file, check out:
Xcode Project Management
# Open the Xcode workspace file
alias xcworkspace='open *.xcworkspace'

# Open the Xcode project file
alias xcproject='open *.xcodeproj'

# Open the Xcode workspace if it exists; otherwise, open the Xcode project file
alias xcopen='open *.xcworkspace || open *.xcodeproj'
Misc.
alias .="cd .."
alias ..="cd ../.."
alias ...="cd ../../.."

alias cl="clear"
Adding Custom Aliases
When you start a new terminal session, your shell (Bash or Zsh) reads and executes the commands in the corresponding configuration file - .bashrc for Bash and .zshrc for Zsh.
If you want to customize your shell experience with custom commands, you'll need to add these aliases to those files.
If you're using the native Terminal app on your Mac, you'll want to edit the .zshrc file.- Open your
.bashrcor.zshrcfile:vim ~/.bashrcorvim ~/.zshrc - Paste your aliases at the end of the file.
- Save and reload the file:
source ~/.bashrcorsource ~/.zshrc
Those aliases should now be ready to use.
If there's any useful ones I've missed, shoot me a message on Twitter or at [email protected] and I'll add it here.
And, if you're an indie iOS developer, make sure to check out my newsletter! Each issue features a new indie developer, so feel free to submit your iOS apps.
Indie Watch