Not possible to debug a Flutter webapp in Chrome not started by DartCode #4208
Description
Per flutter/flutter#44263 I am launching a Flutter webapp with only the webserver running, open the url for the webapp in a specific Chrome window (ie. I want to use a Chrome window for a specific Chrome profile which is logged into a specific Google account) and then able to use the VSC debugger to debug the running Flutter webapp.
I'm using this launch config:
{
      "name": "My App Web (no browser launch)",
      "request": "launch",
      "type": "dart",
      "deviceId": "web-server",
      "program": "lib/main_preview.dart",
      "toolArgs": [
        "--start-paused",
        "--dart-define",
        "MYAPP_X_MODE=true",
        "--web-port=42424",
      ]
    },
And it all seems to work, hot-restart works and I can set and hit breakpoints, but when I hit a breakpoint, in VSC it doesn't jump to the source file location where the breakpoint is set as it normally would. I do still see the variables view correct information and if I manually go to the source where the hit breakpoint is set it shows the way I expect:

and likewise in the BREAKPOINTS window:

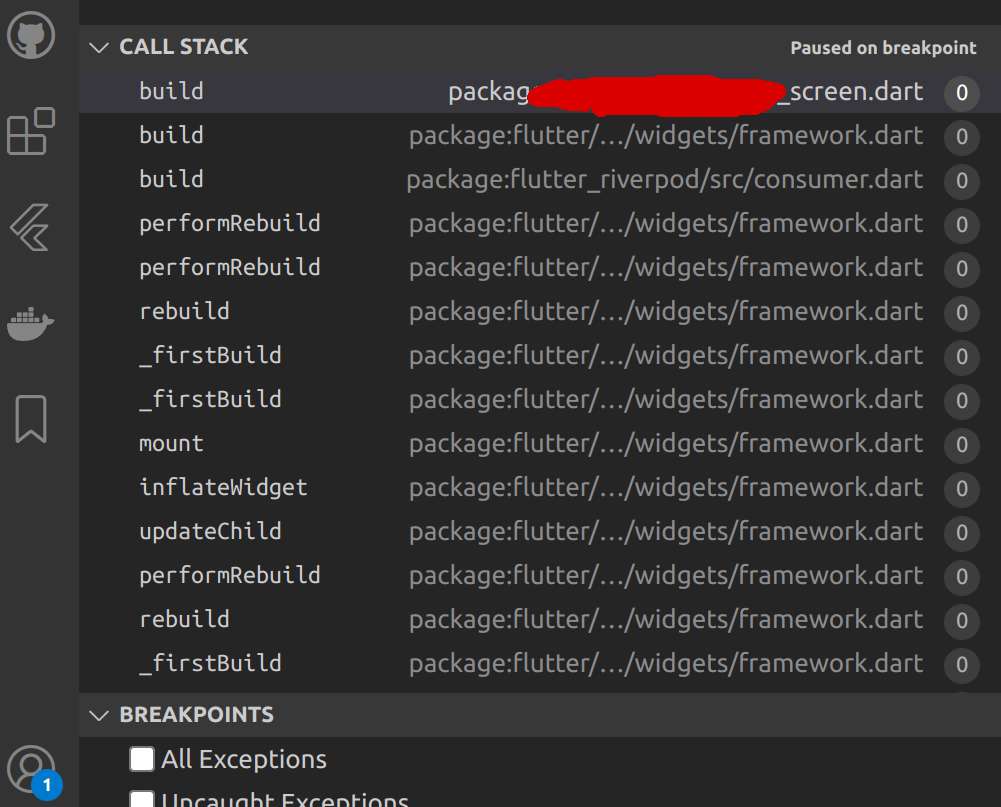
Also I do note that the CallStack window looks a bit strange with the just all zeros at the end of each frame line:
Please complete the following information:
- Operating System and version: Ubuntu 22.04
- VS Code version: 1.71.2
- Dart extension version: 2.18.1
- Dart/Flutter SDK version: 3.3.3
- Target device (if the issue relates to Flutter debugging): Chrome 106.0.5249.91