BITCOIN — Liquidity Sitting Below Trendline Bitcoin is compressing into a rising trendline while failing to reclaim the 72K supply zone. Momentum is fading, and the structure is tightening a classic liquidity setup. Retail sees a clean uptrend. Smart money sees resting stops below 71K.
If price breaks and closes below the ascending support,

The best trades require research, then commitment.
Get started for free$0 forever, no credit card needed

Scott "Kidd" PoteetPolaris Dawn astronaut

Where the world does markets
Join 100 million traders and investors taking the future into their own hands.

Now is the turn of FMCGBritannia 5808
Elliott- I am sure the rally is corrective. And has to be sold.
Directional Signal- double top is a directional signal. The mid point is at 4450. Hence this is the minimum tgt. This is some 23% down. The real danger will be the break of the mid point at 4450. The tgt for the same

3 Macro Patterns BTCSince BTC created a Bullish Divergence on the daily time frame, Now 3 patterns are building
1. BTC is already breaking the Local resistance, might test the Key Level Supply, which is at 80k.
Retest the flag and continue upwards. - Probablity 30%
2. Completes the bear flag and rejects at 75 - 76k

ICICI BANK - Bounce OR Break-DownCMP 1254
ICICI Bank – Daily Chart Technical View
💮Pattern: Bearish Head & Shoulders
- Left Shoulder: ~1330–1345
- Head: ~1485
- Right Shoulder: ~1380–1400
- Neckline Support: 1225-1195
〽️ Interpretation:
The structure indicates a potential trend reversal after an extended uptrend. The formation o

NTPC green has given breakout from the falling channelPrice has given breakout from the falling channel as well as it has broken the previous swing high.
So the target can be 113.94 but before this, resistance at 106 is there, if it breaks 106, it may go to 113.94
As the breakout candle is very big, it can retest the breakout level. And it is too risky

AVENUE SUPER MARKET-Likely Tri-Angle BreakoutAVENUE SUPER MARKET
Trading at 3989 levels and is about to give 10DEMA Golden crossover Vs 20,50,100 DEMA in daily chart.
Has formed a Tri-angle pattern in daily chart.
Breaking above 4000 expect a move towards 4100-4200(for educational purpose only)

Dr. Reddy’s Breakout Setup | Buy Zone ₹1325–₹1340Educational Disclaimer:
This analysis is shared only for educational purposes . I am not a SEBI-registered investment advisor . Please do your own research before making any investment decisions.
Dr. Reddy’s Laboratories – Breakout Watch 👀
Dr. Reddy's Laboratories is trading near a major res

BRENT CRUDE OIL – WEEKLY CHART ANALYSIS1️⃣ Trend Structure (Big Picture)
From 2022 high (~131) crude entered a long correction phase.
Price kept making lower highs and lower lows until early 2026.
Recently price bounced strongly from the major demand zone near 58–60.
Now price has broken the falling trend structure and moving average

Aurobindo Pharma – Ascending Triangle BreakoutThe stock has been in deep consolidation for over a year, forming an ascending triangle structure on the daily timeframe.
Key observations:
• Multiple tests of the resistance zone
• Gradually rising demand trendline
• Long consolidation indicating supply absorption
Price has now broken above the

Market at the Edge: Nifty’s Trendline Could Decide the FutureThe weekly chart of Nifty currently reflects a market standing at an important crossroads where technical structure and global macro risks are beginning to intersect. Over the past few years, Nifty has maintained a strong bullish trajectory supported by a rising long-term trendline. This ascending s

See all editors' picks ideas
PineScript integration with Notepad++ (UDL)THIS IS NOT AN INDICATOR!
This is PineScript integration with Notepad++ text editor (NPP). It supports PineScript v6 as of January 2026. Provides autocompletion, function list and syntax highlighting for *.pine files.
Why would anyone need this?
Pine Editor doesn't provide function list yet
Pi
Pine Script® indicator

Machine Learning Pivot Points (KNN) [SS]Hey everyone,
Been working on this one for a very long time.
1. What It Is: The Geometric DNA of a Pivot
Machine Learning Pivot Points (KNN) is a predictive structural tool that moves away from traditional lag based oscillators. Instead of waiting for a moving average crossover, this system t
Pine Script® indicator

Market Structure Volume Profiles [Kioseff Trading]Hello traders and friends!
Introducing: "Market Structure Volume Profiles".
This script combines market structure with volume profiling and CVD to show how volume develops inside each structural changes of the market.
Instead of building one continuous profile across a session, this script create
Pine Script® indicator

Liquidity Thermal Map [BigBeluga]🔵 OVERVIEW
Liquidity Thermal Map visualizes where the highest traded volume has accumulated across price levels over a fixed lookback period.
Instead of plotting classic volume profiles with bars, the indicator builds a horizontal thermal heatmap directly on the chart, highlighting areas of
Pine Script® indicator

VIX Curve Pro - Real-Time Term Structure with StatisticsThis indicator displays the VIX term structure as a spatial curve directly on the chart, allowing you to instantly identify whether the volatility market is in contango or backwardation.
It shows the relationship between different VIX maturities (9D, 30D, 3M, 6M, 1Y) as a single curve.
It also sh
Pine Script® indicator

Stop Loss Cascades (Breakouts) [Kioseff Trading]Hello friends and traders!
🔹Introduction
This indicator " Stop-Loss Clustering (Breakouts) " attempts to model trader stop-loss placement logic and identify price areas where a large amount of stop losses might cluster.
The idea is, if stop losses are indeed highly concentrated in a specific are
Pine Script® indicator

Swing Profile [BigBeluga]🔵 OVERVIEW
Swing Profile is a dynamic swing-based volume profiling tool that builds a complete volume profile for each completed market swing.
Instead of using fixed sessions or time ranges, the indicator anchors its profile strictly between confirmed swing highs and swing lows, allowing tra
Pine Script® indicator

[MAD] Gann o MaticusGannomat — Full Automated Gann Grids & Astro Cycles
Automatic Gann quadrant boxes with geometric arc projections. Cycle boundaries from standard timeframes or real planetary astronomy.
Thanks BarefootJoey, master of Astrolib
What Does This Indicator Do?
Gannomat draws a Gann quadrant box
Pine Script® indicator

Breakout Volume Delta | Flux ChartsGENERAL OVERVIEW:
Breakout Volume Delta is an indicator that measures breakout strength using lower-timeframe volume delta. It estimates buyer vs. seller participation within the breakout candle by summing bullish and bearish sub-candle volumes, then visualizes that dominance by splitting the candl
Pine Script® indicator

HTF Floating Candles w/ Volume Footprint [theUltimator5]This indicator is designed to pull higher-timeframe candles outside of the chart, and add the footprint volume data to give a complete snapshot of the Higher Timeframe (HTF) trading range and volume data without cluttering your view.
IMPORTANT!
This uses the new request.footprint() call, which ma
Pine Script® indicator

See all indicators and strategies
Community trends
Chart of the Week: Breakout Setup in Kirloskar Oil Engines?After a prolonged period of consolidation, Kirloskar Oil Engines is starting to look technically interesting.
Fundamental Tailwind
The company recently reported strong Q3 FY26 results:
• Revenue growth: ~29–35% YoY
• Net profit growth: ~56–61% YoY
Such strong earnings momentum often acts as

Buy Hindunilvr (Wave C of zigzag completion).
Hindunilvr has been undergoing larger degree correction since Sep 24 following a major wave completion.
The stock completed Wave A (of Zigzag) as a 5-wave sequence on 4 Mar 25 and completed Wave B, i.e. counter wave on 4 Sep 25, as an impulse wave.
As per EWP, Wave C has to make a lower low or an

BHARTIARTL: The ABC Correction Meets a Massive Demand Zone!Bharti Airtel is currently putting on a masterclass in Elliott Wave Theory. After completing a classic 5-wave impulsive rally to the 2,200 level, we have seen a textbook ABC Corrective Pattern play out.
The Wave Breakdown:
Wave 5 Peak: Signaled the end of the macro bullish trend.
Wave (A) & (B):

Now is the turn of FMCGBritannia 5808
Elliott- I am sure the rally is corrective. And has to be sold.
Directional Signal- double top is a directional signal. The mid point is at 4450. Hence this is the minimum tgt. This is some 23% down. The real danger will be the break of the mid point at 4450. The tgt for the same
Swing scenario ... NTPCGREEN NTPCGREEN has broken trendline, formed double bottom at demand zone, price has shown acceleration supported by strong volume. All this combined show higher probability of bullish flow change.
Price should return to accumulation zone and take flight to sky.
Please do follow me if you liked the idea

Maruti at a Critical Trendline – Bounce or Breakdown?Markets often look random on lower timeframes, but when you zoom out, structure begins to reveal itself. The chart of Maruti Suzuki India Limited is a perfect example of how price respects structure over long periods of time.
Since 2020, the stock has been advancing within a well-defined rising tre

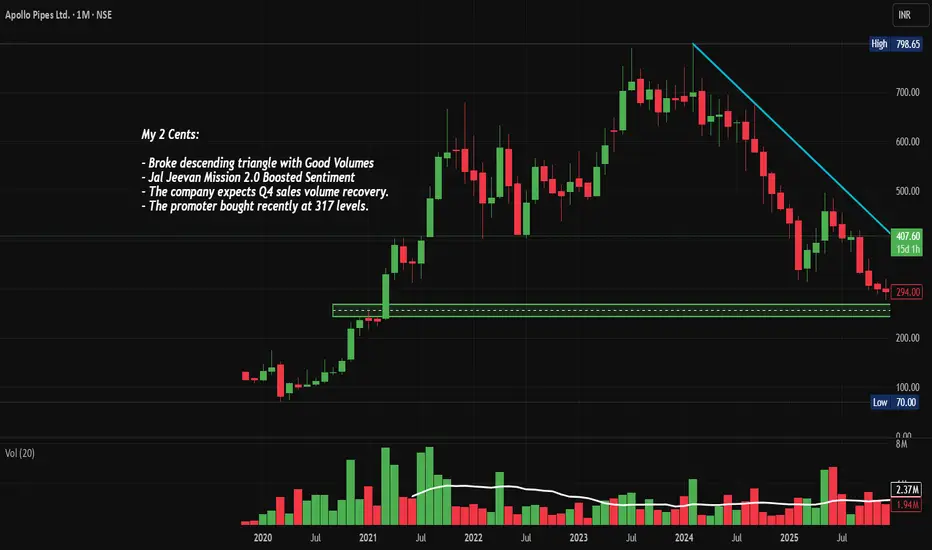
APOLLOPIPE: Descending Triangle Breakout, Chart of the WeekApollo Pipes Just Broke Out of a 2-Year Descending Triangle on Record Volume. Let's understand it in detail in the "Chart of the Week"
As per the Latest SEBI Mandate, this isn't a Trading/Investment RECOMMENDATION nor for Educational Purposes; it is just for Informational purposes only. The char
BAJFINANCEBAJFINANCE is looking attractive at current price zone. RSI is also at oversold zone (24). Considering it for short - Mid term move with upside potential of 11 - 12 %.
Target 1 : 925 RS
Target 2 : 965-975 Rs
Disclaimer : The Above shared Content is for information and education purposes only and sh

Positional or Longterm Opportunity in AIILGo Long @ 488.5 for Targets of 543.7, 598.9 and 654.1 with SL 433.3
Reasons to go Long :
1. On Weekly timeframe If we draw Fibonacci retracement from the recent swing low (A) to the swing high (B) then the stock took support from the 0.5 Fibonacci level.
2. The stock formed a Bullish Engulfing Pa

BUY TODAY SELL TOMORROW for 5% DON’T HAVE TIME TO MANAGE YOUR TRADES?
- Take BTST trades at 3:25 pm every day
- Try to exit by taking 4-7% profit of each trade
- SL can also be maintained as closing below the low of the breakout candle
Now, why do I prefer BTST over swing trades? The primary reason is that I have observed t

See all stocks ideas
No scheduled reports
Community trends
BITCOIN — Liquidity Sitting Below Trendline Bitcoin is compressing into a rising trendline while failing to reclaim the 72K supply zone. Momentum is fading, and the structure is tightening a classic liquidity setup. Retail sees a clean uptrend. Smart money sees resting stops below 71K.
If price breaks and closes below the ascending support,
ETH USD opinion and current price action. ETH/USD is currently in a bearish phase but appears to be showing a minor pullback. If the price sustains above 2089, and remains within the 2062–2095 range, an upswing toward the 2500 level could be achieved. Therefore, with a stop-loss at 2060, this setup presents a very high-probability trading o

BTC long is 80k expected soon?Currently BTC price is in second leg of expansion from 66k.
The previous expansion leg was 64000 to 74000 and with deep retracement till 66000. Market swept the SellSide liquidity consolidation near that zone and not expansion towards 74000 again. Most likely with cup and handle formation the price

3 Macro Patterns BTCSince BTC created a Bullish Divergence on the daily time frame, Now 3 patterns are building
1. BTC is already breaking the Local resistance, might test the Key Level Supply, which is at 80k.
Retest the flag and continue upwards. - Probablity 30%
2. Completes the bear flag and rejects at 75 - 76k
BTC Pullback Into Demand Zone
Bitcoin is currently retracing after a strong impulsive rally that created a change of character (CHOCH) and confirmed a bullish market structure. Price has now pulled back into the **key demand zone around 71,000 – 71,300**, which previously acted as a breakout area. If this zone holds, it could

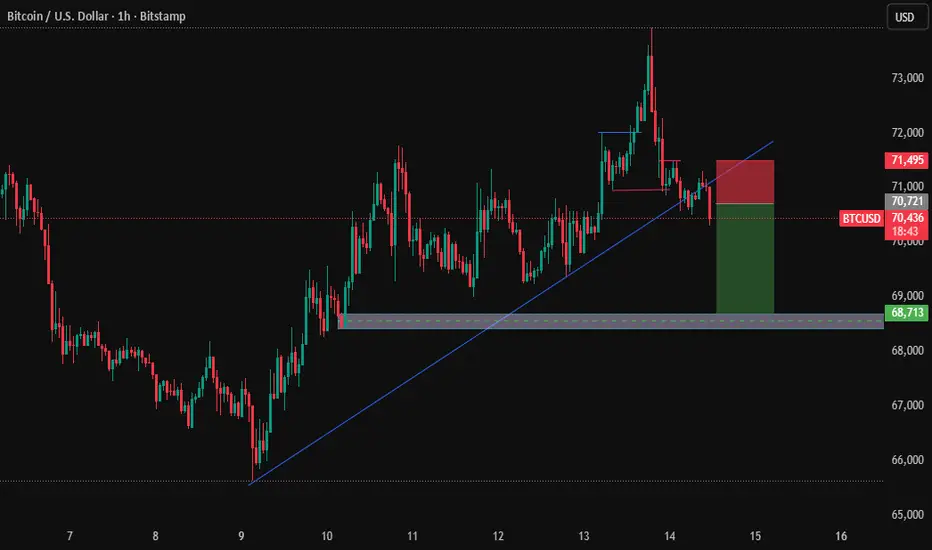
BTC Breakdown: The Trendline SnapTechnical Analysis Breakdown
Trendline Violation: The primary diagonal support, which held firm since the March 9th lows, has been decisively broken. This shift in market structure suggests that the previous bullish momentum has exhausted.
The Bearish Setup: A short position is currently active (in
Bitcoin Bybit chart analysis MARCH 16
Hello
It's a Bitcoin Guide.
If you "follow"
You can receive real-time movement paths and comment notifications on major sections.
If my analysis was helpful,
Please click the booster button at the bottom.
This is the Bitcoin 30-minute chart.
There are no Nasdaq indicator releases today.
Th

BTC/USDFrom the chart of Bitcoin (15-minute timeframe), the marked trade setup shows a short position.
Trade Levels:
Entry: 71,449
Stop Loss: 71,752
Target (Take Profit): 70,832

Bitcoin 15m Structure: Market Deciding Direction Here!When I look at this 15-minute structure, it feels like the market is simply pausing and deciding what to do next. Price recently moved down from the local high and now it is approaching a key demand zone that has acted as support before.
This area matters because many times the market shows its rea

BTC/USDT (Bitcoin) – 45-Minute ChartMarket Structure Overview
On the 45-minute timeframe, BTC/USDT is currently trading within a well-defined horizontal range following a strong bullish impulse that pushed price into a key resistance zone. The chart shows a clear distribution structure near the upper boundary, suggesting that bullish

See all crypto ideas
Gold Trading Strategy for 16th March 2026📊 GOLD TRADING SETUP 🟡
💰 Instrument: Gold
📅 Intraday Strategy
🟢 BUY Setup
👉 Condition: Buy above the high of the 1-hour candle and wait for a strong close above $5052
📈 Targets:
🎯 $5065
🎯 $5078
🎯 $5093
💡 Idea:
If gold breaks the 1-hour resistance zone and closes above $5052, it may signal stron

Bearish on Gold / XAUUSDGold looks Bearish in Short Term.
Trade Idea: Short Below 4947 SL 4990 Target 4836

Bearish Structure with Support Rebound Setup1️⃣ Market Structure
The chart of Gold Spot / U.S. Dollar (XAUUSD) on the 45-minute timeframe shows a clear shift from consolidation to bearish structure.
Key observations:
Price previously ranged around 5,120–5,160.
A descending channel formed after the peak near 5,230–5,240.
The market is pri

Gold (XAUUSD) Trade AnalysisTrade Setup
• Entry: 4942
• Stop Loss: 4912 (30 points risk)
• Take Profit: 5032 (90 points target)
• Risk–Reward: 1:3
Gold is currently approaching a strong higher-timeframe demand zone around 4940–4950, where price previously showed aggressive buying interest. After the recent sell-off, price h

Gold may continue to make new lows next week✅ 4H Trend Analysis
The price previously reached a high near 5238 before forming a continuous downward structure, with the lowest point falling to around 5009. The price has already broken below MA10 and MA20, indicating increasing bearish pressure.
From the Bollinger Bands, the price is trading ne

Gold Analysis (1H Chart)- On a 1H time frame, the prices are consolidating within a descending triangle pattern.
- The prices have recently tested & took support of the lower trendline of the triangle.
- A bullish pullback in gold cannot be avoided, which will drive the prices towards the fib retracement zone between 0.

XAUUSD with the falling wedge pattern, It could be reversal week for Gold against Dollar, where it has a falling wedge pattern , last week bearish finishing would change after taking liquidity at 4990 , then it would look for the sellers waiting at the last week high of 5237 zone,
let see,
Not a financial advice for trading, just for

GOLD PLUNGING TO 4.850-4,890 NEXT WEEK - KEY REASONS!!Current price ~$5,020/oz, strong bearish momentum in play.
Macro factors (simple breakdown):
US rates high + Fed hawkish: Solid US economy, inflation still sticky, strong jobs data → Fed not rushing to cut rates (possibly hold until summer 2026), even more hawkish due to oil spike risks from I

USOIL Latest Trading Strategy⛽ Fundamentals:
Geopolitical conflicts in the Middle East persist, supporting oil prices on supply concerns. However, prices have risen excessively in the short term; IEA oil reserves release adds downward pressure, increasing the risk of a pullback from high levels with extreme volatility.
📉 Techn

Weekly Analysis with buy/Sell scenarios in Gold/XAUUSD👋👋👋 Friends, What's your view on Gold???
Last week, gold (XAUUSD) traded with high volatility and a corrective bias, slipping for the second consecutive week and hovering near the $5,000–$5,050 zone after failing to sustain earlier highs above $5,200, as a stronger U.S. dollar and rising inflation

See all futures ideas
USD/JPY Structured Trend and 160 Intervention RiskThe 4H chart shows that USD/JPY is moving in a structured step-trend pattern, where each bullish impulse is followed by a predictable retracement before the next leg higher.
Measured moves on the chart:
Upswing Retracement
+1.95% −1.08%
+1.85% −0.81%
+1.56% −0.97%
+1.58% −1.02%
+1.57% (current leg)

Rounding Top Pattern Overview
The chart shows a Rounding Top formation, a classic bearish reversal pattern where bullish momentum gradually fades and the market transitions from an uptrend to a downtrend.
⸻⸻⸻⸻⸻⸻⸻⸻⸻⸻⸻
Concept
A Rounding Top develops when price slowly shifts from buying dominance to selling pressure.

BULLISH MOVEPrice has broken the bearish liquidity trendline and is heading up. A short retracement to the support is a good sign for buys

EURJPY Multi Time-Frame Analysis Hi traders, this is the complete multi-time frame analysis for this pair. Please feel free to ask any questions in the comment section below. The entry will only be made if all strategy rules are met.

USD/CHF Moves Limited Amid Strait of Hormuz ProspectsUSD/CHF broke its four-day winning streak, trading around 0.7890 during the Asian session.
This decline was triggered by a broad-based weakening of the US dollar as risk-aversion sentiment eased following US diplomatic and military efforts to secure global energy trade routes.
✅ Geopolitical Facto

GBPUSD Long Setup – Potential Reversal from Support ZoneTrade Setup
Entry: 1.31976 (Long)
Stop Loss: 39 pips
Take Profit: Minimum 1:2 Risk-Reward (≈ 78 pips or higher)
The GBP/USD has experienced a sharp bearish move and is now approaching a key demand/support region around 1.3197. After the strong sell-off, price is entering a zone where liquidity and

EURUSD ANANTMONEY VIP BROADCAST *💎 EURUSD WEEKLY SIGNAL RESULTS 💎*
📅 9-03-2026 to 13-03-2026
━━━━━━━━━━━━━━
📌 9-03-2026
➡️ EURUSD BUY
✅ 130 PIPS PROFIT
📌 10-03-2026
➡️ EURUSD BUY
✅ +60 Pips Profit
📌 11-03-2026
➡️ EURUSD SELL
✅ +70 Pips Profit
📌 12-03-2026
➡️ EURUSD SELL
✅ +100 Pips Profit
➡️ EURUSD BUY
✅-20 Pips LOSS
📌 13-0

EURUSD | Retracement Into Supply – Short SetupAfter a strong impulsive sell-off, EURUSD is currently making a corrective pullback into a key supply zone around 1.1485 – 1.1500. This region previously acted as a distribution area and aligns with the current lower high formation within the bearish structure.
Price has now tapped into the refinem

USDCAD SHOWING A GOOD UP MOVE WITH 1:10 RISK REWARDUSDCAD SHOWING A GOOD UP MOVE WITH 1:10 RISK REWARD
DUE TO THESE REASON
A. its following a rectangle pattern that stocked the market
which preventing the market to move any one direction now it trying to break the strong resistant lable
B. after the break of this rectangle it will boost the market

See all forex ideas
Trade directly on Supercharts through our supported, fully-verified, and user-reviewed brokers.


