I recently needed to speed up a simple read query on a large SQLite file (620Mb), for my grocery price CSV export tool.
If you are in the same position, here is a list of things to try. Click to skip the writeup and go to potential solutions.
Background – my specific challenge
My table structure and SELECT query was very simple. The database was going to be used for read-only access, without worrying too much about the integrity of the SQLite file (as it was re-created each day).
The database consisted of:
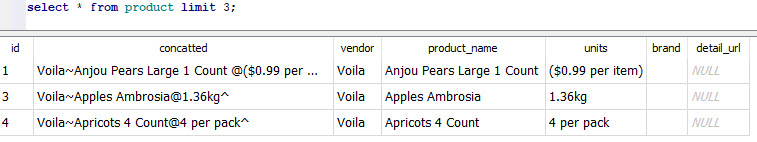
A “product” list with product name, vendor and brand. 120 thousand rows.
A “raw” time-series table representing the daily price for each product_id. 9 million rows.
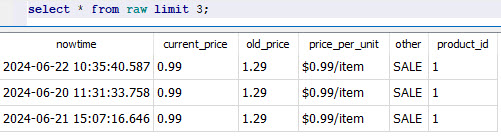
A typical SQL query is below. And there was an index on raw.product_id.
SELECT nowtime, vendor, product_id, product_name, brand, current_price, old_price, units, price_per_unit, other
	FROM raw
	INNER JOIN product
	ON raw.product_id = product.id
	WHERE product.product_name LIKE '%bread%' OR product.brand LIKE '%bread%';
The problem
On my shared hosting, the query took a whopping 40 seconds to return the same results on the first run. If you re-ran the query, it took only 8 seconds on the server. On my personal laptop, that query took 198 milliseconds to return 215,000 rows.
Why was the first-time run so slow?
Spoiler: eventually I decreased the runtime of the SELECT + result fetching operation from 40 seconds to 13 seconds with the following pragmas. However, most of the speedup was due to rearranging row data within the SQLite file.
PRAGMA journal_mode=OFF;
PRAGMA synchronous=OFF;
PRAGMA mmap_size=3000000000;
PRAGMA temp_store=2;
PRAGMA query_only;
Note: I believe the query_only pragma only helps with proper error reporting, rather than speed of execution. But wanted to include it here just in case.
How to speed up SQLite reads
The problem turned out to be related to the slow hard-drive on my web host, and a phenomenon called a “cold start”.
Concept: the “cold start”
As discussed on this thread, the first time SQLite runs, it stars from a “blank slate” – none of the file data has been loaded into memory yet. So SQLite depends on the operating system to load content from disk to memory.
On the second run, all of that file content from before is still resident in the operating system’s memory cache. So the subsequent queries are much faster than the first. This explains why the first time I ran a query, it took 40s, and the second only took 8s.
The file’s contents go out of the memory cache after some time without access. If you are using CPanel, this phenomenon will appear in the “Resource Usage” page like the picture below. The yellow arrows highlight when an SQLite query is run – the OS loads a big portion of the file into memory and then gradually frees up that memory.

For more details on disk caching in memory, see https://www.linuxatemyram.com/
The slow disk bottleneck
Your hard disk’s speed is a critical bottleneck, because the SQLite database is just a file on disk.
How fast was my server’s disk vs. my personal laptop’s disc?
I have a solid-but-basic account at HawkHost (affiliate link) and it throttles disk access to 15MB/sec despite being an “SSD”:

On my laptop’s SSD, the average speed is 882.6MB/sec – 58 times faster than the server.
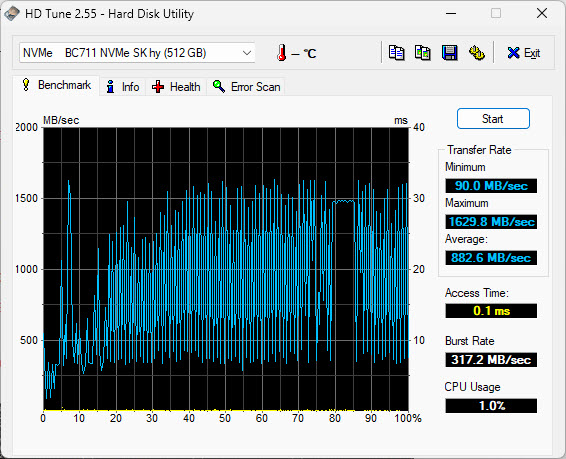
This difference in hard drive speed explains why the query took so long to return the results on the server: physically seeking and retrieving the result rows took more time because of how slow the server disk was.
This is worth repeating: from benchmarking my application, I could see that the SELECT query was completing quickly (thanks Indexes!) – but the fetcing of the result rows was very time consuming.
Speedup solutions
Create proper indexes + ANALYZE
The simplest optimization is to make sure you’re creating the right indexes in SQLite for your time-consuming queries (fantastic tutorial by Jason Feinstein).
Note: your index will take up extra space in the SQLite file. It is like its own table. You can use the sqlite3_analyzer.exe utility program that comes with SQLite in order to see just how much space the Index takes up. Note how an index on an INT field on the RAW table with 8mil rows takes up 16.8% of the entire file by size:
*** Page counts for all tables and indices separately ***

RAW............................................... 120457      77.6%
RAW_PROD_ID....................................... 26032       16.8%
PRODUCT........................................... 6414         4.1%
SQLITE_AUTOINDEX_PRODUCT_1........................ 2245         1.4%
SQLITE_SCHEMA..................................... 1            0.0%
SQLITE_STAT1...................................... 1            0.0%
After you’re done creating your index, run the ANALYZE SQL statement. This will update the “query plan” for looking up data to consider the latest available resources. I found that SQLite will quietly ignore the index if you don’t run ANALYZE.
Q: How do I know that SQLite was ignoring the index?
A: Run EXPLAIN QUERY PLAN (also addressed in Jason’s writeup about indexes)
What worked for me: rearranging your data on the disk
What ultimately sped up my queries was figuring out in what order SQLite will fetch the result rows for my queries, and to rearrange the data in the file itself so that result rows are likely to be near each other.(This is similar to creating a “Clustered Index” on other SQL engines, but SQLite doesn’t support this feature natively.)
Let me get more specific:
The query I was optimizing was looking for products that contained the word “bread” in their name or brand. Then, it would return any entries from the “raw” table that matched the same products.
The problem with the “raw” table was that it was arranged in chronological order – sorted by the date stamp by default.
Imagine you are the SQLite engine, trying to fetch all rows for product ID 1554. You would use the index to find out where, in the database file, all those entries are located. The first row would’ve been fetched on June 5th, and would be located in the middle of a pack of other product rows that were fetched on that day. To get that one row of data, you’d read an entire “page” (4,096 bytes) from file into memory. After that, the next entry for product 1554 would be found in the middle of a pack of rows fetched on June 6th. You’d fetch a whole bunch of data to get at that 1 row… and repeat and repeat and repeat.
The solution that worked for me was to position all the rows for “product 1554” near each other. To stop storing them in chronological order on disk. That way when you read in the first product entry, that samee block of 4,096 bytes will also contain the next several rows that you’re looking to fetch.
The way to rearrange the rows is to create a new table, and by SELECTing your existing table’s entries into it with an ORDER BY <field> ASC condition. As explained in this post by Andrea B. on Stackoverflow.
The runtime went from 40 seconds to 17 seconds on the first query.
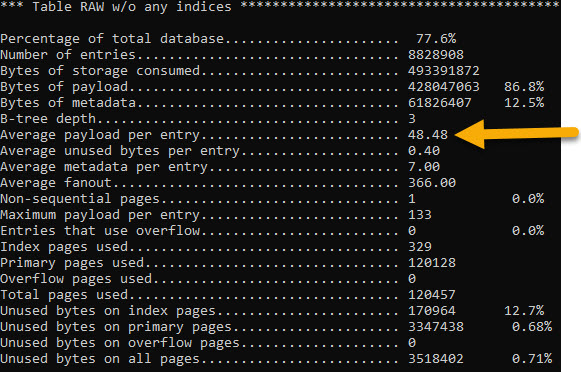
Bonus: how many rows fit within one 4,096 “page” of data? The sqlite3_analyzer.exe program can tell us. On the “raw” table, it shows that an average row takes up 48.48 bytes on disk. So that’s roughly 84 rows that are grabbed in a single disk “read” operation.
Rearrange the column order within a row
If you are storing large amounts of data in each row – close to the “page” size of 4Kb – then you might benefit from rearranging column order within your table definitiion.
That’s because you might be hitting a situation where fetching a single row requires more than 1 disk read operation. In those cases, a second (or third) read operation happens in order to get the full record. If your row contains several short “metadata” columns and a big “content” column, then it’s better to have those fields defined first – an SQL query might get the needed metadata in the first “page” and avoid reading all the pages that represent 1 row.
“erkiferenenc” on this Reddit thread has a great explanation.
Try: increasing page size
The page size is a kind of “block” unit in which SQLite stores rows within it’s file. Just like your filesystem’s block size. My understanding is that the SQLite page size should be equal to your filesystem’s block size.
To figure out the filesystem block size, try runningstat -fc %s .
If you’re creating the SQLite file on one operating system but using it on a server that runs another, there’s a chance that they could have different default block sizes. In that case, you’ll need to set the block_size to match your <target> system.
The page_size pragma applies at DB creation time. After running it, you need to run VACUUM immediately after for your change to register.
Try: opening the SQLite file in immutable mode
When you open an SQLite file, you can specify a variety of “URI parameters” that change the way the file is treated. In Python, this looks like:
sqlite3.connect( 'file:myDB.sqlite?immutable=1', uri=True )You can read about the available SQLite URI parameters here. Especially, take a look at “mode” which allows you to open the DB in ‘read-only’ or ‘read-write’ mode…
If your app uses the SQLite file for read only operations, you can try opening the file with the immutable=1 parameter. “Immutable” means that your app will not modify the SQLite file and assumes that neither will any other process. Immutable mode will cause the file to be opened in read-only mode, and SQLite will not attempt to lock the file when accessing – which will speed things up if your app is under heavy use. If, for some reason, someone does write to the DB file, it’ll cause an error or corruption.
Note: “immutable” is not the same as “read only” mode. Read-only mode (URI parameter mode=ro) says that your current DB connection promises not to write to the SQLite file. SQLite will assume that another process could update the file data while you’re reading from it.
Try: storing all temporary tables in memory
SQLite creates temporary tables, indices, triggers, and views as part of regular query execution. In case that your DB is configured to write these to disk, you can set PRAGMA temp_store=2 in order explicitly create them in-memory only.
For more details: https://www.sqlite.org/pragma.html#pragma_temp_store
Try: turning off journaling
SQLite has a “rollback journal” – a journal is a special file that’s used to undo partial transactions during a crash, and prevents database corruption. By default, SQLite creates a separate file for this journal.
There are several journal options in SQLite. You’ll see a lot of advice recommending that you change the journaling mode to “WAL”.
For my read-only / high-tolerance for DB corruption use case, it made sense to turn off journaling completely with the PRAGMA journal_mode=OFF statement. This shaved another second from my sample query’s runtime.
Try: turning off synchronous mode
There are several “synchronous” settings. They influence how stringently SQLite verifies that a disk write occurred.
It sounds like this setting only affects write operations. But, my understanding is that any journaling transactions – even “read” transactions – will cause a write to disk. I think it’s implicit in this transaction doc, when it says:
While a read transaction is active, any changes to the database that are implemented by separate database connections will not be seen by the database connection that started the read transaction.
You’d turn off synchronous mode with PRAGMA synchronous=OFF.
This setting stands to significantly speed up writes to your SQLite file, but at the risk of DB corruption (ie. an OS-level crash or a power outage).
Try: memory-mapped IO
Memory-mapped IO is a technique to seamlessly load your SQLite file into memory, and to perform regular file operations on it (except it is much faster because it is in-memory). Behind the scenes, this eliminates a memory-copy operation when reading. When writing, this doesn’t save you any cycles.
Memory mapping can be turned on with the below pragma (set it to a large number of bytes, and the OS will allocate just whatever is available):
PRAGMA mmap_size=3000000000
More details on how mmap works This https://www.sqlite.org/mmap.html
On Windows, VACUUM will fail if memory mapped IO is on.
For my use case, the impact of memory mapping was inconclusive – it either saved 3 seconds or added ~10 seconds to the runtime. I think it’s because mmap still requires reading a lot of data from the slow disk. Test it out on your own system. I ended up using it as part of my final “winning mix” of pragmas.
Further reading on the benefits and drawbacks of memory-mapped IO.
Try: synchronous “OFF”
The sync mode for SQLite determines if SQLite makes sure that data/transactions have been actually written to disk before proceeding with the next operation. The options are described here.
With a read-only use case, I felt comfortable turning off the synch completely:
PRAGMA synchronous=OFF
This hands off any “writes” to the operating system without waiting for them to complete, and should speed things up considerably. Note that even read operations may end up writing to the filesystem.
I did it and it added 10seconds to runtime, so the mmap measurement was off somehow – maybe some stuff was still in disk cache memory…
Actually – test turningn OFF the memory mapping. It seems to have added a lot of execution time in span 34. Maybe it slows stuff down?
Additional reading
https://phiresky.github.io/blog/2020/sqlite-performance-tuning
https://www2.sqlite.org/cvstrac/wiki?p=PerformanceTuningWindows
Sqlite transaction benchmarking: https://reorchestrate.com/posts/sqlite-transactions/
https://news.ycombinator.com/item?id=35553908
Who Is Hosting This’ archived tips for SQLite Optimization. Particularly good for understanding cache size.
Jim Lyon’s optimizations (2015 archive)
Converting to SQLite and LIKE Query Optimization
If you are doing heavy LIKE searches, look into the case-insensitive GLOB alternative and the COLLATE NOCASE keyword you can use in column definitions / individual queries. For case insensitive matches, lowercasing your data and doing a GLOB case-sensitive match will probably be faster than using LIKE with mixed case values.
Reminder: time your code
If your Python application is slow, use the time.time() function to determine how long different parts of your code take to run.
You might be looking in the wrong place for those slow-code areas.
At first, I was trying to figure out why csv.writerows is so slow on the first Flask run. Then I was thinking the problem was with io.stringio(), and tried to fid a way to preallocate memory to io.stringio(). Finally, I thought that the csv.writerows() code is too slow and started comparing python’s csv module performance to dataframe writing csv.
Eventually, by timing different portions of my code, and removing the “csv conversion” code (while keeping the SQLite fetchall() ), I narrowed the slowness down to SQLite’s row-fetching functionality.
Bonus: VACUUM
Is your SQLite file big and chunky?
Does it need to go on a diet?
SQLite has a behaviour that keeps your database file growing until you run the VACUUM command:
Frequent inserts, updates, and deletes can cause the database file to become fragmented – where data for a single table or index is scattered around the database file.
When content is deleted from an SQLite database, the content is not usually erased but rather the space used to hold the content is marked as being available for reuse.
Once you VACUUM your file, it is smaller, and reading from it should be faster.
Did this help with your project?
If so, drop me a line at jacob at this website go give me the warm fuzzies!
