To see all posts in the “Examples” series, view the category “Examples.”
This week’s example, from The New York Times, uses two different techniques with JavaScript/jQuery — one simple, one advanced.
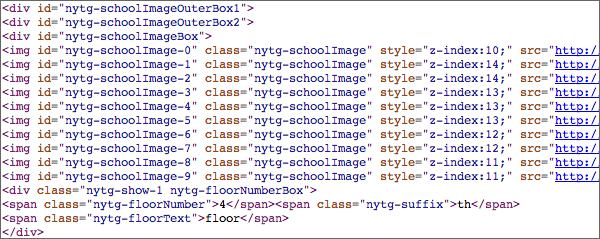
The first graphic on the page uses jQuery techniques you have already learned to animate the transitions between 10 different images. Below the screenshot, you can see the code that begins on line 1422 of the source — that’s where the JPGs appear in the HTML. Notice how each image has an ID and a class. Each image also has its own z-index embedded in the HTML (z-index is a CSS property that lets you control how images layer on top of one another).

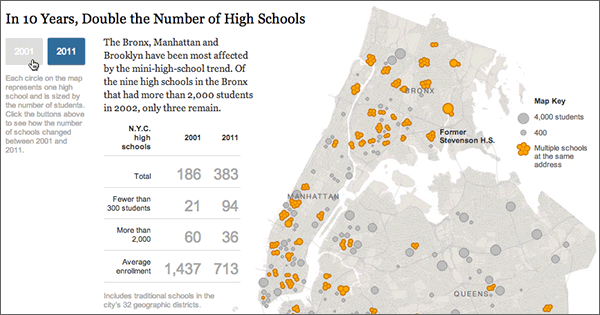
The second graphic on the same page was created with D3.js — “a JavaScript library for manipulating documents based on data.” I’ve shown a little bit of the code, below the screen capture (the code shown here starts at line 1590 in the source). So the map (unlike the school floor plans above) is not a static image file but is actually generated by code. Like jQuery, D3 is a JavaScript library — but it has a different purpose. D3 creates images from pure data.
If you right-click on the school building graphic, you can view or save the image. But if you right-click on the map graphic, you can’t — because there is no image file.
The map has its own CSS, which starts at line 662 in the source.

To learn more about D3 and see examples, see the D3 home page.


