The result is a simple, self-hosted analytics system built entirely on Next.js API routes and PostgreSQL. No cookies, no third-party scripts, no vendor lock-in. All collected data is displayed publicly on /about-this-site.
The database schema
Everything is stored in a single pageviews table:
CREATE TABLE IF NOT EXISTS pageviews (
  id SERIAL PRIMARY KEY,
  path TEXT NOT NULL,
  referrer TEXT,
  visitor_hash TEXT NOT NULL,
  country TEXT,
  city TEXT,
  latitude REAL,
  longitude REAL,
  user_agent TEXT,
  device_type TEXT,
  browser TEXT,
  os TEXT,
  language TEXT,
  screen_width INT,
  created_at TIMESTAMPTZ DEFAULT NOW()
);
Each row represents a single pageview. There are no sessions, no persistent user IDs and no cookies. Unique visitors are identified by a daily rotating hash described below.
To keep queries fast I added partial indexes on the columns used most often:
CREATE INDEX ON pageviews (created_at);
CREATE INDEX ON pageviews (path);
CREATE INDEX ON pageviews (visitor_hash, created_at);
CREATE INDEX ON pageviews (latitude, longitude) WHERE latitude IS NOT NULL AND longitude IS NOT NULL;
Tracking pageviews from the client
The tracking component is a small React component included in the root layout:
"use client";

import { usePathname } from "next/navigation";
import { useEffect, useRef } from "react";

export default function PageviewTracker() {
  const pathname = usePathname();
  const lastTrackedPath = useRef<string | null>(null);

  useEffect(() => {
    if (pathname === lastTrackedPath.current) return;
    if (localStorage.getItem("notrack") === "1") return;
    lastTrackedPath.current = pathname;

    const payload = JSON.stringify({
      path: pathname,
      referrer: document.referrer || null,
      screenWidth: window.screen?.width || null,
    });

    if (navigator.sendBeacon) {
      const blob = new Blob([payload], { type: "application/json" });
      navigator.sendBeacon("/api/pageview", blob);
    } else {
      fetch("/api/pageview", {
        method: "POST",
        headers: { "Content-Type": "application/json" },
        body: payload,
        keepalive: true,
      }).catch(() => {});
    }
  }, [pathname]);

  return null;
}
It uses usePathname to detect route changes in the Next.js App Router and fires on every navigation. navigator.sendBeacon is preferred over fetch because it is non-blocking and survives page unloads reliably.
The pageview API route
The API route at /api/pageview handles each incoming event. It does several things before writing to the database:
Rate limiting rejects more than 30 requests per minute from the same IP. The limiter is a plain Map in memory. Each IP gets a counter and a reset timestamp. No Redis, no external dependency:
const rateLimitMap = new Map<string, { count: number; resetTime: number }>();

if (!entry || now > entry.resetTime) {
  rateLimitMap.set(ip, { count: 1, resetTime: now + interval });
  return { success: true, remaining: limit - 1 };
}
if (entry.count >= limit) {
  return { success: false, remaining: 0 };
}
The client IP is read from x-real-ip first (set by nginx), falling back to the last entry in x-forwarded-for. Using the last entry rather than the first prevents clients from spoofing the header by prepending a fake IP.
Bot filtering tests the User-Agent against a regex of known crawler patterns before doing any database work.
Same-origin validation rejects requests that did not originate from the site. It parses the Origin or Referer header with new URL() and compares the host against the request Host header. A simple substring check would allow evil-mxd.codes to pass, so exact host matching is important. Requests with no Origin or Referer are allowed through. Those are same-site form submissions or direct navigations where the browser does not send either header.
Geolocation looks up the visitor's IP using the MaxMind GeoLite2 City database. The .mmdb file is loaded on the first request and cached in memory via @maxmind/geoip2-node and reused for every request with no external API call and no network latency. Coordinates are rounded to one decimal place to reduce precision:
latitude: Math.round(response.location.latitude * 10) / 10
User-Agent parsing is done with plain regex functions instead of a library. The browser, OS and device type are each extracted with a short chain of pattern checks. The order matters. Edge and Opera both include chrome in their User-Agent string, so they have to be matched first.
Visitor hashing creates a daily identifier without storing any persistent user data. The hash is a SHA-256 of the IP address, a server-side secret and the current date. The same visitor gets the same hash all day, which makes unique visitor counting possible. On the next day the hash is different, so there is no cross-day tracking.
Querying the data
All analytics queries live in src/lib/analytics.ts. The functions cover the most common dimensions:
getAnalyticsStats()returns total pageviews and total unique visitor-daysgetCurrentVisitors()counts distinct hashes seen in the last 5 minutesgetTopPages(limit)groups by path and orders by view countgetTopReferrers(limit)filters out self-referrals and empty referrersgetTopBrowsers,getTopOS,getTopLanguages,getTopCountries,getTopCitieseach group by their columngetDeviceBreakdown()splits into mobile, tablet and desktopgetScreenWidthDistribution()buckets screen widths into four categoriesgetPageviewsOverTime(days)returns a daily count for the last N days for the sparkline chartgetVisitorLocations()returns grouped coordinates for the visitor map
The /api/stats endpoint handles the overall pageview and visit counts, current visitor count and a few additional counts from other tables (comments, webmentions, emoji reactions, subscribers). It caches the result in memory for 24 hours. The more detailed breakdown queries (top pages, referrers, device types, countries and so on) are called directly from the about-this-site page on the server at request time.
Rendering the dashboard
Everything is displayed at /about-this-site, a server-rendered page with dynamic = "force-dynamic" so it always shows fresh data. The page fetches all the analytics functions in parallel on the server and passes the results down as props.
The 30-day pageview trend is rendered as an SVG sparkline chart built without any charting library:
const w = 400;
const h = 80;
const padding = 4;
const range = maxViews - minViews || 1;

const coords = data.map((d, i) => {
  const x = (i / (data.length - 1)) * (w - padding * 2) + padding;
  const y = h - padding - ((d.views - minViews) / range) * (h - padding * 2);
  return { x, y };
});

const polyline = coords.map((c) => `${c.x},${c.y}`).join(" ");
const areaPath = `M${coords[0].x},${coords[0].y} ${coords
  .slice(1)
  .map((c) => `L${c.x},${c.y}`)
  .join(" ")} L${w - padding},${h - padding} L${padding},${h - padding} Z`;
The area fill uses an SVG <path> element and the line is a <polyline>. Normalizing against the range (maxViews - minViews) rather than the absolute max keeps the chart readable even on low-traffic days. Colors come from the CSS custom property --secondary-color so the chart respects the site's light and dark theme automatically. Here is the live chart for this site:
Visitor locations are rendered on an interactive map using OpenLayers with cluster styling that scales logarithmically with the number of visits from each location.
The rest of the page uses simple HTML lists and inline percentage bars rendered with CSS width set proportionally to the maximum value in each group.
Privacy
No cookies are set. No data is shared with third parties. The IP address is used only to look up a rough location and to create the daily hash, then it is discarded. Coordinates are stored with reduced precision.
The full analytics dashboard is publicly visible at /about-this-site, which I think is a reasonable trade-off: if I am collecting data, I should be transparent about what it shows.
]]>
I have been using Colota daily since the closed testing phase and kept running into things that bothered me. The WebView-based maps felt sluggish, switching GPS settings between walking and driving was annoying, and I did not want to record my location while sitting at my desk all day. Version 1.1.0 is the result of fixing all of that.
Native Maps with MapLibre GL
The biggest change is the map engine. In v1.0 the maps were rendered using OpenLayers inside a WebView. Panning had noticeable lag, pinch-to-zoom was not smooth, and memory usage was higher than it should be.
I replaced the entire map stack with MapLibre GL Native via @maplibre/maplibre-react-native. The maps now render on the GPU. Panning and zooming that used to stutter are instant now, even with geofence overlays and accuracy circles drawn on top.
The tile source is OpenFreeMap which provides free vector tiles based on OpenStreetMap data without requiring an API key. This keeps Colota fully FOSS-compatible, which matters for the F-Droid build.

Dark Mode
With vector tiles and MapLibre I could add a proper dark mode for the map. The app fetches the OpenFreeMap style JSON once, transforms the paint properties to dark colors, and caches the result. No extra network request after the first load.
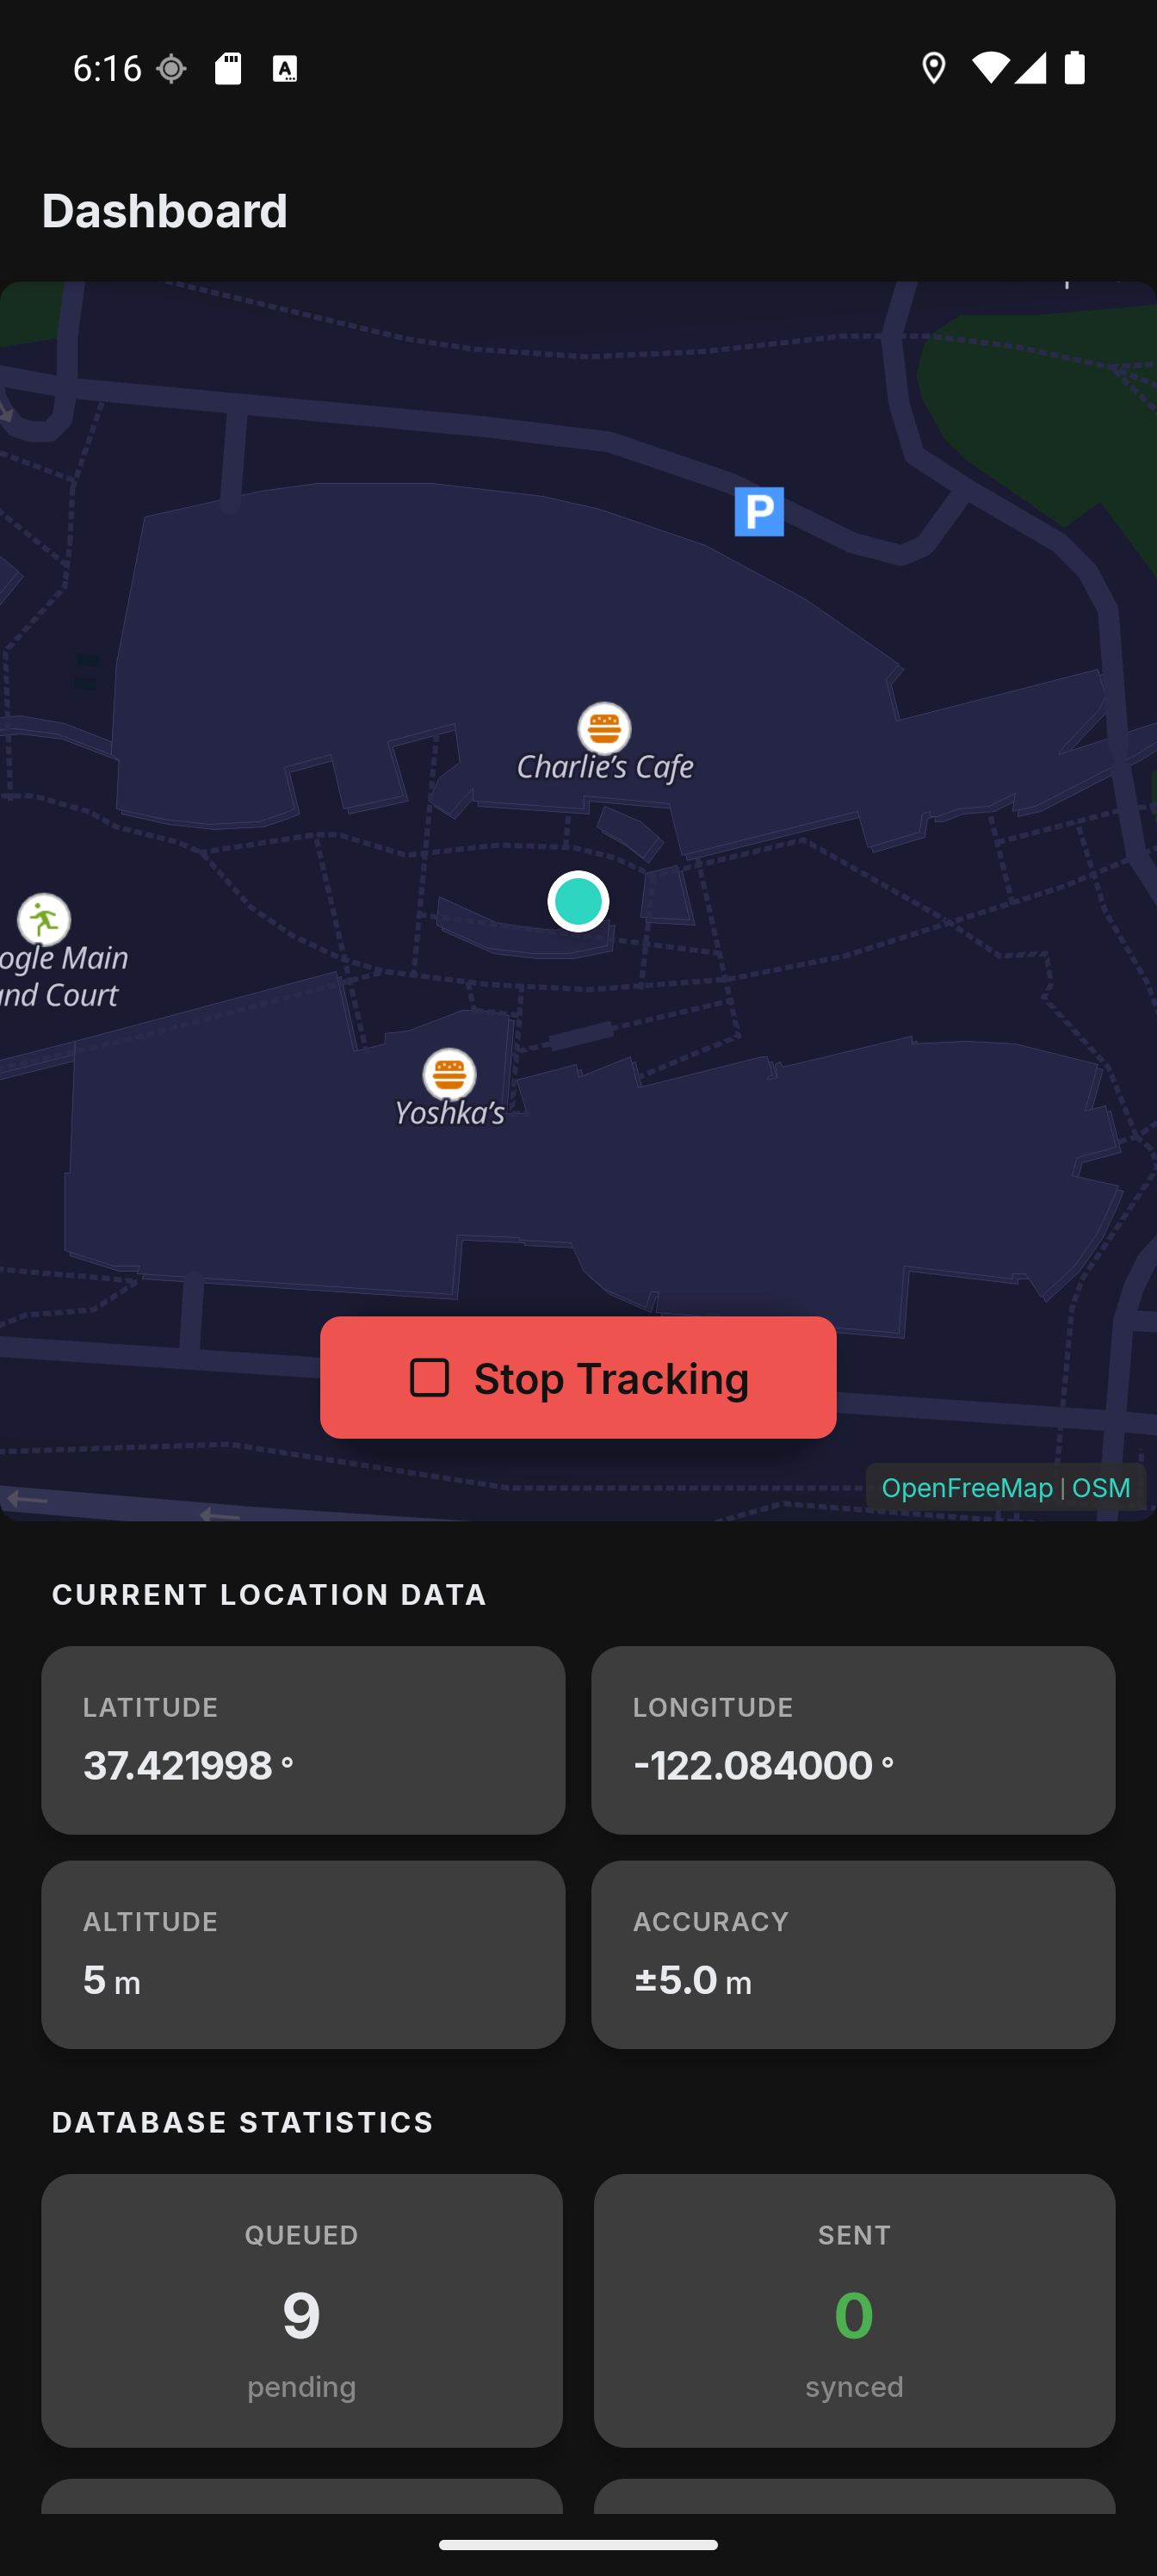
The color palette uses a navy/indigo family that fits well with the rest of the dark theme. Water is almost black, buildings are a subtle purple-gray, and text labels use a light gray with a dark halo for readability.
Tracking Profiles
This was the feature I wanted most for my own use. The GPS settings that work well for walking (high frequency, small distance threshold) drain the battery when driving. And the settings that work for driving miss too many points when walking.
Tracking profiles solve this by automatically switching GPS settings based on conditions. You can define profiles that activate when:
- The phone is charging
- Android Auto is connected (car mode)
- Speed is above a threshold
- Speed is below a threshold
![]()
For example, I have a "Driving" profile that activates when Android Auto connects. It sets the GPS interval to 4 seconds with a 20m distance threshold. When I disconnect from the car, it switches back to my default settings (2 second interval, 2m threshold).
The profile system uses priority-based resolution when multiple profiles match. It also has a deactivation delay to prevent rapid toggling when your speed fluctuates around the threshold.
Pause Zones
Sometimes you do not want to record your location at all. I do not need a GPS point every second while sitting at my desk at home or at the office.
Pause zones are geofences that automatically stop location recording when you enter them. You define a center point and a radius on the map, give it a name, and the app handles the rest. When you leave the zone, recording resumes automatically.

The distance calculation uses the haversine formula. The geofence check runs on every GPS fix inside the foreground service, so it works even when the React Native UI is not active. The zones are also visible on the dashboard map as colored circles with labels.
Speed-Colored Tracks
The location history map got a visual upgrade. Track segments are now colored by speed using a green-to-yellow-to-red gradient. This makes it easy to see at a glance where you were walking, cycling, or driving.
Each point on the track is tappable. A popup shows the exact coordinates, speed, accuracy, altitude, and timestamp. I also added a daily distance counter that shows how far you moved on any given day.
Deep Link Setup
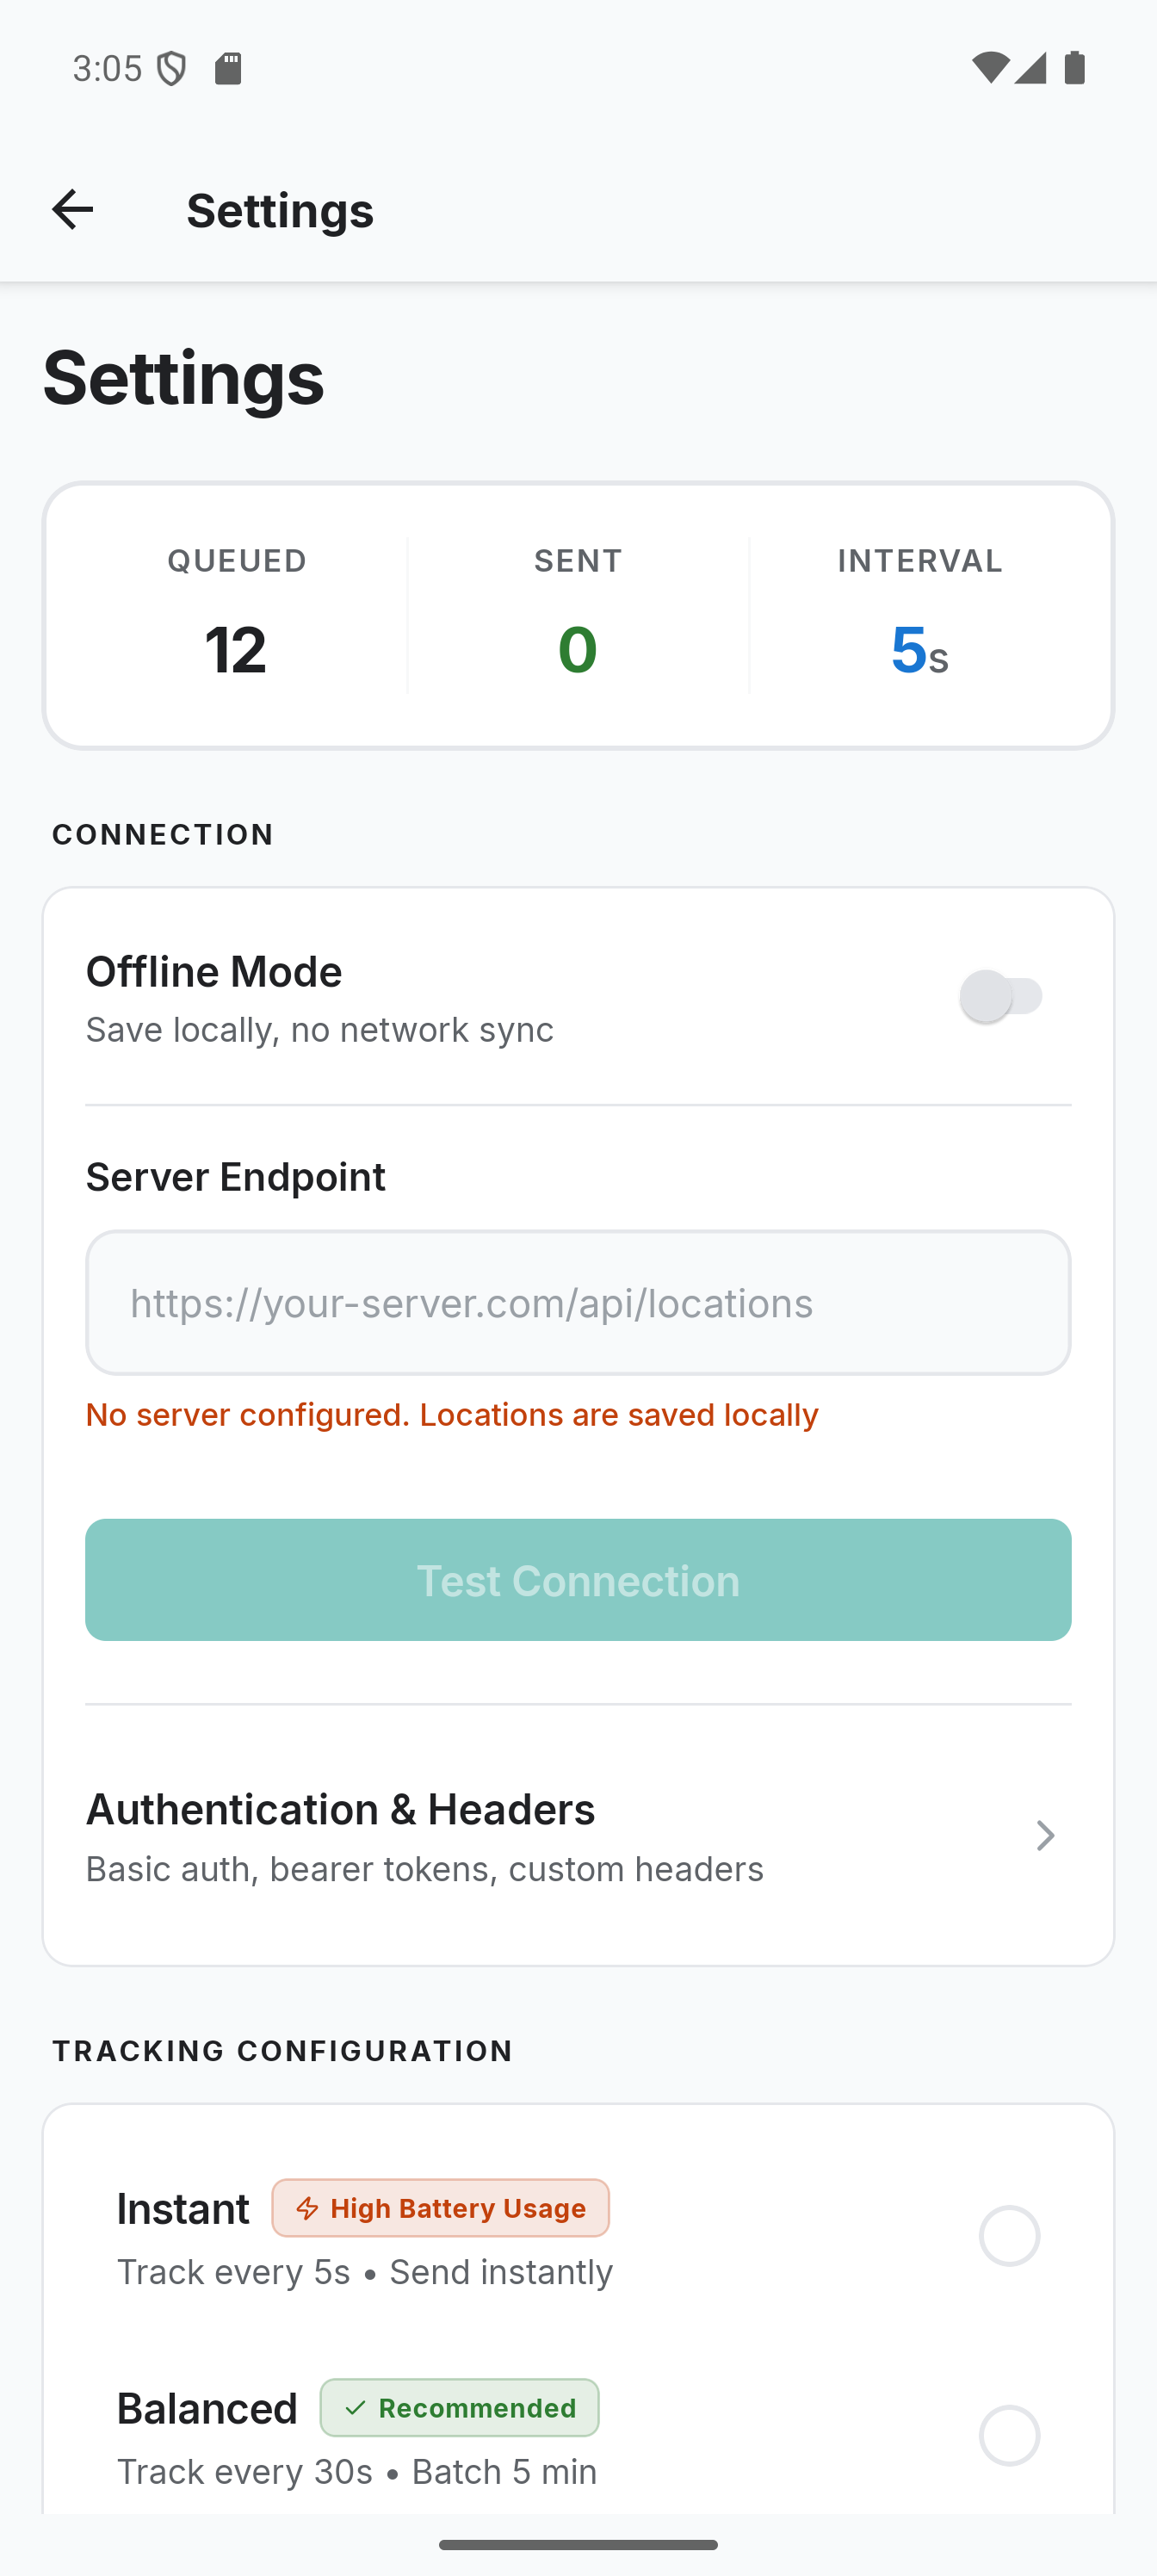
Setting up the app with all the server details (endpoint URL, auth credentials, sync settings) is tedious to do manually. Colota now supports a colota://setup deep link that lets you encode the entire configuration in a base64 payload.
The URL format looks like this:
colota://setup?config=eyJlbmRwb2ludCI6Imh0dHBzOi8vZXhhbXBsZS5jb20vYXBpL2xvY2F0aW9ucyIsInVzZXJuYW1lIjoidXNlciJ9
The base64 payload decodes to a JSON object with all configuration fields. You can generate a setup link on your server and share it. Scanning or tapping it on the phone configures everything in one step.
Settings and Sync Presets
The settings screen got a cleanup. Sync presets (Instant, Balanced, Power Saver) make it easier to pick the right tradeoff between freshness and battery life without touching individual values.
Smaller Improvements
- Improved About screen with debug info copy and build variant display
- Better data management with sync progress indicators and database vacuum feedback
- Fixed map panning being blocked during active tracking (the user location overlay was re-rendering every 250ms, removed the animation and memoized the marker coordinates)
- Fixed stale tracking state after Android revokes location permission in the background
- Reliable Android Auto detection using the CarConnection API instead of broadcast hacks
New Icon
The app has a new icon. The old one was a placeholder I threw together in five minutes. The new one follows the Android adaptive icon guidelines and actually looks decent on both light and dark launchers.
Try It Out
The app is available on Google Play, F-Droid (pending review), and as a direct APK download on GitHub. The full source code is AGPL-3.0 licensed.
For setup instructions with different backends (Traccar, Home Assistant, OwnTracks, Dawarich, PhoneTrack) check the documentation. If you run into issues with background tracking being killed by your phone manufacturer, have a look at the battery optimization guide.
If you have been following along from my earlier post about location tracking with OwnTracks and Node.js, Colota is basically the evolution of that setup. The tracking app is now my own, fully open-source, and does not depend on OwnTracks anymore. The server-side stack (PostgreSQL, GeoServer, MapProxy) still works the same way. You just point Colota to your webhook endpoint and it sends the same kind of location payloads.
]]>
Securing web applications with HTTPS is a must, and Let’s Encrypt makes it easy by offering free SSL certificates. But what if you want a wildcard certificate to cover all subdomains under a domain? Fortunately, Let’s Encrypt supports wildcard certificates via the DNS-01 challenge, which requires updating DNS TXT records.
This guide is specific to using Cloudflare as your DNS provider, using their API to automate DNS updates during certificate issuance and renewal. Let’s walk through the process step by step.
Prerequisites
Before we dive in, make sure you have:
- A registered domain managed via Cloudflare (e.g.,
example.com) - A Cloudflare API token with DNS edit permissions (see Step 2)
- Docker and Docker Compose installed
If you use other DNS providers like DigitalOcean or AWS Route 53, you’ll need different DNS plugins and API credentials. This guide is tailored specifically for Cloudflare.
Step 1: Set Up the Docker Environment
Create a directory for your setup:
mkdir nginx-wildcard-ssl && cd nginx-wildcard-ssl
Create a docker-compose.yml file with the following content:
version: '3'
services:
  nginx:
    image: nginx:latest
    container_name: nginx
    restart: unless-stopped
    ports:
      - "80:80"
      - "443:443"
    volumes:
      ## Config
      - ./nginx/nginx.conf:/etc/nginx/nginx.conf:ro
      - ./nginx/sites-available:/etc/nginx/sites-enabled:ro
      ## SSL
      - /etc/ssl:/etc/ssl
      - /data/containers/nginx/ssl/dhparam.pem:/etc/ssl/dhparam.pem:ro
      - /data/containers/certbot/conf:/etc/letsencrypt:ro
      ## Logs (optional)
      #- /data/containers/nginx/logs:/var/log/nginx:rw
    command: /bin/sh -c "while :; do sleep 6h & wait $${!}; nginx -s reload; done & nginx -g 'daemon off;'"
    networks:
      - web
      - internal

  certbot:
    container_name: certbot
    image: certbot/dns-cloudflare
    restart: unless-stopped
    volumes:
      - /data/containers/certbot/conf:/etc/letsencrypt:rw
      - /data/containers/certbot/www:/var/www/certbot:rw
    entrypoint: "/bin/sh -c 'trap exit TERM; while :; do certbot renew --dns-cloudflare --dns-cloudflare-credentials /etc/letsencrypt/.secrets/cloudflare.ini; sleep 48h & wait $${!}; nginx -s reload; done;'"
    networks:
      - internal

networks:
  web:
    external: true
    name: nginx
  internal:
    driver: bridge
Step 2: Prepare Your Cloudflare API Token
To allow Certbot to update DNS TXT records automatically for the DNS-01 challenge, you need a Cloudflare API token with DNS edit permissions.
How to create the API token:
- Log into your Cloudflare dashboard: https://dash.cloudflare.com/.
- Click your user icon → My Profile → API Tokens.
- Click Create Token.
- Use the Edit zone DNS template or create a custom token with:
- Permissions: Zone → DNS → Edit
- Zone Resources: Restrict to your domain(s) for security.
- Name your token (e.g.,
Certbot DNS Token). - Click Continue to summary and then Create Token.
- Copy the token immediately — you won't be able to see it again.
Save the token securely
Create a file /data/containers/certbot/conf/.secrets/cloudflare.ini with:
dns_cloudflare_api_token = your_cloudflare_api_token_here
Important: This file contains sensitive credentials!
So it's recommended to restrict permissions for the file. Therefore secure the credentials file with:
chmod 600 /data/containers/certbot/conf/.secrets/cloudflare.ini
This command sets file permissions so only the owner can read and write the file. It prevents other users on the system from reading your API token, enhancing security.
Step 3: Request Your Wildcard Certificate
Request your wildcard certificate by running:
docker run --rm \
  -v /data/containers/certbot/conf:/etc/letsencrypt \
  -v /data/containers/certbot/www:/var/www/certbot \
  certbot/dns-cloudflare certonly \
  --dns-cloudflare \
  --dns-cloudflare-credentials /etc/letsencrypt/.secrets/cloudflare.ini \
  --email [email protected] \
  --agree-tos \
  --no-eff-email \
  -d example.com \
  -d "*.example.com"
What this command does:
- Runs the Certbot Docker container with the Cloudflare DNS plugin.
- Mounts your configuration and webroot folders inside the container.
- Uses the Cloudflare API token to create temporary DNS TXT records required by Let’s Encrypt to prove domain ownership.
- Requests certificates for both your apex domain (example.com) and all subdomains (*.example.com).
- Stores the certificates in /etc/letsencrypt/live/example.com/ (inside the container, mapped to your host folder).
- Agrees to the Let's Encrypt terms of service.
- Uses your email for urgent notices (expiry reminders).
If successful, you’ll see something like:
IMPORTANT NOTES:
 - Congratulations! Your certificate and chain have been saved at:
   /etc/letsencrypt/live/example.com/fullchain.pem
   Your key file has been saved at:
   /etc/letsencrypt/live/example.com/privkey.pem
 - Your certificate will expire on 2025-09-15. To obtain a new or tweaked
   version of this certificate in the future, simply run certbot again.
 - If you like Certbot, please consider supporting our work by:

   Donating to ISRG / Let's Encrypt:   https://letsencrypt.org/donate
Step 4: Configure Nginx to Use the Wildcard Certificate
Create a virtual host config, for example ./nginx/sites-available/example.conf:
server {
    listen 443 ssl;
    server_name example.com *.example.com;

    ssl_certificate /etc/letsencrypt/live/example.com/fullchain.pem;
    ssl_certificate_key /etc/letsencrypt/live/example.com/privkey.pem;
    ssl_dhparam /etc/ssl/dhparam.pem;

    location / {
        proxy_pass http://your_backend;
        proxy_set_header Host $host;
        proxy_set_header X-Real-IP $remote_addr;
        proxy_set_header X-Forwarded-For $proxy_add_x_forwarded_for;
        proxy_set_header X-Forwarded-Proto $scheme;
    }
}

server {
    listen 80;
    server_name example.com *.example.com;
    return 301 https://$host$request_uri;
}
You’ll also need a basic nginx.conf to include your sites:
user  nginx;
worker_processes  auto;

error_log  /var/log/nginx/error.log warn;
pid        /var/run/nginx.pid;

events {
    worker_connections  1024;
}

http {
    include       /etc/nginx/mime.types;
    default_type  application/octet-stream;

    # Logging
    access_log    /var/log/nginx/access.log;
    error_log     /var/log/nginx/error.log;

    # Performance
    sendfile        on;
    tcp_nopush      on;
    tcp_nodelay     on;
    keepalive_timeout  65;
    types_hash_max_size 2048;

    # Gzip Compression
    gzip on;
    gzip_disable "msie6";
    gzip_vary on;
    gzip_proxied any;
    gzip_comp_level 6;
    gzip_buffers 16 8k;
    gzip_min_length 1024;
    gzip_types text/plain text/css application/json application/javascript text/xml application/xml application/xml+rss text/javascript;

    # Security Headers (can be overridden in virtual hosts)
    add_header X-Frame-Options "SAMEORIGIN";
    add_header X-Content-Type-Options "nosniff";

    # SSL Defaults (override per-site)
    ssl_protocols TLSv1.2 TLSv1.3;
    ssl_prefer_server_ciphers on;

    # Include Virtual Hosts
    include /etc/nginx/sites-enabled/*.conf;
}
Restart the stack or reload Nginx to apply changes:
docker-compose up -d
Step 5: Automate Renewal and Nginx Reload
The Certbot container is configured to:
- Automatically attempt certificate renewal every 48 hours.
- After successful renewal, it triggers an Nginx reload to apply the updated certificates without downtime.
This is handled by the command in docker-compose.yml:
entrypoint: "/bin/sh -c 'trap exit TERM; while :; do certbot renew --dns-cloudflare --dns-cloudflare-credentials /etc/letsencrypt/.secrets/cloudflare.ini; sleep 48h & wait $${!}; nginx -s reload; done;'"
You can test renewal manually with:
docker run --rm \
  -v /data/containers/certbot/conf:/etc/letsencrypt \
  certbot/certbot renew --dry-run
Summary
- This guide is tailored for domains managed on Cloudflare.
- You set up Docker containers running Nginx and Certbot with the Cloudflare DNS plugin.
- Created a Cloudflare API token to allow DNS automation.
- Requested and installed a wildcard SSL certificate covering your domain and all subdomains.
- Nginx uses the wildcard certificate for HTTPS.
- Automatic certificate renewal and zero-downtime Nginx reload are configured.
If you use another DNS provider, look for the appropriate Certbot DNS plugin and adjust the API credentials accordingly.
Feel free to ask if you want me to help with other providers or configurations!
]]>
Plausible Analytics is a lightweight, privacy-focused, cookie-free analytics solution. In this article, we’ll implement it inside a Next.js App Router project in a way that bypasses ad blockers using proxying. By proxying the tracking script and API requests through your own domain, you significantly reduce the chance of them being blocked by common ad-blocking extensions.
We’ll also ensure that page views are correctly tracked on every route change in a client-side rendered app.
This guide assumes you are self-hosting Plausible on a custom subdomain such as
analytics.yourdomain.com.
Proxy the Plausible Script and API
To reduce the chance of being blocked by ad blockers, we'll proxy Plausible's script and API through your own domain.
In your next.config.js, add the following:
async rewrites() {
  return [
    {
      source: "/js/script.js",
      destination:
        "https://analytics.yourdomain.com/js/script.file-downloads.hash.outbound-links.pageview-props.revenue.tagged-events.js",
    },
    {
      source: "/api/event",
      destination: "https://analytics.yourdomain.com/api/event",
    },
  ];
}
Next.js uses this to route requests internally without triggering a redirect (i.e., the user sees the original URL in their browser).
- When a user or script on your site requests
/js/script.jsor/api/event, the request is internally proxied to the external URL. - The browser still thinks it loaded locally, but the content is coming from
analytics.yourdomain.com.
What is this script variant?
The URL points to a self-hosted and enhanced version of the Plausible tracking script:
script.file-downloads.hash.outbound-links.pageview-props.revenue.tagged-events.js
This version includes support for:
- File downloads
- URL hash tracking
- Outbound link clicks
- Custom pageview properties
- Revenue tracking
- Tagged events
This is ideal if you want richer insights without modifying your app further.
Create a Route Tracker Component
Create a new file: app/RouteTracker.tsx
'use client';

import { usePathname } from 'next/navigation';
import { useEffect } from 'react';

const RouteTracker = () => {
  const pathname = usePathname();

  useEffect(() => {
    // 1. Add the Plausible script to the DOM if not already added
    if (!document.getElementById("next-p")) {
      const script = document.createElement("script");
      script.id = "next-p";
      script.async = true;
      script.defer = true;
      script.setAttribute("data-domain", "yourdomain.com");
      script.src = "/js/script.js"; // Note: this uses the proxied script
      document.head.appendChild(script);
    }

    // 2. Add Plausible's minimal global initializer
    if (!document.getElementById("next-p-init")) {
      const initScript = document.createElement("script");
      initScript.id = "next-p-init";
      initScript.innerHTML =
        "window.plausible = window.plausible || function() { (window.plausible.q = window.plausible.q || []).push(arguments) }";
      document.head.appendChild(initScript);
    }

    // 3. Manually track a pageview when route changes
    const trackPageview = (url: string) => {
      const eventData = {
        name: "pageview",
        url,
        domain: window.location.hostname,
        ...(document.referrer && { referrer: document.referrer }),
      };

      fetch("/api/event", {
        method: "POST",
        headers: {
          "Content-Type": "application/json",
        },
        body: JSON.stringify(eventData),
      }).catch((err) => console.error("Error tracking pageview:", err));
    };

    trackPageview(pathname);
  }, [pathname]);

  return null;
};

export default RouteTracker;
What this does
- Dynamically injects the Plausible script into the page, ensuring it's only loaded once.
- Adds a global Plausible initializer, so custom events can be tracked if needed.
- Manually sends a pageview event whenever the route changes in the client, which is essential in App Router / SPA apps.
Use the Component in Your Layout
Open your root layout file (app/layout.tsx) and import the tracker:
import RouteTracker from "@/src/hooks/plausible"; // adjust path to match your project
Then include it in your layout:
<body>
  <RouteTracker />
  {children}
</body>
Final Notes
- This implementation ensures Plausible is loaded only on the client and is less likely to be blocked.
- All route changes are tracked, making it perfect for SPA-like behavior with App Router.
- You benefit from all of Plausible’s extended features using the custom script variant.
By combining script proxying and client-side tracking, you get powerful, privacy-compliant analytics without sacrificing usability or insight.
]]>
When running databases like PostgreSQL and MariaDB on a server, ensuring regular backups is crucial for protecting your data from unexpected events such as crashes, human error, or system failure. While there are several ways to create backups, scripting a backup solution gives you complete control and automation.
In this article, we'll show you how to create a simple yet effective backup script for PostgreSQL and MariaDB running in Docker containers on a server. We'll automate the process to ensure that your databases are regularly backed up without you needing to manually intervene.
Why You Need Backups?
Before diving into the script, let’s take a moment to highlight why having regular backups is essential:
- Protection Against Data Loss: Regular backups prevent loss of valuable data due to failures or accidents.
- Disaster Recovery: Having up-to-date backups makes it easier to restore services quickly after a failure.
- Compliance and Audits: Some industries require maintaining backup copies of data for regulatory compliance.
- Peace of Mind: Knowing your data is safe provides confidence and good sleep.
Prerequisites
Before creating the backup script, make sure you have:
- A VPS running a Linux-based operating system.
- Docker installed and running.
- PostgreSQL and MariaDB running inside Docker containers.
- Basic knowledge of using the terminal and running Docker commands.
For the purpose of this tutorial, let’s assume your PostgreSQL and MariaDB containers are named postgres_container and mariadb_container.
Create a Backup Directory
Start by creating a directory on your server where the backups will be stored. This will help keep everything organized.
mkdir -p /home/youruser/backup
Replace /home/youruser/backup with the location where you'd like to store your backups.
Create the Backup Script
Now let’s create a bash script that will run daily backups for both PostgreSQL and MariaDB databases. Open your favorite text editor and create a file named backup_databases.sh.
#!/bin/bash
set -euo pipefail

# Backup a PostgreSQL database into a daily file.

BACKUP_DIR="/data/backups"
LOG_FILE="/var/log/db_backup.log"
DAYS_TO_KEEP=30
POSTGRESDATABASES=("db1" "db2") # PostgreSQL DBs to backup
MARIADBDATABASES=("db1") # MariaDB DBs to backup
POSTGRESCONTAINER="postgres_container"
MARIADBCONTAINER="mariadb_container"

# Create necessary directories
mkdir -p "${BACKUP_DIR}"
mkdir -p "$(dirname "${LOG_FILE}")"

# Create backup directory if it doesn't exist
mkdir -p "${BACKUP_DIR}"

# Function to log messages
log() {
    local level="$1"
    local message="$2"
    local timestamp
    timestamp=$(date +"%Y-%m-%d %H:%M:%S")

    # Log to both stdout and a log file
    echo -e "${timestamp} [${level}] ${message}" | tee -a "${LOG_FILE}"
}

for DATABASE in "${POSTGRESDATABASES[@]}"; do
    TIMESTAMP=$(date +"%Y%m%d%H%M")
    FILE="${TIMESTAMP}_${DATABASE}.sql.gz"
    OUTPUT_FILE="${BACKUP_DIR}/${FILE}"

    log "INFO" "Starting backup for database: ${DATABASE}"

    # Perform the backup and compress the output
    if docker exec -i "${POSTGRESCONTAINER}" /usr/bin/pg_dump -U "${USER}" "${DATABASE}" | gzip -9 > "${OUTPUT_FILE}"; then
        log "SUCCESS" "Backup created: ${OUTPUT_FILE}"
        ls -l "${OUTPUT_FILE}" | tee -a "${LOG_FILE}"
    else
        log "ERROR" "Backup failed for database ${DATABASE}" >&2
        continue
    fi

    # Prune old backups
    find "${BACKUP_DIR}" -maxdepth 1 -mtime +"${DAYS_TO_KEEP}" -name "*${DATABASE}.sql.gz" -exec rm -f {} \; \
        && log "INFO" "Old backups deleted for database ${DATABASE}" \
        || log "ERROR" "Failed to delete old backups for ${DATABASE}" >&2
done

## MariaDB Backup
for DATABASE in ${MARIADBDATABASES[@]}; do
    TIMESTAMP=$(date +"%Y%m%d%H%M")
    FILE="${TIMESTAMP}_${DATABASE}.sql.gz"
    OUTPUT_FILE="${BACKUP_DIR}/${FILE}"

    # Perform the database backup (dump)
    if docker exec ${MARIADBCONTAINER} /usr/bin/mariadb-dump -u  root --password=yourpassword ${DATABASE} | gzip -9 >  ${OUTPUT_FILE}; then
        log "SUCCESS" "Backup created: ${OUTPUT_FILE}"
        ls -l "${OUTPUT_FILE}" | tee -a "${LOG_FILE}"
    else
        log "ERROR" "Backup failed for database ${DATABASE}" >&2
        continue
    fi

    # Prune old backups
    find "${BACKUP_DIR}" -maxdepth 1 -mtime +"${DAYS_TO_KEEP}" -name "*${DATABASE}.sql.gz" -exec rm -f {} \; \
        && log "INFO" "Old backups deleted for database ${DATABASE}" \
        || log "ERROR" "Failed to delete old backups for ${DATABASE}" >&2
done

log "INFO" "Finished database backups!"
Explanation:
- Variables: The script starts by defining a backup directory and more parameters like days to keep backups and individual databases to backup.
- PostgreSQL Backup: It uses
docker execto run thepg_dumpcommand inside the PostgreSQL container to dump previously defined databases. - MariaDB Backup: Similarly, it uses
docker execto run themysqldumpinside the MariaDB container and backup previously defined databases. - Compression: All backups are compressed using
gzipto save space. - Backup Cleanup: Finally, the script deletes backups older than
DAYS_TO_KEEPdays to prevent disk space issues.
Customizing the Script:
- Change
BACKUP_DIRto the directory where you want to store your backups. - Replace
DAYS_TO_KEEPwith the days how long you want to keep backups. - Replace
POSTGRESDATABASESwith the PostgreSQL databases to backup. - Replace
MARIADBDATABASESwith the MariaDB databases to backup. - Replace
POSTGRESCONTAINERandMARIADBCONTAINERwith the name of your PostgreSQL and MariaDB containers. - Replace
yourpasswordwith the password for the root user in MariaDB..
Make the Script Executable
After saving the script, make it executable:
chmod +x /path/to/backup_databases.sh
Automate the Backup with Cron
To schedule automatic backups, set up a cron job.
- Open the crontab editor:
crontab -e
- Add the following line to run the backup script daily at 2:00 AM:
0 2 * * * /path/to/backup_databases.sh
This will execute the backup script every day at 2:00 AM.
Make sure to adjust the path /path/to/backup_databases.sh to the correct location of your script.
Verify the Backup
It’s always a good idea to manually run the backup script once to ensure everything is working correctly.
/path/to/backup_databases.sh
Check the backup directory to ensure that the backup files have been created and compressed.
Restore from Backup (Bonus)
In case you need to restore a backup, you can use the following commands to load the backups back into your PostgreSQL and MariaDB containers.
PostgreSQL Restore:
docker exec -i postgres_container psql -U postgres -d database < /home/youruser/backup/DATE_DATABASE.sql
MariaDB Restore:
docker exec -i mariadb_container mariadb u root --password=yourpassword database < /home/youruser/backup/DATE_DATABASE.sql
Replace DATE and DATABASE with the appropriate backup file’s date and database name
By following these steps, you've created a simple and automated backup solution for your PostgreSQL and MariaDB databases running inside Docker containers. Regular backups are essential for protecting your data, and this script ensures that your backups run smoothly without manual intervention. You can also use this script to backup databases e.g. in Unraid with the User Scriptplugin.
You can further enhance this backup strategy by sending notifications, backing up to remote storage (e.g., AWS S3 or Google Cloud), or setting up encryption for additional security.
With your databases securely backed up, you can rest easy knowing your data is safe and easily recoverable in case of an emergency.
]]>
Webmentions are a powerful tool for adding decentralized social interactions, such as comments, likes, reposts, and replies, directly on your website. If you're building a dynamic site with Next.js, integrating Webmentions can help encourage cross-site conversations, boost SEO, and enhance user engagement. In this guide, I will show you how to implement Webmentions into your Next.js project with PostgreSQL for storing and displaying them.
What Are Webmentions?
Webmention is an open web standard (W3C Recommendation) that enables decentralized cross-site interactions.
In simpler terms, Webmentions allow users to interact with your content across the web by leaving comments, likes, reposts and other responses on other sites. These interactions enrich your site’s user experience, and they help establish meaningful connections with others.
When you link to a webpage, you can send a Webmention notification. If the receiving site supports Webmentions, it may display your post as a comment, like, or response—enabling rich cross-site conversations.
Why Should You Use Webmentions?
- Encourage Engagement: Promote cross-site discussions and interactions.
- Boost Social Proof: Display interactions from well-known sources to establish credibility.
- Enhance SEO: Webmentions generate backlinks, improving visibility and search engine rankings.
Here’s an example of how Webmentions appear on my site:

You can check a live version of this in the Webmentions section of this article: [/articles/fetching-and-storing-activities-from-garmin-connect-with-strapi-and-visualizing-them-with-next-js#replies].
A typical webmentions structure in JSON looks like this:
{
  "type": "entry",
  "author": {
    "type": "card",
    "name": "Some Name",
    "photo": "URL to author image",
    "url": "URL to author profile"
  },
  "url": "Webmention URL",
  "wm-received": "Date of Webmention",
  "wm-id": 1876563,
  "wm-source": "Source URL",
  "wm-target": "Target URL",
  "wm-property": "Type of mention (e.g., like-of, repost-of)",
  "wm-private": false
}
To keep your Webmentions accessible even if an external service is discontinued, it’s a good idea to store them locally. In this tutorial, we’ll guide you through setting up a PostgreSQL database to store Webmentions and display them dynamically in your Next.js app.
Setting Up PostgreSQL
Before we dive into Webmentions, ensure you have PostgreSQL installed on your server. If not, check on of these guides.
Once PostgreSQL is ready:
- Create a New Database:
# Create a new database for storing Webmentions
createdb personalwebsite
- Create a Table to Store Webmentions: Here's the SQL structure to store Webmentions in your database:
-- Define a table structure to store Webmentions

-- DROP TABLE public.webmentions;

CREATE TABLE public.webmentions (
    id serial4 NOT NULL,
    wm_id int8 NOT NULL,
    wm_source text NOT NULL,
    wm_target text NOT NULL,
    wm_property text NOT NULL,
    url text NULL,
    author_name text NULL,
    author_photo text NULL,
    author_url text NULL,
    content_html text NULL,
    content_text text NULL,
    published_at timestamp NULL,
    received_at timestamp DEFAULT CURRENT_TIMESTAMP NULL,
    CONSTRAINT webmentions_pkey PRIMARY KEY (id),
    CONSTRAINT webmentions_wm_id_key UNIQUE (wm_id)
);
- Create a Log Table for Fetching Webmentions: This table logs each fetch, allowing you to track when Webmentions were last retrieved and avoid overloading the service:
-- public.webmention_fetch_log definition

-- Drop table

-- DROP TABLE public.webmention_fetch_log;

CREATE TABLE public.webmention_fetch_log (
    id serial4 NOT NULL,
    last_fetch timestamptz NOT NULL,
    CONSTRAINT webmention_fetch_log_pkey PRIMARY KEY (id)
);
Using Webmention.io to Receive Webmentions
Before we store webmentions to display them we have to get them somewhere. If you dont want to implement your own Webmentions Receiver I recommend to use Webmention.io which is a service to easily receive webmentions.
Steps:
- Set Up IndieAuth for Your Site: Follow these IndieAuth setup instructions
- Sign Up for Webmention.io: Create an account at Webmention.io
- Add the Webmention Link to Your
_app.tsx:
<Head>
  ...
  <link rel="webmention" href="proxy.php?url=https://webmention.io/username/webmention" />
  ...
  </Head>
From here on, Webmention.io will collect all the Webmentions for your site. Now, let’s create a script that fetches and stores them every ten minutes in the PostgreSQL database
Fetching Webmentions from Webmention.io API
To keep Webmentions up-to-date, we'll fetch them periodically. Here’s the logic of the script.

Create a script src/utils/fetch-webmentions.js to fetch and store Webmentions:
import fetch from "node-fetch"
import { Pool } from "pg"

const pool = new Pool({
  user: process.env.PGUSER,
  host: process.env.PGHOST,
  database: process.env.PGDATABASE,
  password: process.env.PGPASSWORD,
  port: process.env.PGPORT,
})

function isNotOlderThanTenMinutes(date: Date) {
  if (!(date instanceof Date) || isNaN(date.getTime())) return false
  return Date.now() - date.getTime() <= 10 * 60 * 1000
}

export async function fetchAndStoreWebmentions() {
  const client = await pool.connect() // Use a client for transaction safety
  try {
    console.log("🔄 Checking last webmention fetch...")

    // Get the latest fetch timestamp
    const { rows } = await client.query(
      `SELECT last_fetch FROM webmention_fetch_log ORDER BY last_fetch DESC LIMIT 1`
    )
    const lastFetchDate = rows[0]?.last_fetch

    if (isNotOlderThanTenMinutes(lastFetchDate)) {
      console.log("✅ Webmentions are already updated!")
      return
    }

    // Insert new fetch timestamp
    const now = new Date().toISOString()
    await client.query(`INSERT INTO webmention_fetch_log (last_fetch) VALUES ($1)`, [now])
    console.log("📌 Updated Webmentions fetch log")

    // Generate Webmention API URL
    const baseUrl = `https://webmention.io/api/mentions.jf2?domain=mxd.codes&per-page=1000&page=0&token=${process.env.WEBMENTION_IO_TOKEN}`
    const webmentionsUrl =
      lastFetchDate instanceof Date && !isNaN(lastFetchDate.getTime())
        ? `${baseUrl}&since=${lastFetchDate.toISOString()}`
        : baseUrl

    // Fetch new Webmentions from Webmention.io
    console.log("🔄 Fetching webmentions from Webmention.io...")
    const response = await fetch(webmentionsUrl)
    const { children: webmentions } = await response.json()

    if (!Array.isArray(webmentions) || webmentions.length === 0) {
      console.log("⚠️ No new webmentions found.")
      return
    }

    console.log(`📥 Processing ${webmentions.length} webmentions...`)

    // Prepare batch insert query
    const insertQuery = `
      INSERT INTO webmentions (
        wm_id, wm_source, wm_target, wm_property, url,
        author_name, author_photo, author_url, content_html, content_text, published_at, received_at
      ) VALUES ($1, $2, $3, $4, $5, $6, $7, $8, $9, $10, $11, $12)
      ON CONFLICT (wm_id) DO NOTHING;
    `

    for (const mention of webmentions) {
      const values = [
        mention["wm-id"],
        mention["wm-source"],
        mention["wm-target"],
        mention["wm-property"],
        mention["url"],
        mention.author?.name || null,
        mention.author?.photo || null,
        mention.author?.url || null,
        mention.content?.html || null,
        mention.content?.text || null,
        mention.published ? new Date(mention.published) : null,
        new Date(mention["wm-received"]),
      ]
      await pool.query(insertQuery, values)
    }

    console.log(`✅ Stored ${webmentions.length} webmentions successfully!`)
  } catch (error) {
    console.error("❌ Error fetching or storing webmentions:", error)
  } finally {
    client.release() // Ensure client is released back to the pool
  }
}

// Run the function
fetchAndStoreWebmentions()
This function can now be called everytime before webmentions are queried for a page from PostgreSQL database. Ideally, you should abstract the logic for determining whether new webmentions need to be fetched into an API layer. This prevents unnecessary database queries with every request, but this is out of scope for this article.
Retrieving Webmentions for a Page
To retrieve Webmentions dynamically for a page, we create an API route in pages/api/get-webmentions.js. This route allows us to fetch mentions for a specific target URL stored in our PostgreSQL database.
import { Pool } from "pg"
import { fetchAndStoreWebmentions } from "@/src/utils/fetch-webmentions"

const pool = new Pool({
  user: process.env.PGUSER,
  host: process.env.PGHOST,
  database: process.env.PGDATABASE,
  password: process.env.PGPASSWORD,
  port: process.env.PGPORT,
})

export default async function handler(req, res) {
  if (req.method !== "GET")
    return res.status(405).json({ error: "Method not allowed" })

  const { target } = req.query
  if (!target) return res.status(400).json({ error: "Missing target URL" })

  // Updating Webmentions before selecting for page url
  await fetchAndStoreWebmentions()
  const query = `SELECT wm_id, wm_source, wm_target, wm_property, url, author_name, author_photo, author_url, content_text, published_at FROM webmentions WHERE wm_target LIKE '%${target}%' ORDER BY received_at DESC;`
  const result = await pool.query(query)

  res.json(result.rows)
}
Now you can call this API route and pass a query param target with the URL to get all Webmentions for a page.
Displaying Webmentions in Next.js
To visually display Webmentions on our website, we create a dedicated React component components/Webmentions.js. This component fetches the Webmentions from our API and renders them.
import { useEffect, useState } from "react";

// React component to display Webmentions for a given page
const Webmentions = ({ targetUrl }) => {
  const [mentions, setMentions] = useState([]);

  useEffect(() => {
  // Fetch Webmentions for the target URL from the API route
    fetch(`/api/get-webmentions?target=${encodeURIComponent(targetUrl)}`)
      .then((res) => res.json())
      .then((data) => setMentions(data));
  }, [targetUrl]);

  return (
    <div>
      <h3>Webmentions</h3>
      {mentions.length === 0 ? (
        <p>No webmentions yet.</p>
      ) : (
        mentions.map((mention) => (
          <div className="vcard h-card p-author" key={mention.wm_id} style={{ border: "1px solid #ddd", padding: "10px", marginBottom: "10px" }}>
            {mention.author_photo && (
               // Display author profile picture if available
              <img src={mention.author_photo} alt={mention.author_name} className="u-photo" style={{ width: "40px", height: "40px", borderRadius: "50%" }} />
            )}
            <p>
              <strong>{mention.author_name}</strong> {mention.wm_property.replace("-", " ")}
              {mention.wm_property === "like-of" && " ❤️"}
              {mention.wm_property === "repost-of" && " 🔁"}
              {mention.wm_property === "in-reply-to" && " 💬"}
            </p>
            <a className="u-url" href={mention.url || mention.wm_source} target="_blank" rel="noopener noreferrer">View Mention</a>
          </div>
        ))
      )}
    </div>
  );
};

export default Webmentions;
I highly recommend periodically verifying the authenticity of Webmention sources to prevent spam.
Testing Webmentions
To ensure your Webmentions setup works correctly, use the following tools:
- Webmention Rocks! – A tool for testing Webmention implementations.
By integrating Webmentions into your Next.js site, you can create an interactive and engaging web community. Whether you're running a blog, portfolio, or e-commerce site, Webmentions provide a powerful way to enhance content, boost SEO, and encourage meaningful connections.
If you have created a response to this post you can send me a webmention and it will appear below the post.
More Links
- IndieWeb Webmention
- You can read more about Webmention and the IndieWeb on the https://indieweb.org/.

Many developers rely on Google’s Static Maps API to generate map images, but this has limitations such as:
- API rate limits
- Cost for high-volume usage
- Potential data privacy concerns
- Dependency on an external service
For a long time I was looking for an alternative to Maps Static API from Google which can be selfhosted but I couldn't find anything which seemed to fit my needs.
However I found staticmaps which is a Node.JS library for creating map images with markers, polylines, polygons and text. But the library doesn't provide a web interface so I decided to built one on top of it with express and containerized the staticmaps API.
Docker Static Maps API
docker-staticmaps is a containerized web version for staticmaps with express.
In general docker-staticmaps provides a self-hosted alternative that allows you to generate static map images on your own server without relying on third-party APIs.
Demo
Usage
To get a static map from the endpoint /staticmaps several prameters have to be provided.
center- Center coordinates of the map in the formatlon, latzoom- Set the zoom level for the map.width- default300- Width in pixels of the final imageheight- default300- Height in pixels of the final imageformat- defaultpng(e.g.png,jpgorwebp)basemap- defaultosm- Map base layer
Basemaps
For different basemaps docker-staticmaps is using exisiting tile-services from various providers. Be sure to check their Terms of Use for your use case or use a custom tileserver with the tileUrl parameter!
basemap- default "osm" - Select the basemaposm- default - Open Street Mapstreets- Esri street basemapsatellite- Esri's satellite basemaphybrid- Satellite basemap with labelstopo- Esri topographic mapgray- Esri gray canvas with labelsgray-background- Esri gray canvas without labelsoceans- Esri ocean basemapnational-geographic- National Geographic basemapotm- OpenTopoMapstamen-toner- Stamen Toner black and white map with labelsstamen-toner-background- Stamen Toner map without labelsstamen-toner-lite- Stamen Toner Light with labelsstamen-terrain- Stamen Terrain with labelsstamen-terrain-background- Stamen Terrain without labelsstamen-watercolor- Stamen Watercolorcarto-light- Carto Free usage for up to 75,000 mapviews per month, non-commercial services only.carto-dark- Carto Free usage for up to 75,000 mapviews per month, non-commercial services only.carto-voyager- Carto Free usage for up to 75,000 mapviews per month, non-commercial services only.custom- Pass through the tile URL using parametertileurl
Polylines
With the parameter polyline you can add a polyline to the map in the following format:
polyline=polylineStyle|polylineCoord1|polylineCoord2|...
polylineCoord- required - in formatlat,lonand seperated by|. Atleast two locations are needed to draw a polyline.
The polylineStyle consists of the following two parameters separated by |.
weight- default5- Weight of the polyline in pixels, e.g.weight:5color- defaultblue-24-Bit-color hex value, e.g.color:0000ff
If no center is specified, the polyline will be centered.
Polyline with no
zoom, weight:6 and color:0000ff
http://localhost:3000/staticmaps?width=600&height=600&polyline=weight:6|color:0000ff|48.726304979176675,-3.9829935637739382|48.72623035828412,-3.9829726446543385|48.726126671101639,-3.9829546542797467|48.725965124843256,-3.9829070729298808|48.725871429380568,-3.9828726793245273|48.725764250990267,-3.9828064532306628|48.725679557682362,-3.9827385375789146|48.72567025076134,-3.9827310750289113|48.725529844164292,-3.9826617613709225|48.725412537198615,-3.9826296635284164|48.725351694726704,-3.9826201452878531|48.725258599474508,-3.9826063049230411|48.725157520450125,-3.9825900299314232|48.725077863838543,-3.9825779905509102|48.724930435729831,-3.9825514102373938|48.724815578113535,-3.9825237355887291|48.724760905376989,-3.9825013965800564|48.724677938456551,-3.9824534296566916|48.724379435330384,-3.9822469276001118|48.724304509274596,-3.9821850264836076|48.7242453124599,-3.9821320570321772|48.724206187829317,-3.9821063430223207|48.724117073204575,-3.9820862134785551

Polygons
With the parameter polygon you can add a polygon to the map in the following format:
polygon=polygonStyle|polygonCoord1|polygonCoord2|...
polygonCoord- required - in formatlat,lonand seperated by|. First and last locations have to be the same to close the polygon.
The polygonStyle consists of the following two parameters separated by |.
color- defaultblue-24-Bit-color hex value, e.g.color:4874dbweight- default5- Weight of the polygon in pixels, e.g.weight:5fill- defaultgreen-24-Bit-color hex value, e.g.fill:eb7a34
If no center is specified, the polygon will be centered.
http://localhost:3000/staticmaps?width=600&height=600&polygon=color:4874db|weight:7|fill:eb7a34|41.891169,12.491691|41.890633,12.493697|41.889012,12.492989|41.889467,12.490811|41.891169,12.491691Polygon with no
zoom, color:4874db,weight:7 and fill:eb7a3

Markers
With the parameter markers you can draw one or multiple markers depending on how much pair of coordinates you pass to the parameter
markers=markerCoord1|markerCoord2|...
markerCoord- required - in formatlat,lonand separated by|. Atleast one coordinate is needed to draw a marker.
If no center is specified, the markers will be centered.
Markers
http://localhost:3000/staticmaps?width=600&height=600&markers=48.726304979176675,-3.9829935637739382|48.724117073204575,-3.9820862134785551

Circles
With the parameter circle you can add a circle to the map in the following format:
circle=circleStyle|circleCoord
circleCoord- required - in formatlat,lonand separated by|. Atleast one locations is needed to draw a marker.
The circleStyle consists of the following parameters seperated by |.
radius- required - Circle radius in meter, e.g.radius:500color- default#0000bb- Stroke color of the circle, e.g.color:#0000bbwidth- default3- Stroke width of the circle, e.g.width:3fill- default#AA0000- Fill color of the circle, e.g.fill:#AA0000
If no center is specified, the circle will be centered.
Circle with no zoom
http://localhost:3000/staticmaps?width=600&height=600&basemap=osm&circle=radius:100|48.726304979176675,-3.9829935637739382

More usage Examples
Minimal example:
center and zoom
http://localhost:3000/staticmaps?center=-119.49280,37.81084&zoom=9

width=500, height=500, center=-73.99515,40.76761, zoom=10, format=webp, basemap=carto-voyager
http://localhost:3000/staticmaps?width=500&height=500¢er=-73.99515,40.76761&zoom=10&format=webp&basemap=carto-voyager

Markers and Polyline
http://localhost:3000/staticmaps?width=600&height=600&polyline=weight:6|color:0000ff|48.726304979176675,-3.9829935637739382|48.72623035828412,-3.9829726446543385|48.726126671101639,-3.9829546542797467|48.725965124843256,-3.9829070729298808|48.725871429380568,-3.9828726793245273|48.725764250990267,-3.9828064532306628|48.725679557682362,-3.9827385375789146|48.72567025076134,-3.9827310750289113|48.725529844164292,-3.9826617613709225|48.725412537198615,-3.9826296635284164|48.725351694726704,-3.9826201452878531|48.725258599474508,-3.9826063049230411|48.725157520450125,-3.9825900299314232|48.725077863838543,-3.9825779905509102|48.724930435729831,-3.9825514102373938|48.724815578113535,-3.9825237355887291|48.724760905376989,-3.9825013965800564|48.724677938456551,-3.9824534296566916|48.724379435330384,-3.9822469276001118|48.724304509274596,-3.9821850264836076|48.7242453124599,-3.9821320570321772|48.724206187829317,-3.9821063430223207|48.724117073204575,-3.9820862134785551&markers=48.726304979176675,-3.9829935637739382|48.724117073204575,-3.9820862134785551

Deployment
with Docker
docker run -d  \
  --name='static-maps-api' \
  -p '3003:3000/tcp' \
  'mxdcodes/docker-staticmaps:latest'
with Node.js
git clone https://github.com/dietrichmax/docker-staticmaps
npm i
npm run start
Links
]]>
In general there are two possibilies to use GoogleAdsense on your GatsbyJS website:
- Auto Ads and
- custom ad blocks.
Depending on whether you choose to include Adsense ads on certain spots or whether you will leave this job to the Google AI, you can choose one/and or the other.
Auto Ads
With Auto Ads, the optimal positions for an advertising banner are determined using a Google AI and a display ad is automatically switched there. All you have to do is place the following AdSense code in html.js.
<script data-ad-client="ca-pub-0037698828864449" async src="proxy.php?url=https://pagead2.googlesyndication.com/pagead/js/adsbygoogle.js"></script>
 and activate Auto ads in Adsense.
On GIS-Netzwerk.com I used Auto ads and I'm honestly surprised how well it works. Ads are displayed in a text every few paragraphs and are also responsive.
Ad loads
You also have the option of increasing or decreasing the number of ads in the settings. Unfortunately, you cannot specify a specific number of ads.

In my opinion, a lot of ads are shown even when you set it to "min". You can play around with the ad load and find out the best setting for your purposes. Somestimes it can take a few minutes until the new ad load is effective.
Display formats
You can also influence the ad formats. Basically there are:
- In-page ads (displayed in the main part of the page)
- Matched content (tool for content promotion)
- Anchor ads (mobile ads on the edge of the screen)
- Vignette ads (mobile full screen display, at page transitions)
I have only deactivated anchor texts, because I personally find them very annoying.

In addition, you can also completely exclude individual pages from advertisements.
Adsense with GatsbyJS
If you want to use Auto ads on your GatsbyJS page, you can do it super easily with the plugin gatsby-plugin-google-adsense.
Install
npm install --save gatsby-plugin-google-adsense
or
yarn add gatsby-plugin-google-adsense
modify gatsby-config.js
// In your gatsby-config.js file
plugins: [
    {
      resolve: `gatsby-plugin-google-adsense`,
      options: {
        publisherId: `ca-pub-xxxxxxxxxx`
      },
    },
]
The remaining settings can then be adjusted on Adsense.
Ad units
In addition to auto ads, there is also the "classic" option of inserting individual ad units at specific positions. With the React Component react-adsense you can insert Google AdSense and Baidu ads in any place.
npm install --save react-adsense
or
yarn add react-adsense
In order for the components to be rendered, you still need the AdSense script code. You can either insert this manually in the html.js file or, if you want to combine individual ad units with Auto ads, you can also use the plug-in already mentioned to insert the script.
When auto ads and individual ad units are combined, the individual ad units always have a higher "priority". This means that all ad units that are inserted manually are usually also rendered and, if the text / ads ratio permits, additional ads from Auto ads are automatically inserted.
If the script has been integrated and react-adsense has been installed, you can use
import React from 'react';
import AdSense from 'react-adsense';

// ads with no set-up
<AdSense.Google
  client='ca-pub-7292810486004926'
  slot='7806394673'
/>

// ads with custom format
<AdSense.Google
  client='ca-pub-7292810486004926'
  slot='7806394673'
  style={{ width: 500, height: 300, float: 'left' }}
  format=''
/>

// responsive and native ads
<AdSense.Google
  client='ca-pub-7292810486004926'
  slot='7806394673'
  style={{ display: 'block' }}
  layout='in-article'
  format='fluid'
/>

// auto full width responsive ads
<AdSense.Google
  client='ca-pub-7292810486004926'
  slot='7806394673'
  style={{ display: 'block' }}
  format='auto'
  responsive='true'
  layoutKey='-gw-1+2a-9x+5c'
/>
to insert components for the ad units.
The respective client id
client='ca-pub-7292810486004926'
and the ad slot
slot='7806394673'
must always be specified.
The rest is optional.
Optional props:
    className:
    style:
    layout:
    layoutKey:
    format:
    responsive:
In case you have more questions there is also ad Adsense community where you can get some answers. Google AdSense Help Community
]]>
Maps have long been a fundamental element in web development, transforming static websites into dynamic, location-aware applications. Whether you're navigating through the bustling streets of a city, planning a route for your next adventure, or visualizing data in a geographic context, maps play a crucial role in enhancing user experiences.
Overview of OpenLayers and its Capabilities
OpenLayers, a robust open-source JavaScript library, stands at the forefront of enabling you to seamlessly integrate interactive maps into web applications. Its versatile and feature-rich nature makes it a go-to choice for projects requiring dynamic geospatial visualizations.
At its core, OpenLayers provides a comprehensive set of tools to manipulate maps, overlay data, and interact with geographic information. Its capabilities extend from simple map displays to complex GIS applications, offering you the flexibility to create compelling and interactive mapping solutions. OpenLayers supports a modular and extensible architecture, allowing you to tailor their maps precisely to project requirements.
Explanation of Key Concepts: Maps, Layers, Views, and Sources
Understanding the key concepts within OpenLayers is fundamental to harnessing its full potential:
Map
In OpenLayers, a map is a container for various layers and the view, serving as the canvas where geographical data is displayed. you can create multiple maps within an application, each with its set of layers and views.
The markup below could be used to create a <div> that contains your map.
<div id="map" style="width: 100%; height: 400px"></div>
The script below constructs a map that is rendered in the <div> above, using the map id of the element as a selector.
import Map from 'ol/Map.js';

const map = new Map({target: 'map'});
API Doc: ol/Map
View
The view in OpenLayers determines the center, zoom and projection of the map. It acts as the window through which users observe the geographic data. you can configure different views to represent varying perspectives or zoom levels within a single map.
import View from 'ol/View.js';

map.setView(new View({
  center: [0, 0],
  zoom: 2,
}));
The projection determines the coordinate system of the center and the units for map resolution calculations. If not specified (like in the above snippet), the default projection is Spherical Mercator (EPSG:3857), with meters as map units.
The available zoom levels are determined by maxZoom (default: 28), zoomFactor (default: 2) and maxResolution (default is calculated in such a way that the projection's validity extent fits in a 256x256 pixel tile).
API Doc: ol/View
Source
Sources provide the data for layers. OpenLayers supports different sources, including Tile sources for raster data, Vector sources for vector data, and Image sources for static images. These sources can fetch data from various providers or be customized to handle specific data formats.
To get remote data for a layer you can use the ol/source subclasses.
import OSM from 'ol/source/OSM.js';

const source = OSM();
API Doc: ol/source.
Layer
Layers define the visual content of the map. OpenLayers supports various layer types, such as Tile layers for raster data, Vector layers for vector data, and Image layers for rendering images. Layers can be stacked to combine different types of information into a single, coherent map.
ol/layer/Tile- Renders sources that provide tiled images in grids that are organized by zoom levels for specific resolutions.ol/layer/Image- Renders sources that provide map images at arbitrary extents and resolutions.ol/layer/Vector- Renders vector data client-side.ol/layer/VectorTile- Renders data that is provided as vector tiles.
import TileLayer from 'ol/layer/Tile.js';

// ...
const layer = new TileLayer({source: source});
map.addLayer(layer);
API Doc: ol/slayer.
Installing OpenLayers
To start your journey into the world of interactive maps with OpenLayers and React, the first step is to install OpenLayers using your preferred package manager – npm or yarn. Open a terminal and execute one of the following commands:
npm install ol
# or
yarn add ol
This command fetches the latest version of OpenLayers and installs it as a dependency in your project. With the library now available, you're ready to embark on the next steps of integrating OpenLayers with React.
Setting Up a Basic React Component for the Map
Now that OpenLayers is part of your project, the next crucial step is to create a React component that will serve as the container for your interactive map.
If you try to render the Map before the component has been mounted (meaning outside of useEffect) like following you will get an error message.
const MapComponent = () => {
  const mapRef = useRef()

  // Incorrect: Rendering content before the component has mounted
  const map = new Map({
      target: mapRef.current
      ...
  })
  return <div ref={mapRef} style={{ width: '100%', height: '400px' }}></div>;
};
Solution:
Ensure that you only render content when the component has properly mounted. You can use lifecycle methods like componentDidMount in class components or useEffect in functional components.
const MapComponent = () => {
  const mapRef = useRef()

  useEffect(() => {
    // Code here runs after the component has mounted
    const map = new Map({
      target: mapRef.current,
    ...
    }
    return () => map.setTarget(undefined)
  }, []);

  return <div ref={mapRef} style={{ width: '100%', height: '400px' }}></div>;
};
The return function will reponsible for resource cleanup for the map.
So a basic OpenLayers React example could look like the following:
// MapComponent.js
import React, { useEffect, useRef } from "react"
import { Map, View } from "ol"
import TileLayer from "ol/layer/Tile"
import OSM from "ol/source/OSM"
import "ol/ol.css"

function MapComponent() {
  const mapRef = useRef<HTMLDivElement | null>(null)

  useEffect(() => {
    const osmLayer = new TileLayer({
      preload: Infinity,
      source: new OSM(),
    })

    const map = new Map({
      target: mapRef.current,
      layers: [osmLayer],
      view: new View({
        center: [0, 0],
        zoom: 0,
      }),
    })
    return () => map.setTarget(undefined)
  }, [])

  return (
    <div
      style={{ height: "300px", width: "100%" }}
      ref={mapRef}
      className="map-container"
    />
  )
}

export default MapComponent
In this example, the MapComponent initializes an OpenLayers map with a simple OpenStreetMap layer and the useEffect hook ensures that the map is created when the component mounts.
To ensure the correct styling and functionality of OpenLayers, it's crucial to import the necessary CSS and modules. In the MapComponent.js file, notice the import statement for the OpenLayers CSS:
import 'ol/ol.css'; // Import OpenLayers CSS
This line imports the essential stylesheets required for OpenLayers to render properly. Additionally, other modules from OpenLayers, such as Map, View, TileLayer, and OSM, are imported to create the map instance and layers.
By following these steps, you've successfully set up a basic React component housing an OpenLayers map. You're now ready to delve deeper into the capabilities of OpenLayers and explore advanced features for creating dynamic and interactive maps within your React applications.
Also I created two examples for React and Openlayers:
- OpenLayers 6 React example using a functional component
- OpenLayers 6 React example using a class component
Markers, Popups, and Custom Overlays
Markers, popups, and custom overlays enhance the visual storytelling capabilities of a map, providing users with valuable context. OpenLayers simplifies the process of adding these elements:
- Markers: Representing specific points of interest on a map becomes intuitive with markers. you can add markers to highlight locations, making the map more informative and engaging.

- Popups: Interactive popups can be attached to markers, providing additional information when users click on specific map features. This allows for a more detailed exploration of the data.

- Custom Overlays: OpenLayers allows you to create custom overlays, enabling the display of additional information in a tailored manner. This could include tooltips, legends, or any other supplementary elements.
Here's a simplified example demonstrating the addition of a marker with a popup:
// MarkerPopupMap.js
import { useEffect, useRef } from "react"
import "ol/ol.css"
import Map from "ol/Map"
import View from "ol/View"
import Overlay from "ol/Overlay"
import { toLonLat } from "ol/proj.js"
import { toStringHDMS } from "ol/coordinate.js"
import styled from "styled-components"
import { Icon, Style } from "ol/style.js"
import Feature from "ol/Feature.js"
import { Vector as VectorSource } from "ol/source.js"
import { Tile as TileLayer, Vector as VectorLayer } from "ol/layer.js"
import Point from "ol/geom/Point.js"

const Popup = styled.div`
  background-color: var(--content-bg);
  padding: var(--space-sm);
`

const MarkerPopupMap = () => {
  const mapRef = useRef()
  const popupRef = useRef()

  const osm = new TileLayer({
      preload: Infinity,
      source: new OSM(),
    })

  const iconFeature = new Feature({
    geometry: new Point([0, 0]),
    name: "Null Island",
    population: 4000,
    rainfall: 500,
  })

  const iconStyle = new Style({
    image: new Icon({
      anchor: [0.5, 46],
      anchorXUnits: "fraction",
      anchorYUnits: "pixels",
      src: "https://openlayers.org/en/latest/examples/data/icon.png",
    }),
  })

  iconFeature.setStyle(iconStyle)

  const vectorSource = new VectorSource({
    features: [iconFeature],
  })

  const vectorLayer = new VectorLayer({
    source: vectorSource,
  })

  useEffect(() => {
    const overlay = new Overlay({
      element: popupRef.current,
      autoPan: {
        animation: {
          duration: 250,
        },
      },
    })

    const map = new Map({
      target: mapRef.current,
      layers: [osm, vectorLayer],
      view: new View({
        center: [0, 0],
        zoom: 3,
      }),
      overlays: [overlay],
    })

    /**
     * Add a click handler to the map to render the popup.
     */

    map.on("singleclick", function (evt) {
      // Get Coordinates of click
      const coordinate = evt.coordinate;
      const hdms = toStringHDMS(toLonLat(coordinate));

      // Show popup at clicked position
      overlay.setPosition(coordinate);

      if (popupRef.current) {
        popupRef.current.innerHTML = `<p>You clicked here:</p><code>` + hdms + `</code>`;
      }

      overlay.setPosition(coordinate)
    })

    return () => map.setTarget(undefined)
  }, [])

  return (
    <div>
      <div ref={mapRef} style={{ width: "100%", height: "400px" }} />
      <div ref={popupRef} className="ol-popup" style={popupStyle} />
    </div>
  )
}

const popupStyle = {
  position: "absolute",
  backgroundColor: "white",
  padding: "5px",
  borderRadius: "5px",
  border: "1px solid black",
  transform: "translate(-50%, -100%)",
  pointerEvents: "none",
  width: "220px",
  color: "black"
};

export default MarkerPopupMap
Click anywhere on the map to create a popup:
Handling Map Events and User Interactions:
Interactive maps come to life when you handle events and user interactions effectively. OpenLayers simplifies this process by providing robust event handling mechanisms. Consider the following example demonstrating how to capture a click event on the map:
    // Handle a click event on the map
    map.on('click', (event) => {
      const clickedCoordinate = event.coordinate;
      console.log('Clicked Coordinate:', clickedCoordinate);
    });
This example displays OpenLayers' event handling to log the coordinates of a click event on the map. you can extend this functionality to respond to various user interactions, such as dragging, zooming, or even custom gestures.
useState for Managing State: Use the useState hook to manage state within the React component. This is particularly useful for dynamic changes to the map, such as updating the center or zoom level based on user interactions.
const [mapCenter, setMapCenter] = useState([0, 0]);

// Update the map's center based on user interaction
const handleMapInteraction = (event) => {
  const newCenter = event.map.getView().getCenter();
  setMapCenter(newCenter);
};
Advanced OpenLayers Map Features
Adding Vector Layers and Working with GeoJSON Data
Vector layers in OpenLayers allow you to display and interact with vector data, opening up possibilities for intricate and detailed map representations. Leveraging GeoJSON, a popular format for encoding geographic data, is a common practice. Below is an example of incorporating a vector layer with GeoJSON data into a React component:
// VectorLayerMap.js
import { useEffect, useRef } from "react"
import "ol/ol.css"
import Map from "ol/Map"
import View from "ol/View"
import TileLayer from "ol/layer/Tile"
import OSM from "ol/source/OSM"
import VectorLayer from "ol/layer/Vector"
import VectorSource from "ol/source/Vector"
import GeoJSON from "ol/format/GeoJSON"
import {getCenter} from 'ol/extent';

const VectorLayerMap = () => {
  const mapRef = useRef()

  // read geojson feature
  const geoJSONFeatures = new GeoJSON().readFeatures(geojsonObject)

  // create vector source
  const vectorSource = new VectorSource({
    features: geoJSONFeatures,
  })

  // create vector layer with source
  const vectorLayer = new VectorLayer({
    source: vectorSource,
  })

  // default view
  const view = new View({
    center: [0, 0],
    zoom: 2,
  })

  useEffect(() => {
    const map = new Map({
      target: mapRef.current,
      layers: [
        new TileLayer({
          source: new OSM(),
        }),
        vectorLayer,
      ],
      view: view
    })

    // fit view to geometry of geojson feature with padding
    view.fit(geoJSONFeatures[0].getGeometry().getExtent(), { padding: [100, 100, 100, 100]});

    return () => map.setTarget(undefined)
  }, [])

  return (
    <div
      ref={mapRef}
      style={{ position: "relative", width: "100%", height: "400px" }}
    ></div>
  )
}

export default VectorLayerMap

const geojsonObject = {
  type: "Feature",
  geometry: {
    type: "MultiLineString",
    coordinates: [
      [
        [-1e6, -7.5e5],
        [-1e6, 7.5e5],
      ],
      [
        [1e6, -7.5e5],
        [1e6, 7.5e5],
      ],
      [
        [-7.5e5, -1e6],
        [7.5e5, -1e6],
      ],
      [
        [-7.5e5, 1e6],
        [7.5e5, 1e6],
      ],
    ],
  },
}
Optimizing React and OpenLayers Integration: Strategies for Rendering Performance
1. Addressing Rendering Performance Concerns:
Efficient rendering is paramount in any web application, and integrating OpenLayers with React requires careful consideration of performance concerns. Here are some strategies to address rendering performance:
Debouncing and Throttling: When handling events that trigger frequent updates, such as map movements or zoom changes, implement debouncing or throttling techniques. This prevents excessive re-renders and ensures that updates are processed at a controlled rate.
Batched State Updates: Use React's
setStatebatching mechanism to group multiple state updates into a single render cycle. This reduces the number of renders triggered by multiple state changes, resulting in a more efficient rendering process.
2. Implementing Lazy Loading for Map Components:
To enhance overall application performance, especially in scenarios where maps are not initially visible or are part of larger applications, consider implementing lazy loading for map components. This ensures that the OpenLayers library and associated map components are only loaded when needed.
- Dynamic Imports: Use dynamic imports and React's
React.lazyto load OpenLayers and map components lazily. This approach allows you to split your code into smaller chunks that are loaded on-demand, reducing the initial page load time.
// Example using React.lazy
const LazyLoadedMap = React.lazy(() => import('./LazyLoadedMap'));

const App = () => (
  <div>
    {/* Other components */}
    <React.Suspense fallback={<div>Loading...</div>}>
      <LazyLoadedMap />
    </React.Suspense>
  </div>
);
3. Memoization Techniques Using React Hooks:
Memoization is a powerful technique to optimize expensive calculations and prevent unnecessary renders. React provides hooks like useMemo and useCallback for effective memoization.
useMemo: Use useMemo to memoize the result of a computation and ensure that it is only recalculated when dependencies change. This is particularly useful when dealing with derived data or complex computations within your map components.
const expensiveData = /* some expensive computation */;

const MyMapComponent = ({ center, zoom }) => {
  const memoizedData = React.useMemo(() => expensiveData, [center, zoom]);

  // Component logic using memoizedData...
};
useCallback: When passing functions as props to child components, use useCallback to memoize those functions. This ensures that the same function reference is maintained across renders unless its dependencies change.
const MyMapComponent = ({ onMapClick }) => {
  const handleClick = React.useCallback(() => {
    // Handle map click...
    onMapClick();
  }, [onMapClick]);

  // Component logic using handleClick...
};
These practices contribute to a more responsive and optimized integration of OpenLayers within React applications, enhancing the overall user experience.
For additional inspiration and examples, explore the OpenLayers API Documentation. You can also find valuable examples specific to React and OpenLayers at https://codesandbox.io/examples/package/react-openlayers.
Resources:
]]>
GIS and Geo Blogs
Of course, to find out new things, I take a look at one or the other website that deals with GIS Or geoinformatics in general. You can find them here:
- GIS Lounge
Maps and GIS by Caitlin Dempsey Morais. She has been blogging about GIS for more than 20 years.
- GIS Geography
Blog about GIS and Geographie.
- Free and Open Source GIS Ramblings
Anita Graser's blog about QGIS, open source, analysis and simulation.
- Geospatial World
How does location localization affect us?
https://www.geospatialworld.net
- Geoawesomeness
Blog about GIS, geodata and everything that goes with it.
- GISTimes
GIStimes is for everything that happens on the geodata market.
- GIS Professional
GIS news and articles about GNSS, Big Data, Addressing, BIM, and Smart Cities.
https://www.gis-professional.com/news
- Geospatial-solutions
http://geospatial-solutions.com/
- Google Maps Blog
Google Maps blog.
https://www.blog.google/products/maps/
- Carto
SaaS provider CartoDB also runs a very interesting GIS blog.
- Reddit r/gis GIS-Community
A Reddit community about geographic information systems.
- Benjaminspaulding
Geodata, analysis, programming.
https://www.benjaminspaulding.com/
- GISuser
GIS and technology news for mapping experts.
- Esri Newsroom
Esri's blog.
https://www.esri.com/about/newsroom/blog
- ThinkGeoBlog
GIS themes for .NET developers.
There is also a much larger list of links to GIS Blogs on Wiki.GIS (http://wiki.gis.com/wiki/index.php/ListofGIS-related_Blogs). By the way, Wiki.GIS is a very extensive GIS encyclopedia.
]]>
In this article, we'll explore how to Dockerize a Next.js application and automate its deployment using GitHub Actions, thereby simplifying the deployment workflow and enhancing development productivity.
Prerequisites
Before we dive into Dockerizing our Next.js application and setting up GitHub Actions for deployment, ensure you have the following prerequisites:
- A Next.js project.
- Docker installed on your local machine.
- A GitHub repository for your Next.js project.
Setting up Docker
Docker allows you to package your application and its dependencies into a container, ensuring consistency across different environments. Start by creating a Dockerfile in the root of your Next.js project:
FROM node:18-alpine AS base

# Install dependencies only when needed
FROM base AS deps
# Check https://github.com/nodejs/docker-node/tree/b4117f9333da4138b03a546ec926ef50a31506c3#nodealpine to understand why libc6-compat might be needed.
RUN apk add --no-cache libc6-compat
WORKDIR /app

# Install dependencies based on the preferred package manager
COPY package.json yarn.lock* package-lock.json* pnpm-lock.yaml* ./
RUN \
  if [ -f yarn.lock ]; then yarn --frozen-lockfile; \
  elif [ -f package-lock.json ]; then npm ci; \
  elif [ -f pnpm-lock.yaml ]; then corepack enable pnpm && pnpm i --frozen-lockfile; \
  else echo "Lockfile not found." && exit 1; \
  fi


# Rebuild the source code only when needed
FROM base AS builder
WORKDIR /app
COPY --from=deps /app/node_modules ./node_modules
COPY . .

# Next.js collects completely anonymous telemetry data about general usage.
# Learn more here: https://nextjs.org/telemetry
# Uncomment the following line in case you want to disable telemetry during the build.
# ENV NEXT_TELEMETRY_DISABLED 1

RUN \
  if [ -f yarn.lock ]; then yarn run build; \
  elif [ -f package-lock.json ]; then npm run build; \
  elif [ -f pnpm-lock.yaml ]; then corepack enable pnpm && pnpm run build; \
  else echo "Lockfile not found." && exit 1; \
  fi

# Production image, copy all the files and run next
FROM base AS runner
WORKDIR /app

ENV NODE_ENV production
# Uncomment the following line in case you want to disable telemetry during runtime.
# ENV NEXT_TELEMETRY_DISABLED 1

RUN addgroup --system --gid 1001 nodejs
RUN adduser --system --uid 1001 nextjs

COPY --from=builder /app/public ./public

# Set the correct permission for prerender cache
RUN mkdir .next
RUN chown nextjs:nodejs .next

# Automatically leverage output traces to reduce image size
# https://nextjs.org/docs/advanced-features/output-file-tracing
COPY --from=builder --chown=nextjs:nodejs /app/.next/standalone ./
COPY --from=builder --chown=nextjs:nodejs /app/.next/static ./.next/static

USER nextjs

EXPOSE 3000

ENV PORT 3000
# set hostname to localhost
ENV HOSTNAME "0.0.0.0"

# server.js is created by next build from the standalone output
# https://nextjs.org/docs/pages/api-reference/next-config-js/output
CMD ["node", "server.js"]
This Dockerfile is the default Dockerfile provided by Vercel to set up a Node.js environment, install dependencies, build the Next.js application, and exposing port 3000.
You have to ensure you are using output: "standalone" in your next.config.js.
const nextConfig = {
  output: "standalone",
}
The standalone mode in Next.js builds a self-contained application that includes all necessary files, libraries, and dependencies required to run the application. This contrasts with the default mode ("experimental-serverless-trace"), which generates smaller bundles but relies on additional runtime steps.
Before proceeding further, it's crucial to test our Dockerized Next.js application locally to ensure everything functions as expected. Open a terminal in the project directory and execute the following commands:
# Build the Docker image
docker build -t my-nextjs-app .

# Run the Docker container
docker run -p 3000:3000 my-nextjs-app
Visit http://localhost:3000 in your web browser to verify that your Next.js application is running within the Docker container.
Setting up GitHub Actions for Continuous Deployment:
GitHub Actions automate the CI/CD pipeline directly from your GitHub repository. Basically the pipeline looks like this:
- Code Commit & Push: Developer writes code and pushes changes to a GitHub repository. This triggers the GitHub Actions workflow, defined in .github/workflows/docker-ci.yml.
name: Build and Deploy Next.js

on:
  push:
    branches:
      - main # Triggers when code is pushed to the main branch
Once the workflow is triggered, the following steps occur:
- Checkout Repository: Pulls the latest code from GitHub.
  jobs:
  build:
    runs-on: ubuntu-latest

    steps:
      - name: Checkout repository
        uses: actions/checkout@v3
- Install Dependencies & Build Next.js: Installs project dependencies and builds the Next.js app in standalone mode.
      - name: Install dependencies
        run: npm install

      - name: Build Next.js app
        run: npm run build
- Run Tests (optional but highly recommended): Ensures the application works before deployment.
      - name: Run tests
        run: npm run test
- Build and Tag Docker Image: Creates a Docker image with the Next.js app.
      - name: Build Docker Image
        run: docker build -t myapp:latest .
- Push Docker Image to Registry: Authenticates and pushes the image to Docker Hub or GitHub Container Registry.
        - name: Log in to Docker Hub
        run: echo "${{ secrets.DOCKER_PASSWORD }}" | docker login -u "${{ secrets.DOCKER_USERNAME }}" --password-stdin

      - name: Push
Putting it together: Create a .github/workflows/pipeline.yml file with the following content if you want to publish your docker images to Docker Hub and GitHub. If you just want to use one of them you have to remove the according login step and remove the according tags.
name: Docker Build & Publish

on:
  push:
    branches: [main]

jobs:
  push_to_registries:
    name: Push Docker image to multiple registries
    runs-on: ubuntu-latest
    permissions:
      packages: write
      contents: read
      attestations: write
      id-token: write

    steps:
      - name: Check out repository code 🛎️
        uses: actions/checkout@v4

      - name: Set up Docker Buildx 🚀
        uses: docker/setup-buildx-action@v3

      - name: Login to Docker Hub 🚢
        uses: docker/login-action@v3
        with:
          username: ${{ secrets.DOCKER_HUB_USERNAME}}
          password: ${{ secrets.DOCKER_HUB_ACCESS_TOKEN}}

      - name: Log in to the Container registry
        uses: docker/login-action@65b78e6e13532edd9afa3aa52ac7964289d1a9c1
        with:
          registry: ghcr.io
          username: ${{ github.actor }}
          password: ${{ secrets.GITHUB_TOKEN }}

      - name: Build and push 🏗️
        uses: docker/build-push-action@v2
        with:
          context: .
          file: ./Dockerfile
          push: true
          tags: |
            ${{ secrets.DOCKER_HUB_USERNAME}}/{docker_repository}:${{ github.sha }}
            ${{ secrets.DOCKER_HUB_USERNAME}}/{docker_repository}:latest
            ghcr.io/${{ github.repository }}:${{ github.sha }}
            ghcr.io/${{ github.repository }}:latest
If you want to publish to Docker Hub you have to store secrets ${{ secrets.DOCKER_USERNAME }} and ${{ secrets.DOCKER_PASSWORD }} in your repository's under settings -> Secrets and variables -> Actions -> Repository secrets.
This workflow will build your container from your GitHub repositiory and push it to your Docker Container registry with two tags:
:latestand:{github.sha}
Passing environment variables to the Workflow
In case you need some environment variables you have to adjust the Dockerfile with some additional parameters. To be able to use environment variables which are stored in your repository as secrets you will need to mount and export every environment variable like the following to your npm run build command.
RUN --mount=type=secret,id=NEXT_PUBLIC_CMS_URL \
  export NEXT_PUBLIC_CMS_URL=$(cat /run/secrets/NEXT_PUBLIC_CMS_URL) && \
  npm run build
You can have a look at the Dockerfile for my site for a example: personal website Dockerfile.
Also you will need to modify the step Build and push in the workflow like this:
- name: Build and push 🏗️
  uses: docker/build-push-action@v2
  with:
      context: .
      file: ./Dockerfile
      push: true
      tags: |
        ${{ secrets.DOCKER_HUB_USERNAME}}/personal-website:${{ github.sha }}
        ${{ secrets.DOCKER_HUB_USERNAME}}/personal-website:latest
      secrets: |
        "NEXT_PUBLIC_STRAPI_API_URL=${{ secrets.NEXT_PUBLIC_CMS_URL }}"
Conclusion
With this setup, every push to the main branch of your GitHub repository triggers the CI/CD pipeline. Continuous Integration and Continuous Deployment for Dockerized Next.js applications provide a streamlined and efficient development process, ensuring that your application is always in a deployable state. By combining GitHub Actions with Docker, you can automate the deployment process and focus on building and improving your Next.js application.
]]>
MapProxy is a powerful open-source proxy for geospatial data that allows for efficient caching and serving of map tiles. Combining MapProxy with Docker and Nginx can provide a scalable and easily manageable solution for serving cached map tiles. This guide will walk you through the process of setting up MapProxy using Docker and configuring Nginx to serve cached tiles.
Prerequisites:
- Docker installed on your system
- Basic understanding of Docker
- Basic understanding of Nginx
If you don't meet this prerequisites yet I recommend to have a look at the following guides first:
Set Up MapProxy with Docker
Start by creating a Network in Docker with:
sudo docker create network nginx
By adding the network nginx to the Nginx Container and the Mapproxy container the containers can communicate with each other without exposing ports on the server.
Create a Docker Compose file docker-compose.yml with the following content:
networks:
  default:
    external: true
    name: nginx

services:
  mapproxy:
    image: kartoza/mapproxy
    container_name: mapproxy
    restart: always
    environment:
      PRODUCTION: true
      PROCESSES: 4
      CHEAPER: 2
      THREADS: 8
      MULTI_MAPPROXY: true
      MULTI_MAPPROXY_DATA_DIR: /multi_mapproxy/configurations
      ALLOW_LISTING: true
    volumes:
      - /data/containers/mapproxy/data:/multi_mapproxy
Save the file and run:
docker-compose up -d
This will pull the MapProxy Docker image and start a container. MapProxy will be accessible on the container with http://localhost:8080.
Set Up Nginx with Docker
Afterwards you need to create a Docker Compose file docker-compose.yml for Nginx. Here's a example:
version: '3'

networks:
  default:
    external: true
    name: nginx

services:
  nginx:
    image: nginx:latest
    container_name: nginx
    restart: always
    ports:
      - "80:80"
      - "443:443"
    volumes:
      ## Config
      - /data/containers/nginx/config/:/etc/nginx/
      ## SSL
      - /etc/letsencrypt/:/etc/letsencrypt/
      - /etc/ssl/:/etc/ssl/
      ## Logs
      - /data/containers/nginx/logs/:/var/log/nginx
      ## Cache
      - /data/containers/nginx/cache:/var/cache/nginx
Then you can create a virtual host for mapproxy under /data/containers/nginx/config/sites-available/mapproxy with:
sudo nano /data/containers/nginx/config/sites-available/mapproxy
Copy and paste the following virtual host configuration for your Mapproxy Container :
upstream mapproxy_upstream {
  server mapproxy:8080;
}

server {

  server_name mapproxy.domain.com;

  listen 80;

  ## Mapproxy default
  location / {
    proxy_pass http://mapproxy_upstream/;
    proxy_set_header Host $http_host;
  }
}
After you created your configuration you need to create a symlink to /data/containers/nginx/config/sites-enabled/ with:
sudo ln -S /data/containers/nginx/config/sites-available/mapproxy /data/containers/nginx/config/sites-enabled/
In order that your domain gets resolved you have to create a A-record for your Domain under which you want to publish MapProxy which points to your server ip. Then you need to restart your Nginx Container and now should be able to access http://mapproxy.domain.com where you will be greeted by your MapProxy Instance.

Step 3: Caching the Tiles with MapProxy
So far you have set up Nginx and MapProxy with Docker and MapProxy will cache by default all served tiles with the default configuration. However there are some limitations to the MapProxy caching process because each time a tile gets requested from MapProxy, MapProxy will save the tile to it's cache. But it won't check by default if the tile is old and a newer tile could be served.
E.g. I am serving tiles from MapProxy which visualize my locations where I have ever been to. So I don't want to cache the tiles infinite because they change probably every day
But you can force MapProxy to refresh tiles from the source while serving if they are found to be expired. The validity conditions are the same as for seeding:
#Explanation
  # absolute as ISO time
  refresh_before:
    time: 2010-10-21T12:35:00
  # relative from the time of the tile request
  refresh_before:
    weeks: 1
    days: 7
    hours: 4
    minutes: 15
  # modification time of a given file
  refresh_before:
    mtime: path/to/file
So to stay at my example i added:
refresh_before:
      days 1
This way MapProxy will refresh tiles everyday. This of course only makes sense for data where you want always latest data
So edit your mapproxy.yaml like this:
services:
  demo:
  tms:
    use_grid_names: true
    # origin for /tiles service
    origin: 'nw'
  kml:
      use_grid_names: true
  wmts:
  wms:
    md:
      title: MapProxy WMS Proxy
      abstract: This is a minimal MapProxy example.

layers:
  - name: osm
    title: Omniscale OSM WMS - osm.omniscale.net
    sources: [osm_cache]

caches:
  osm_cache
    grids: [webmercator]
    sources: [osm_wms]
    refresh_before:
      days: 1

sources:
  osm_wms:
    type: wms
    req:
      url: https://maps.omniscale.net/v2/demo/style.default/service?
      layers: osm

grids:
    webmercator:
        base: GLOBAL_WEBMERCATOR

globals:
Save the file and restart your MapProxy Container.
Now MapProxy will always refresh tiles everyday.
Step 4: Access the MapProxy Tiles
Visit http://mapproxy.domain.com in your browser, and you should see MapProxy serving tiles through Nginx.
By following these steps, you've successfully set up MapProxy with Docker and configured Nginx to serve cached map tiles. This scalable solution allows for efficient geospatial data delivery with the added benefit of easy container management. Adjust the configurations based on your specific requirements and integrate this setup into your mapping projects.
If you decide to to take use of MultiMapProxy(scroll down to MultiMapProxy) you can just create more configuration files for MapProxy in /data/containers/mapproxy/data/configurations and append the cache path and location blocks like in your existing Nginx configuration for MapProxy.

Next.js Image Component next-image is a feature introduced in Next.js version 10.0.0 to optimize images and improve the performance of your web-application.
When you use the Next.js Image Component, it automatically optimizes and serves images in modern image formats that improves the performance of your web application. It supports various image sources, such as local images, images from the web, and third-party sources.
However you cannot transform image, e.g. crop images, which is the reason I was looking for a solution which enables my personal website mxd.codes to resize images to my needs.
imgproxy
imgproxy is an open-source image processing server designed to simplify the resizing, cropping, and manipulation of images on the fly. It is often used as part of a web application's infrastructure to ensure efficient delivery of images with optimized sizes and quality.
Key features of imgproxy include:
On-the-Fly Image Processing: Imgproxy allows you to resize, crop, rotate, and perform other image manipulations on the fly, based on the URL parameters. This enables efficient delivery of images in various sizes and formats without having to store multiple versions of the same image.
Security: Imgproxy provides security features such as URL signature generation. This helps prevent unauthorized access and abuse of the image manipulation service.
Performance: Imgproxy is designed to be performant and can efficiently handle high loads of image processing requests.
Integration with Existing Storage: Imgproxy can be integrated with various storage solutions, including Amazon S3, Google Cloud Storage, and more.
Deploy imgproxy with Docker Compose
While searching for a way to deploy imgproxy with docker I found a imgproxy Docker Compose Project on GitHub where I changed minor things like the volumes and the web-server configuration.
You can copy this docker-compose.ymlfile and paste it into Portainer or save it manually in a folder on your server.
version: '3'

################################################################################
# Ultra Image Server
# A production grade image processing server setup powered by imgproxy and nginx
#
# Author: Mai Nhut Tan <[email protected]>
# Copyright: 2021-2023 SHIN Company https://code.shin.company/
# URL: https://shinsenter.github.io/docker-imgproxy/
################################################################################

networks:
################################################################################
  default:
    driver: bridge


services:
################################################################################
  web:
    image: nginx:alpine
    container_name: imgproxy-nginx
    restart: always
    volumes:
      - /data/containers/imgproxy:/var/www/html:ro
      - /etc/imgproxy/imgproxy-nginx.conf:/etc/nginx/conf.d/default.conf:ro
    ports:
      - 8080:80
    links:
      - imgproxy:imgproxy
    environment:
      NGINX_ENTRYPOINT_QUIET_LOGS: 1

################################################################################
  imgproxy:
    restart: unless-stopped
    image: darthsim/imgproxy:${IMGPROXY_TAG:-latest}
    container_name: imgproxy_app
    security_opt:
      - no-new-privileges:true
    volumes:
      - /data/containers/imgproxy:/var/www/html:ro
    expose:
      - 8080
    healthcheck:
      test: ["CMD", "imgproxy", "health"]
    environment:
      ### See:
      ### https://docs.imgproxy.net/configuration/options

      ### log and debug
      IMGPROXY_LOG_LEVEL: "warn"
      IMGPROXY_ENABLE_DEBUG_HEADERS: "false"
      IMGPROXY_DEVELOPMENT_ERRORS_MODE: "false"
      IMGPROXY_REPORT_DOWNLOADING_ERRORS: "false"

      ### timeouts
      IMGPROXY_READ_TIMEOUT: 10
      IMGPROXY_WRITE_TIMEOUT: 10
      IMGPROXY_DOWNLOAD_TIMEOUT: 10
      IMGPROXY_KEEP_ALIVE_TIMEOUT: 300
      IMGPROXY_MAX_SRC_FILE_SIZE: 33554432 # 32MB
      IMGPROXY_MAX_SRC_RESOLUTION: 48

      ### image source
      IMGPROXY_TTL: 2592000 # client-side cache time is 30 days
      IMGPROXY_USE_ETAG: "false"
      IMGPROXY_SO_REUSEPORT: "true"
      IMGPROXY_IGNORE_SSL_VERIFICATION: "true"
      IMGPROXY_LOCAL_FILESYSTEM_ROOT: /home
      IMGPROXY_SKIP_PROCESSING_FORMATS: "svg,webp,avif"

      ### presets
      IMGPROXY_AUTO_ROTATE: "true"
      #IMGPROXY_WATERMARK_PATH: /home/noimage_thumb.jpg
      IMGPROXY_PRESETS: default=resizing_type:fit/gravity:sm,logo=watermark:0.5:soea:10:10:0.15,center_logo=watermark:0.3:ce:0:0:0.3

      ### compression
      IMGPROXY_STRIP_METADATA: "true"
      IMGPROXY_STRIP_COLOR_PROFILE: "true"
      IMGPROXY_FORMAT_QUALITY: jpeg=80,webp=70,avif=50
      IMGPROXY_JPEG_PROGRESSIVE: "false"
      IMGPROXY_PNG_INTERLACED: "false"
      IMGPROXY_PNG_QUANTIZATION_COLORS: 128
      IMGPROXY_PNG_QUANTIZE: "false"
      IMGPROXY_MAX_ANIMATION_FRAMES: 64
      IMGPROXY_GZIP_COMPRESSION: 0
      IMGPROXY_AVIF_SPEED: 8

      ### For URL signature
      IMGPROXY_KEY: IMGPROXY_KEY_KEY
      IMGPROXY_SALT: IMGPROXY_KEY_SALT
      IMGPROXY_SIGNATURE_SIZE: 32
    network_mode: "host"
You will also need a nginx-configuration file for imgproxy which should be saved to /etc/imgproxy/imgproxy-nginx.conf. Of course you can also store the file anywhere else but be sure to change the volume in the docker-compose.yml.
upstream upstream_imgproxy  {
    server    imgproxy:8080;
    keepalive 16;
}

server {
        server_name _;

        location / {
                proxy_pass http://upstream_imgproxy;
                proxy_http_version 1.1;
                proxy_set_header Upgrade $http_upgrade;
                proxy_set_header Connection 'upgrade';
                proxy_set_header Host $host;
        }

}
Now you can deploy the stack with
docker-compose up -d --build --remove-orphans --force-recreate
or on Portainer.
Your imgproxy instance should be now running on http://localhost:8080 which you already can use.

But I wanted to integrate it within my personal site built with Next.js so I also had to modify the nginx-configuration for my personal site. So i used the existing configuration Nginx reverse proxy with caching for Next.js with imgproxy and copied it to /etc/nginx/sites-available/default.
# Based on https://steveholgado.com/nginx-for-nextjs/

# - /var/cache/nginx sets a directory to store the cached assets
# - levels=1:2 sets up a two‑level directory hierarchy as file access speed can be reduced when too many files are in a single directory
# - keys_zone=STATIC:10m defines a shared memory zone for cache keys named “STATIC” and with a size limit of 10MB (which should be more than enough unless you have thousands of files)
# - inactive=7d is the time that items will remain cached without being accessed (7 days), after which they will be removed
# - use_temp_path=off tells NGINX to write files directly to the cache directory and avoid unnecessary copying of data to a temporary storage area first
proxy_cache_path /var/cache/nginx levels=1:2 keys_zone=STATIC:10m inactive=7d use_temp_path=off;

upstream nextjs_upstream {
  server localhost:3000;
}

upstream imgproxy_upstream {
  server localhost:8080;
}

server {
  listen 80 default_server;

  server_name _;

  server_tokens off;

  gzip on;
  gzip_proxied any;
  gzip_comp_level 4;
  gzip_types text/css application/javascript image/svg+xml;

  proxy_http_version 1.1;
  proxy_set_header Upgrade $http_upgrade;
  proxy_set_header Connection 'upgrade';
  proxy_set_header Host $host;
  proxy_cache_bypass $http_upgrade;

  # Imgproxy paths can contain multiple slashes (e.g. local:///image/file.jpg)
  merge_slashes off;

  location /img/ {

    proxy_cache STATIC;

    proxy_pass http://imgproxy_upstream/;

    # For testing cache - remove before deploying to production
    add_header X-Cache-Status $upstream_cache_status;
  }

  location /_next/static {
    proxy_cache STATIC;
    proxy_pass http://nextjs_upstream;

    # For testing cache - remove before deploying to production
    add_header X-Cache-Status $upstream_cache_status;
  }

  location /static {
    proxy_cache STATIC;

    # Ignore cache control for Next.js assets from /static, re-validate after 60m
    proxy_ignore_headers Cache-Control;
    proxy_cache_valid 60m;

    proxy_pass http://nextjs_upstream;

    # For testing cache - remove before deploying to production
    add_header X-Cache-Status $upstream_cache_status;
  }

  location / {
    proxy_pass http://nextjs_upstream;
  }
}
With this configuration all requests with the path /img/ will be redirected to the imgproxy instance and all other paths to my personal-website.
You can test the configuration with sudo nginx -t and restart nginx when the test is successfull with sudo systemctl restart nginx.
Now when you access https://mxd.codes/img/ you will be redirected to the imgroxy instance and when you access https://mxd.codes you will be redirected to my personal website.
The last missing piece is a custom image loader for the Next.js site.
Custom image loader for imgproxy
You can configure a custom loaderFile in your next.config.js like the following:
images: {
        loader: "custom",
        loaderFile: "./src/utils/loader.js",
}
This must point to a file relative to the root of your Next.js application. The file must export a default function that returns a string:
export default function imgproxyLoader({ src, width, height, quality }) {

  const path =
    `/size:${width ? width : 0}:${height ? height : 0}` +
    `/resizing_type:fill` +
    (quality ? `/quality:${quality}` : "") +
    `/sharpen:0.5` +
    `/plain/${src}` +
    `@webp`

  const host = process.env.NEXT_PUBLIC_IMGPROXY_URL

  const imgUrl = `${host}/insecure${path}`

  return imgUrl
}
Now all images you serve with next/image will use your custom loader which will be using imgproxy to transform and optimize your images for your Next.js site.
Recently I also started to deploy my personal site with docker so the whole docke-compose.yml now looks like the following, while the nginx configuration file remains the same:
version: "3"

services:
  nextjs:
    image: mxdcodes/personal-website:latest
    container_name: personal-website
    restart: always
    ports:
      - "3000:3000"
    environment:
      NODE_ENV: production
    network_mode: "host"

  imgproxy:
    restart: unless-stopped
    image: darthsim/imgproxy:${IMGPROXY_TAG:-latest}
    container_name: imgproxy_app
    security_opt:
      - no-new-privileges:true
    volumes:
      - /data/containers/imgproxy/www:/home:cached
    ports:
      - "8080:8080"
    healthcheck:
      test: ["CMD", "imgproxy", "health"]
    environment:
      ### See:
      ### https://docs.imgproxy.net/configuration/options

      ### options
      IMGPROXY_ALLOWED_SOURCES: https://mxd.codes/

      ### log and debug
      IMGPROXY_LOG_LEVEL: "warn"
      IMGPROXY_ENABLE_DEBUG_HEADERS: "false"
      IMGPROXY_DEVELOPMENT_ERRORS_MODE: "false"
      IMGPROXY_REPORT_DOWNLOADING_ERRORS: "false"

      ### timeouts
      IMGPROXY_READ_TIMEOUT: 10
      IMGPROXY_WRITE_TIMEOUT: 10
      IMGPROXY_DOWNLOAD_TIMEOUT: 10
      IMGPROXY_KEEP_ALIVE_TIMEOUT: 300
      IMGPROXY_MAX_SRC_FILE_SIZE: 33554432 # 32MB
      IMGPROXY_MAX_SRC_RESOLUTION: 48

      ### image source
      IMGPROXY_TTL: 2592000 # client-side cache time is 30 days
      IMGPROXY_USE_ETAG: "false"
      IMGPROXY_SO_REUSEPORT: "true"
      IMGPROXY_IGNORE_SSL_VERIFICATION: "false"
      IMGPROXY_LOCAL_FILESYSTEM_ROOT: /home
      IMGPROXY_SKIP_PROCESSING_FORMATS: "svg,webp,avif"

      ### presets
      IMGPROXY_AUTO_ROTATE: "true"
      #IMGPROXY_WATERMARK_PATH: /home/noimage_thumb.jpg
      IMGPROXY_PRESETS: default=resizing_type:fit/gravity:sm,logo=watermark:0.5:soea:10:10:0.15,center_logo=watermark:0.3:ce:0:0:0.3

      ### compression
      IMGPROXY_STRIP_METADATA: "true"
      IMGPROXY_STRIP_COLOR_PROFILE: "true"
      IMGPROXY_FORMAT_QUALITY: jpeg=80,webp=70,avif=50
      IMGPROXY_JPEG_PROGRESSIVE: "false"
      IMGPROXY_PNG_INTERLACED: "false"
      IMGPROXY_PNG_QUANTIZATION_COLORS: 128
      IMGPROXY_PNG_QUANTIZE: "false"
      IMGPROXY_MAX_ANIMATION_FRAMES: 64
      IMGPROXY_GZIP_COMPRESSION: 0
      IMGPROXY_AVIF_SPEED: 8

      ### For URL signature
      IMGPROXY_KEY: KEY
      IMGPROXY_SALT: SALT
      IMGPROXY_SIGNATURE_SIZE: 32
    network_mode: "host"

Since I store blog posts in a self-hosted version of strapi, I've been looking for a way to automatically generate a table of contents from Markdown for all posts in my Next.js site.
The idea is that during the build process all captions are extracted from the article content (I use getStaticProps for all articles) and then display them fixed next to the content using a separate component.
Extracting headers with regex from markdown
After some research and trial and error I decided to use regex to extract the headers from the markdown text using the hash symbol.
Since there are links in the markdown text with anchor elements and codeblocks that also contains hash symbols which will be misinterpreted as headers, these are removed first from the whole text.
  const regexReplaceCode = /(```.+?```)/gms
  const regexRemoveLinks = /\[(.*?)\]\(.*?\)/g

  const markdownWithoutLinks = markdown.replace(regexRemoveLinks, "")
  const markdownWithoutCodeBlocks =  markdownWithoutLinks.replace(regexReplaceCode, "")
Then, using the hash symbol, the headings h1 to h6 are filtered from the text and added to an array named titles.
  const regXHeader = /#{1,6}.+/g
  const titles = markdownWithoutCodeBlocks.match(regXHeader)
Next, using the headings, levels of headings, titles, and anchor links are created and added to an array toc so that the headings can later be nested with child headings and anchor links can be added. The anchor links can then be used to jump from the table of contents to a heading.
let globalID = 0
titles.map((tempTitle, i) => {
      const level = tempTitle.match(/#/g).length - 1
      const title = tempTitle.replace(/#/g, "").trim("")
      const anchor = `#${title.replace(/ /g, "-").toLowerCase()}`
      level === 1 ? (globalID += 1) : globalID

      toc.push({
        level: level,
        id: globalID,
        title: title,
        anchor: anchor,
      })
    })
The array toc is returned and I pass this for example as post.toc to the respective post, where post.toc in turn is passed as props to the ToC component.
export async function getStaticProps({ params }) {
  const content = (await data?.posts[0]?.content) || ""
  const toc = getToc(content)

  return {
    props: {
      post: {
        content,
        toc
      },
    },
  }
}
Rendering the table of contents
Each element from the toc array is now added to the table of contents component. The levels variable is used to dynamically create indentation for subordinate headings with margin and the anchor is used for links.
import styled from "styled-components"

const ToCListItem = styled.li`
  list-style-type: none;
  margin-bottom: 1rem;
  padding-left: calc(var(--space-sm) * 0.5);
  border-left: 3px solid var(--secondary-color);
  margin-left: ${(props) => (props.level > 1 ? `${props.level * 10}px` : "0")};
`

export default function TableOfContents({ toc }) {
  function TOC() {
    return (
      <ol className="table-of-contents">
        {toc.map(({ level, id, title, anchor }) => (
          <ToCListItem key={id} level={level}>
            <a href={anchor}>{title}</a>
          </ToCListItem>
        ))}
      </ol>
    )
  }

  return (
    <>
      <p>Table of contents</p>
      <divr>
        <TOC />
      </div>
    </>
  )
}
However, the anchor links do not work yet, since the corresponding section IDs still have to be added to the titles in Markdown content.
For rendering the actual post content I use react-markdown. With the help of custom renderers you can now edit all html elements in react-markdown. To add anchor links to the titles I use custom renderers for h1 to h6.
const renderers = {
  h2: { children }) => {
    const anchor = `${children[0].replace(/ /g, "-").toLowerCase()}`
    return <h2 id={anchor}>{children}</h2>
  },
  h3: ({children }) => {.
    const anchor = `${children[0].replace(/ /g, "-").toLowerCase()}`
    return <h3 id={anchor}>{children}</h2>
  },
  h4: ({children }) => {.
    const anchor = `${children[0].replace(/ /g, "-").toLowerCase()}`
    return <h4 id={anchor}>{children}</h2>
  },
  h5: ({children }) => {.
    const anchor = `${children[0].replace(/ /g, "-").toLowerCase()}`
    return <h5 id={anchor}>{children}</h2>
  },
  h6: ({children }) => {.
    const anchor = `${children[0].replace(/ /g, "-").toLowerCase()}`
    return <h6 id={anchor}>{children}</h2>
  },
Lastly, I added a little scroll effect with the following css-property scroll-behavior: smooth;

Recently I went out of storage for my homelab so I bought an used NAS (Synology DS214 play) to have some more capacities for Proxmox Backups and OpenStreetMap. I still had a 1TB hdd lying around at home, which I now use for proxmox backups.
To have some redundancy (and to learn something new) I decieded to copy the Proxmox backups to the cloud, in particular to an Azure Storage Account with AzCopy and in the following I will describe with more details how I was able to do it.
Overall this article will cover the following informations:
- Creating an Azure Storage Account
- Getting started with AzCopy
- Creating a bash-script to copy the Proxmox backups to an Azure Storage Container
Creating an Azure Storage Account
First off all you need an active Azure subscription and an storage account to be able to store your backups. In the Azure Portal you can search for the service "Storage Accounts" which you will need.

In the service "Storage Accounts" you can create a new storage account. For the storage account you will need
- an active azure subscription,
- a ressource group (create one if you don't have one it, e.g. RG-HOMELAB),
- a storage account name,
- selecting a region and
- selecting redundancy (e.g. LRS;)
- Access tier "cold" (See Advanced)


You can keep all the other settings as default. After your Storage Account has been deployed you can add a lifecycle rule from "Lifecycle Management" which will move files from the "cold" access tier to the archive storage.

For example I created a rule which moves all new files after one day to the archive storage tier.


By storing files in archive storage instead of in the regular "cold" access tier you can actually save about 82%. But keep in mind that accessing data in the Archive storage is more expensive than in the cold (or any other) storage tier.
Also you could create another rule which will for example will delete all all blobs which were created 365 days ago.

Please have a look at https://azure.microsoft.com/en-us/pricing/details/storage/blobs/ for uptodate Azure Storage pricing.
After the storage account has been configured you will need to create a Container where the actual files will be stored.
Go to "Data storage" -> "Containers" and create a Container.
 Again name it however you want.
Due to the fact that the current version of AzCopy V10 does not support Azure AD authorization in cron jobs I used an SAS token to be able to upload files to the container. You can create a SAS token in the container at "Shared access tokens".

For the Shared access token you will need to select the permissions for Add/Create/Write and select an expiry date for security reasons. Then you can generate the SAS token and URL. Copy that Blob SAS URL because you will need it for the upload script.
Getting started with AzCopy
AzCopy is a command-line utility that you can use to copy blobs or files to or from a storage account. This article helps you download AzCopy, connect to your storage account, and then transfer data. (https://learn.microsoft.com/en-us/azure/storage/common/storage-use-azcopy-v10)
To get AzCopy for Linux you have to download a tar file and decompress the tar file anywhere you like. You can then just use AzCopy because it's an executable file, so nothing has to be installed.
#Download AzCopy
cd ~
wget https://aka.ms/downloadazcopy-v10-linux

#Expand Archive
tar -xvf downloadazcopy-v10-linux

#(Optional) Remove existing AzCopy version
rm /usr/bin/azcopy

#Move AzCopy to the destination you want to store it
cp ./azcopy_linux_amd64_*/azcopy /usr/bin/

# Remove Azcopy from home
rm -r downloadazcopy-v10-linux
rm -r azcopy_linux_amd64_10.16.2/
By adding the azcopy file location as system path you can just type azcopy from any directory on your system. You can add it to your system path with:
nano ~/.profile
and then adding these lines:
export PATH=/usr/bin/azcopy:$PATH
Lastly, update your system variables:
source ~/.profile
Creating a bash-script to synchronize the Proxmox backup directory to an Azure Storage Container
The only piece missing now is the script which will upload the the Proxmox backup files to the previously created azure storage container after the backup task has finished. For copying the backups to Azure we will use azcopy copy because acopy uses less memory and incurs lower billing costs because a copy operation does not need to index the source or destination before moving files in comparison to azcopy sync. Azcopy also compares file names and last modified timestamp to only upload new or changed files to the storage container, which overall will reduce bandwidth usage and it will work perfectly with the previously created lifecycle rule.
For automatically starting the upload after the backup has finished we can use a hook script for vzdump. Therefore you need to add the following line to the end of the "/etc/vzdump.conf" file.
script: /home/youruser/scripts/upload-backups-to-azure.sh
Afterwards you can create the script which will upload the files with:
cd ~
mkdir scripts
cd scripts
nano upload-backups-to-azure.sh
Then copy paste the following content into the file and replace the content for src with the location of your dumps. Note that there is "/*" at the end of src so that only the files inside the directory will be copied. Also replace token with the Blob SAS URL.
#!/bin/bash
# Script to upload Proxmox backups to Azure Storage

src="proxy.php?url=/mnt/pve/xyz/dump/*"
token="Blob SAS URL"

dobackup(){
  echo "Uploading Proxmox backups from $src to Azure..."
  azcopy copy "$src" "$token" --overwrite=false
  echo "Finished Uploading!"
}

if [ "$1" == "job-end" ]; then
  dobackup
fi

exit 0
Close the file and make it executable for the user with:
chmod +x ~/scripts/upload-backups-to-azure.sh
Now the next time your backup task has finished the files will be automatically uploaded to your Azure storage container. Due to the hook script you can check the status of the copy process in the proxmox ui.
]]>
In this article I will explain how you can create a basic web map with Leaflet and React by using functional components without any third party packages. So i will strongly recommend to have a look at the Leaflet API reference.
What is Leaflet?
Leaflet stands out as a versatile and free JavaScript library, empowering developers to craft seamless Web GIS applications. Leveraging HTML5 and CSS3, Leaflet is compatible with all major web browsers, providing a user-friendly platform for integrating raster and vector data from diverse sources.
Exploring React and Leaflet Integration
Diving deeper into the integration of React and Leaflet components, this article explains the process of creating a web map with fundamental features:
- Basic map using OpenStreetMap.
- Visualizing data in GeoJSON format.
Getting Started
First of all you need a react app which you can create with:
npx create-react-app leaflet-react
cd leaflet-react
and you will need to install Leaflet in your project with:
npm install leaflet
After you have installed the package you can import it with import L from "leaflet" into your App.js. The import of the leaflet.css is also important because without it the map-tiles will be misplaced.
//App.js
import React, { useEffect } from "react"
import L from "leaflet"
import "leaflet/dist/leaflet.css"
const App = () => {
const mapStyles = {
width: "100%",
height: "300px",
}
const layer = L.tileLayer(
`https://{s}.tile.openstreetmap.org/{z}/{x}/{y}.png`,
{
attribution:
'© <a href="proxy.php?url=https://www.openstreetmap.org/copyright">OpenStreetMap</a> contributors',
}
)
const mapParams = {
center: [52, 4],
zoom: 4,
layers: [layer],
}
// This useEffect hook runs when the component is first mounted,
// similar to componentDidMount() lifecycle method of class-based
// components:
useEffect(() => {
const map = L.map("map", mapParams)
}, [])
return (
<div>
<div id="map" style={mapStyles} />
</div>
)
}
export default App
Since Leaflet doesn't support server-side rendering, the useEffect hook ensures the map rendering post-component mounting.
useEffect(() => {
  L.map("map", mapParams);
}, []);
The "map" parameter is the id of the html-element in which the map will be rendered. With mapParams you can pass some basic parameters as props for the Leaflet map. These parameters can just be created in a object Leaflet API: Map Creation:
const mapParams = {
  center: [0, 0],
  zoom: 0,
  layers: [layer]
};
TileLayers with OpenStreetMap Data are created with L.tileLayer(url, options) (Leaflet API: TileLayer).
const layer = L.tileLayer(`https://{s}.tile.openstreetmap.org/{z}/{x}/{y}.png`, {
attribution: '© <a href="proxy.php?url=https://www.openstreetmap.org/copyright">OpenStreetMap</a> contributors'
});
Also some basic css in js is created for the map container which makes the map fullscreen and will be passed as style props:
const mapStyles = {
  width: "100%",
  height: "100vh"
 };
In the end you just need html element in which the map will be rendered:
 return (
      <div>
        <div id="map" style={mapStyles} />
      </div>
    )
In case something didn't work out as expected you can just clone the following repositiory:
Github Repositiory: https://github.com/dietrichmax/leaflet-react-functional-component Live Demo: https://dietrichmax.github.io/leaflet-react-functional-component/
Adding GeoJSON Data
To add GeoJSON the the map first of all you will need to create a GeoJSON object:
function getGeoJson() {
  return {
    type: "GeometryCollection",
    geometries: [
      {
        type: "Polygon",
        coordinates: [
          [
            [6.000000248663241, 56.000000155530984],
            [7.000000192318055, 56.000000155530984],
            [8.000000135973096, 56.000000155530984],
            [9.000000247266257, 56.000000155530984],
            [10.000000190921071, 56.000000155530984],
            [11.000000134576112, 56.000000155530984],
            [12.000000245869273, 56.000000155530984],
            [12.000000245869273, 55.000000211876],
            [12.000000245869273, 54.00000010058284],
            [12.000000245869273, 53.00000015692797],
            [12.000000245869273, 52.00000021327298],
            [12.000000245869273, 51.00000010197982],
            [12.000000245869273, 50.00000015832478],
            [12.000000245869273, 49.00000004703179],
            [12.000000245869273, 48.000000103376806],
            [11.000000134576112, 48.000000103376806],
            [10.000000190921071, 48.000000103376806],
            [9.000000247266257, 48.000000103376806],
            [8.000000135973096, 48.000000103376806],
            [7.000000192318055, 48.000000103376806],
            [6.000000248663241, 48.000000103376806],
            [6.000000248663241, 49.00000004703179],
            [6.000000248663241, 50.00000015832478],
            [6.000000248663241, 51.00000010197982],
            [6.000000248663241, 52.00000021327298],
            [6.000000248663241, 53.00000015692797],
            [6.000000248663241, 54.00000010058284],
            [6.000000248663241, 55.000000211876],
            [6.000000248663241, 56.000000155530984],
          ],
        ],
      },
    ],
  }
}
The object is wrapped in a function which will return the GeoJSON. You could also fetch a GeoJSON object from somewhere else here.
Then you will need to add the GeoJSON object to the map with:
  useEffect(() => {
    const map = L.map("map", mapParams)
    L.geoJSON(getGeoJson()).addTo(map)
  }, [])
And thats it! You map should look now like this:
The code for this component looks like this:
import React, { useEffect } from "react"
import L from "leaflet"
import "leaflet/dist/leaflet.css"
const Map = () => {
const mapStyles = {
width: "100%",
height: "300px",
}
const layer = L.tileLayer(
`https://{s}.tile.openstreetmap.org/{z}/{x}/{y}.png`,
{
attribution:
'© <a href="proxy.php?url=https://www.openstreetmap.org/copyright">OpenStreetMap</a> contributors',
}
)
// This useEffect hook runs when the component is first mounted,
// similar to componentDidMount() lifecycle method of class-based
// components:
useEffect(() => {
const map = L.map("map", mapParams)
L.geoJSON(getGeoJson()).addTo(map)
}, [])
return (
<div>
<div id="map" style={mapStyles} />
</div>
)
}
export default Map
function getGeoJson() {
return {
type: "GeometryCollection",
geometries: [
{
type: "Polygon",
coordinates: [
[
[6.000000248663241, 56.000000155530984],
[7.000000192318055, 56.000000155530984],
[8.000000135973096, 56.000000155530984],
[9.000000247266257, 56.000000155530984],
[10.000000190921071, 56.000000155530984],
[11.000000134576112, 56.000000155530984],
[12.000000245869273, 56.000000155530984],
[12.000000245869273, 55.000000211876],
[12.000000245869273, 54.00000010058284],
[12.000000245869273, 53.00000015692797],
[12.000000245869273, 52.00000021327298],
[12.000000245869273, 51.00000010197982],
[12.000000245869273, 50.00000015832478],
[12.000000245869273, 49.00000004703179],
[12.000000245869273, 48.000000103376806],
[11.000000134576112, 48.000000103376806],
[10.000000190921071, 48.000000103376806],
[9.000000247266257, 48.000000103376806],
[8.000000135973096, 48.000000103376806],
[7.000000192318055, 48.000000103376806],
[6.000000248663241, 48.000000103376806],
[6.000000248663241, 49.00000004703179],
[6.000000248663241, 50.00000015832478],
[6.000000248663241, 51.00000010197982],
[6.000000248663241, 52.00000021327298],
[6.000000248663241, 53.00000015692797],
[6.000000248663241, 54.00000010058284],
[6.000000248663241, 55.000000211876],
[6.000000248663241, 56.000000155530984],
],
],
},
],
}
}
If you are curious how to add some more features like vector layers, some controls or markers have a look at the Leaflet API Reference and much fun playing around with your Leaflet web map created with React and functional components
]]>
When setting up my Next.js site, I opted to build a custom cookie banner instead of using prebuilt solutions. This approach allowed me to maintain a consistent design and add personal touches. The process took time as I had to implement features such as opt-in functionality and conditional rendering based on the current page.

This article outlines the steps I took to implement and design the cookie banner, which may help you build your own custom solution for a Next.js or React application.
Conditional Rendering
The first step involves declaring a visible state variable, which is initially set to false:
const CookieBanner = ({ debug }) => {
  const [visible, setVisible] = useState(false);
Using useEffect(), the component checks if the cookie consent is undefined or if debug mode is enabled. If so, the cookie banner becomes visible, and scrolling is disabled to ensure the user interacts with the banner first.
  useEffect(() => {
    // If cookie is undefined or debug is true, show the banner
    if (Cookie.get("consent") === undefined || debug) {
      document.body.style.overflow = "hidden";
      setVisible(true);
    }
  }, []);
However, when users navigate to pages like /privacy-policy or /site-notice to get some informations about the website. the banner should not obstruct content. To achieve this, the component conditionally renders the banner only if the user has not visited one of these pages:
  // Don't render if the banner should not be visible
  if (
    !visible ||
    window.location.href.includes("privacy-policy") ||
    window.location.href.includes("site-notice") ||
    window.location.href.includes("sitemap")
  ) {
    return null;
  }
Additionally, scrolling is re-enabled when users visit these pages. However, if they navigate elsewhere without accepting cookies, the banner reappears, and scrolling is disabled again:
  useEffect(() => {
    // Handle page load and visibility
    if (
      window.location.href.includes("privacy-policy") ||
      window.location.href.includes("site-notice")
    ) {
      document.body.style.overflow = "scroll";
    } else if (Cookie.get("consent") === undefined || debug) {
      document.body.style.overflow = "hidden";
    }
  }, []);
Now the user has to finally decied if she or he is fine with using (third-party) cookies. For that reason there will be some explanation in the cookie banner how the cookies are used and the user will find two buttons for 'Accept required and optional cookies' and 'Accept required cookies'.

Setting Cookies
The banner provides two options: 'Accept required and optional cookies' and 'Accept required cookies'. The first option is highlighted more prominently to encourage users to accept optional cookies.
<Button onClick={() => handleConsent(true)}>Accept required and optional cookies</Button>
Clicking an option triggers the handleConsent() function, which:
- set the consent cookie with the value true or false depending of the users choice,
- enable Analytics (optional),
- enable Adsense (optional),
- set the
visiblevariable to false and finally - allow scrolling again.
  const handleConsent = (accepted) => {
    Cookie.set("consent", accepted, { sameSite: "strict", expires: 365 });
    setVisible(false);
    document.body.style.overflow = "scroll";
    if (accepted) {
      // enableGoogleAnalytics();
      // enableGoogleAdsense();
    }
  };
Cookies are created with help of the js-cookie. If you are using Server Component you can also use the cookies function from Nextjs.
The enableGoogleAnalytics() and enableGoogleAdsense() functions are stored separately because they will also be needed in the _app.js file, whichs wrapps the whole application.
The reason behind this is, that the analytics and ad scripts are just injected into the one page where the third-party cookies have been accepted by the user. But as soon as the user navigates to any other page after accepting third-party cookies the injected scripts are not exisiting in this page.
To ensure scripts persist across page changes, the _app.js file rechecks the consent state and reinjects scripts as needed:
const MyApp = ({ Component, pageProps }) => {
  useEffect(() => {
    if (window.location.href.includes(config.domain)) {
      if (Cookie.get("consent") === "true") {
        enableGoogleAnalytics();
        enableGoogleAdsense();
      }
    }
  }, []); // Runs once on mount

  return <Component {...pageProps} />;
};
And that's it. That's how I created a cookie banner with two options which will be rendered conditionally depending on a consent cookie and depending on the current page the user is visiting. The whole CookieBanner component looks like the following:
import styled from "styled-components"
import Link from "next/link"
import media from "styled-media-query"
import Image from "next/legacy/image"
import Logo from "@/components/logo/logo"
import { Button } from "@/styles/templates/button"
import { FaLinkedin } from "@react-icons/all-files/fa/FaLinkedin"
import { FaInstagram } from "@react-icons/all-files/fa/FaInstagram"
import { FaGithub } from "@react-icons/all-files/fa/FaGithub"
import { FaBluesky } from "@react-icons/all-files/fa6/FaBluesky"
import { FaXing } from "@react-icons/all-files/fa/FaXing"
import { SiStrava } from "@react-icons/all-files/si/SiStrava"
//import { enableGoogleAnalytics } from "@/components/google-analytics/google-analytics"
//import { enableGoogleAdsense } from "@/components/google-adsense/google-adsense"
import config from "@/src/data/internal/SiteConfig"
//import { push } from "@socialgouv/matomo-next"
import { useState, useEffect } from 'react';
import Cookie from 'js-cookie';

const Background = styled.div`
  position: fixed;
  z-index: 9997;
  right: 0;
  bottom: -200px;
  top: 0;
  left: 0;
  background-color: rgba(0, 0, 0, 0.5);
`

const CookieContainer = styled.div`
  position: fixed;
  right: 0;
  bottom: 0;
  top: 0;
  left: 0;
  z-index: 9998;
  vertical-align: middle;
  white-space: nowrap;
  max-height: 100%;
  max-width: 100%;
  overflow-x: auto;
  overflow-y: auto;
  text-align: center;
  -webkit-tap-highlight-color: transparent;
  font-size: 14px;
  overflow-y: scroll;
`

const CookieInnerContainer = styled.div`
  width: var(--content-width);
  height: auto;
  max-width: none;
  border-radius: var(--border-radius);
  display: inline-block;
  z-index: 9999;
  background-color: var(--body-bg);
  white-space: normal;
  box-shadow: 0 2px 10px 0 rgb(0 0 0 / 20%);
  position: relative;
  line-height: 1.65;
  border: 1px solid var(--body-bg);
  vertical-align: middle;
  top: 20%;
  ${media.lessThan("medium")`
    width: 90%;
  `}
`

const Wrapper = styled.div`
  max-height: 100%;
  height: auto;
  max-width: none;
  text-align: left;
  border-radius: 16px;
  display: inline-block;
  white-space: normal;
`

const CookieHeader = styled.div`
  padding: var(--space);
  display: flex;
  justify-content: space-between;
`


const CookieContentBlock = styled.div`
  margin-top: var(--space);
  margin-bottom: var(--space-sm)
`

const CookieTextList = styled.ul`
  margin: 0;
  padding: 0;
  padding-inline-start: 1rem;
`

const CookieTextItem = styled.li`
  margin: var(--space-sm) 0;
`

const CookieBannerText = styled.div`
  padding: 0 var(--space);
`

const CookieHeadline = styled.h1`
  font-size: 24px;
  font-weight: 400;
  margin-bottom: var(--space);
`

const Text = styled.div`
  margin-bottom: var(--space-sm);
`

const CookieLink = styled.a`
  border-bottom: 1px solid var(--text-color);
  &:hover {
    border-bottom: none;
  }
  cursor: pointer;
  margin-right: var(--space-sm);
`

const TextLink = styled.a`
  border-bottom: 1px solid var(--text-color);
  &:hover {
    text-decoration: none;
    border-bottom: none;
  }
`

const List = styled.ol`
  list-style: none;
  padding-inline-start: 0;
  display: flex;
`

const SocialItem = styled.li`
  margin: var(--space-sm) var(--space-sm) var(--space-sm) 0;
  transition: 0.2s;
  background-color: var(--content-bg);
  padding: 8px 10px 4px 10px;
  &:hover {
    color: var(--secondary-color);
    cursor: pointer;
  }
`

const ButtonContainer = styled.div`
  margin: var(--space);
  display: flex;
  justify-content: space-between;
  ${media.lessThan("medium")`
    flex-direction: column;
    gap: var(--space-sm);
  `}
`


const CookieBanner = ({ debug }) => {
  const [visible, setVisible] = useState(false);

  useEffect(() => {
    const consent = Cookie.get("consent");
    if (!consent || debug) {
      document.body.style.overflow = "hidden";
      setVisible(true);
    } else {
      document.body.style.overflow = "scroll";
    }
  }, [debug]);

  const handleConsent = (accepted) => {
    Cookie.set("consent", accepted, { sameSite: "strict", expires: 365 });
    setVisible(false);
    document.body.style.overflow = "scroll";
  };

  if (!visible || ["privacy-policy", "site-notice", "sitemap"].some((page) => window.location.href.includes(page))) {
    return null;
  }

  const socialLinks = [
    { href: config.socials.bluesky, title: "@mmxdcodes on Bluesky", icon: <FaBluesky /> },
    { href: config.socials.github, title: "mxdietrich on GitHub", icon: <FaGithub /> },
    { href: config.socials.strava, title: "Max Dietrich on Strava", icon: <SiStrava /> },
    { href: config.socials.xing, title: "Max Dietrich on Xing", icon: <FaXing /> },
    { href: config.socials.linkedin, title: "Max Dietrich on Linkedin", icon: <FaLinkedin /> }
  ];

  return (
    <>
      <Background />
      <CookieContainer>
        <CookieInnerContainer>
          <Wrapper>
            <CookieHeader>
              <Logo />
              <Image
                src="proxy.php?url=/logos/android/android-launchericon-48-48.png"
                width="48"
                height="48"
                title="Max Dietrich"
                alt="Photo of Max Dietrich"
                className="profile u-photo"
              />
            </CookieHeader>

            <CookieBannerText>
              <CookieHeadline>Hi, welcome on mxd.codes 👋</CookieHeadline>
              <CookieContentBlock>
                <p>You can easily support me by accepting optional (third-party)
                cookies. These cookies will help with the following:</p>
                <CookieTextList>
                  <CookieTextItem>
                  <b>Collect audience interaction data and site statistics</b>
                  </CookieTextItem>
                  <CookieTextItem>
                    <b>Deliver advertisements and measure the effectiveness of
                    advertisements</b>
                  </CookieTextItem>
                  <CookieTextItem>
                  <b>Show personalized content (depending on your settings)</b>
                  </CookieTextItem>
                </CookieTextList>
              </CookieContentBlock>
              <Text>
                         <p>
            If you prefer not to share data but still want to support, visit <TextLink href="proxy.php?url=/support">mxd.codes/support</TextLink> or connect via socials:
            <List>
              {socialLinks.map(({ href, title, icon }) => (
                <SocialItem key={href} title={title}>
                  <a href={href} title={title}>{icon}</a>
                </SocialItem>
              ))}
            </List>
          </p>
                <p>
                  For more information about cookies and how they are used
                  please have a look at the Privacy Policy.
                </p>
              </Text>

              <Link href="proxy.php?url=/privacy-policy" legacyBehavior>
                <CookieLink>Privacy Policy</CookieLink>
              </Link>
              <Link href="proxy.php?url=/site-notice" legacyBehavior>
                <CookieLink>Site Notice</CookieLink>
              </Link>
            </CookieBannerText>

            <ButtonContainer>
            <Button onClick={() => handleConsent(false)} backgroundColor="var(--content-bg)" color="#70757a">
              Accept required cookies
            </Button>
            <Button onClick={() => handleConsent(true)}>Accept required and optional cookies</Button>
          </ButtonContainer>
          </Wrapper>
        </CookieInnerContainer>
      </CookieContainer>
    </>
  );
};

export default CookieBanner;
If you also want to know how the previously mentioned enableGoogleAnalytics and enableGoogleAdsense() functions work keep reading.
Google Analytics in Next.js applications
To enable Google Analytics, three functions are used:
addGoogleAnalytics()- Injects the analytics script into the document head.initializeGoogleAnalytics()- Configures and initializes Google Analytics.trackGoogleAnalytics()- Tracks page views when users navigate.
export function enableGoogleAnalytics () {
    addGoogleAnalytics().then((status) => {
      if (status) {
        initializeGoogleAnalytics()
        trackGoogleAnalytics()
      }
    })
}
First of all the Analytics script will be created and appended with the individual GA_TRACKING_ID to the head-element.
export function addGoogleAnalytics () {
    return new Promise((resolve, reject) => {
      const head = document.getElementsByTagName('head')[0]
      const scriptElement = document.createElement(`script`)
      scriptElement.type = `text/javascript`
      scriptElement.async
      scriptElement.defer
      scriptElement.src = `https://www.googletagmanager.com/gtag/js?id=${process.env.NEXT_PUBLIC_GA_TRACKING_ID}`
      scriptElement.onload = () => {
        resolve(true)
      }
      head.appendChild(scriptElement);
    });
}
After the script has been added to the site it needs to be initialized. I am also anonymizing IP adresses there and tracking a page view.
export function initializeGoogleAnalytics () {
    window.dataLayer = window.dataLayer || [];
    window.gtag = function(){window.dataLayer.push(arguments);}
    window.gtag('js', new Date())
    window.gtag('config', process.env.NEXT_PUBLIC_GA_TRACKING_ID, {
      'anonymize_ip': true,
      'allow_google_signals': true
    })
    const pagePath = location ? location.pathname + location.search + location.hash : undefined
    window.gtag(`event`, `page_view`, { page_path: pagePath })
}
To be able to also track a user changing pages we will use "next-router". It will track a page_view event everytime the route change has completed (a different page has been visited).
export function trackGoogleAnalytics () {
    Router.events.on('routeChangeComplete', (url) => {
      window.gtag(`event`, `page_view`, { page_path: url })
    });
}
So by calling the function enableGoogleAnalytics() the Google Analytics Script will be added to the page, Google Analytics will be initalized and also all page changes will be tracked with it.
You also can have a look at https://github.com/dietrichmax/google-analytics-next which shows you how you can integrate Google Analytics in Nextjs.
Google Adsense in Next.js applications
The enableGoogleAdsense() function is similiar to the enableGoogleAnalytics() function. It will also create the default Google Adsense script and place it into the head of your react application.
export function enableGoogleAdsense () {
    const head = document.getElementsByTagName('head')[0]
    const scriptElement = document.createElement(`script`)
    scriptElement.type = `text/javascript`
    scriptElement.async
    scriptElement.src = `https://pagead2.googlesyndication.com/pagead/js/adsbygoogle.js?client=${process.env.NEXT_PUBLIC_ADSENSE_ID}`
    scriptElement.crossOrigin = "anonymous"
    head.appendChild(scriptElement);
}
Afterwards you just need to place ad containers with the according client and slot id.
import styled from 'styled-components';
import { useEffect, useState } from 'react';

export function GoogleAdsenseContainer ( { client, slot }) {

  useEffect(() => {
    (window.adsbygoogle = window.adsbygoogle || []).push({});
  }, []);

  const AdLabel = styled.span`
    font-size: 12px;
  `

  return (
    <div
      style={{textAlign: 'left',overflow: 'hidden'}}
    >
    <AdLabel>Advertisment</AdLabel>
      <ins
        className="adsbygoogle"
        style={{ display: "block" }}
        data-ad-client={client}
        data-ad-slot={slot}
        data-ad-format="auto"
        data-full-width-responsive="true"
      ></ins>

    </div>
  );
}
In case I missed some important information which you would add please let me know and if you liked the article feel free to share it.
]]>
Some blogs have these related articles or posts sections where visitors can have a preview at more content after they just read a post. That's what I wanted to create for my personal website which is built with Nextjs and in this article I want to show you how you also can do it for your own Next.js site or any other react application.
Related Posts Component
The keypoint to be able to show related Posts is that you somehow have to create a relation between the posts which doesn't exist yet. All my posts have
- a title,
- a description
- a date,
- tags and
- an image.
---
title: "Post about Web-Development with React"
description: "This is a sample description for the post."
date: "2022-05-02"
tags: ["React", "Web-Development"]
image: "../image.jpg"
---
I decided to use the tags to create a relation between the posts because it's the only information which all posts can have in common and is related to the actual topic of the post. Therefore i needed data of all posts overall and data about the current posts. The data from the current post will be just passed as props to the component. All post data for my website is created in a CMS which can be accessed via GraphQL. The query to get allPosts looks like this.
export async function getAllPosts() {
  const data = await fetchStrapiAPI(
    `
    {
      posts(sort: "published_at:desc") {
        id
        published_at
        title
        slug
        content
        excerpt
        tags {
          name
        }
        coverImage {
          url
        }
      }
    }
  `
  )
  return data?.posts
}
The only relevant information here is the slug and the tags with their names.
Now the current post gets filtered out from the posts array and a variable maxPosts for the maximum number of posts which should be displayed will be created.
// filter out current post
let posts = allPosts.filter((aPost) => aPost.slug !==post.slug);

// define maxPosts to display
const maxPosts = 3
For better readability I assigned the tasks of the current posts to a variable called currentTags
// get tags of current posts
const currentTags = post.tags.map((tag) => {
  return tag.name
})
Now you have to map through posts and the tags post.tags of these posts to check if one of these tags is the same as one of the currentTags. If one tag is the same we will just enumerate a new relevance variable.
    // rate posts depending on tags
    posts.forEach((post) => {
        post.relevance = 0
        post.tags.forEach((tag) => {
            if (currentTags.includes(tag.name)) {
                post.relevance ++
            }
        })
    })
The post with the highest relevance will be the post with the most common tags and be the most related post. If you are also using categories you can of course also adjust the relevance depending on the categories and the tags. For example you could add two relevance points for categories and one relevance point for tags.
Then you can sort the array of all posts descending by relevance.
    // sort posts by relevance
    const sortedPosts = posts.sort(function(a, b) {
        return b.relevance - a.relevance;
    });
In the end you can slice them with maxPosts and finally render them.
import PostPreview from 'src/components/article/article-preview/article-preview'

export default function RecommendedPosts({ post, allPosts }) {

    // filter out current post
    let posts = allPosts.filter((aPost) => aPost.slug !==post.slug);

    // define maxPosts to display
    const maxPosts = 3

    // get tags of current posts
    const tags = post.tags.map((tag) => {
        return tag.name
    })

    // rate posts depending on tags
    posts.forEach((post) => {
        post.relevance = 0
        post.tags.forEach((tag) => {
            if (tags.includes(tag.name)) {
                post.relevance ++
            }
        })
    })

    // sort posts by relevance
    const sortedPosts = posts.sort(function(a, b) {
        return b.relevance - a.relevance;
    });

    return (
        <>
          {sortedPosts.slice(0,maxPosts).map((post, i) => (
            <PostPreview
              key={i}
              postData={post}
            />
          ))}
        </>
    )
  }

In this article I am going to explain, how you can implement Google Adsense in Next.js applications (or any other react applications). There are several approaches for implementing Adsense on a react site and I want to show you how you can add Adsense with privacy in mind.
As soon as you signed up for your site on Adsense and it has been approved, you have to place the Adsense code (or ad unit code) in your pages. This code in general exists of three parts.
Add Google Adsense script
The first part will load the actual Adsense script. This script is typically placed between the <head></head> or <body></body> section.
We will not just place it there because we just want the script to be inserted after a user has given consent to allow third-party cookies and services. So I for example outsourced it in a separate function which will be triggered by accepting cookies.
export function enableGoogleAdsense () {
    const head = document.getElementsByTagName('head')[0]
    const scriptElement = document.createElement(`script`)
    scriptElement.type = `text/javascript`
    scriptElement.async
    scriptElement.src = `https://pagead2.googlesyndication.com/pagead/js/adsbygoogle.js?client=${process.env.NEXT_PUBLIC_ADSENSE_ID}`
    scriptElement.crossOrigin = "anonymous"
    head.appendChild(scriptElement);
}
By clicking the 'Accept required and optional cookies' button on this site, this function will be triggered which will then place the adsense script into the <head></head> section.
If you want to use Auto ads you are actually already done as long as Auto Ads are enabled in your Adsense Account for your site.
Otherwise, if you want to place ad units individually you can do this now like the following.
Add ad units
I would recommend to create a separate component for ad units. This could look like the following:
import styled from 'styled-components';
import { useEffect } from 'react';

export function GoogleAdsenseContainer ( { client, slot }) {

  useEffect(() => {
    (window.adsbygoogle = window.adsbygoogle || []).push({});
  }, []);

  const AdLabel = styled.span`
    font-size: 12px;
  `

  return (
    <div
      style={{textAlign: 'left',overflow: 'hidden'}}
    >
    <AdLabel>Advertisment</AdLabel>
      <ins
        className="adsbygoogle"
        style={{ display: "block" }}
        data-ad-client={client}
        data-ad-slot={slot}
        data-ad-format="auto"
        data-full-width-responsive="true"
      ></ins>

    </div>
  );
}
In this component you will find the other to parts of the original Adsense script. So here the actual ad unit element is placed with a small ad-label. You can load this component in every page and position you like and place your individual client and slot ID. After the ad unit is placed window.adsbygoogle in the useEffect hook will fill this ad unit with the actual advertisement graphics.
With the useEffect hook ads will also be requested/refreshed when a user navigates to any other page without refreshing the page.
]]>
With Gatsby 4 bringing in Server-Side Rendering (SSR) and Deferred Static Generation (DSG) you need an alternative methode to just hosting static files. Each page using SSR or DSG will be rendererd after a user requests it so there has be a server in the background which will handle these requests and build the pages if needed.
In this post i will show you how you can deploy your Gatsby site with SSR and/or DSG on your own server with a CI/CD pipeline via PM2 and Github Webhooks.
Therefore i will be using
- Gatsby 4,Nginx,
- Nginx
- PM2 and
- Github webhooks.
Setup your server
First of all you need an server with root access. I strongly recommend to have a look at the guide "Initial Server Setup with Ubuntu 18.04" from the DigitalOcean community which will lead you through the process of:
- Logging in and set up root user access to your server with SSH
- Creating a new user
- Granting Administrative Privileges to the new user
- Setting up a basic firewall
- Giving your regular user access to the server with SSH key authentication.
After you have done that you can continue by installing all necessary dependencies on your server. Install Node.js
Again there is an guide by DigitalOcean which will help you installing Node.js using PPA.
After completing
- install Node.js, NPM and
- the "build-essential package"
you will have to change npm's default directory.
Create a .npm-global directory and set the path to this directory for node_modules:
cd ~
mkdir ~/.npm-global
npm config set prefix '~/.npm-global'
Create (or modify) a ~/.profile and add the following line:
sudo nano ~/.profile

# set PATH so global node modules install without permission issues
export PATH=~/.npm-global/bin:$PATH
Now you have to update your system variables:
source ~/.profile
Now you should be able to check your installed Node.js version with:
node -v
Install git
Check if git is already installed with:
git --version
If it isn't installed yet you can install it with
sudo apt install git
and configure Git with
git config --global user.name "Your Name"
git config --global user.email "[email protected]"
After git is installed and configured you can deploy your Gatsby site by cloning it from Github.
Deploy from Github
It is important that you are loggin in as non-root user for the following steps.
cd ~
git clone https://github.com/your-githubuser/your-gatsby-repo.git path your-gatsby-site
After you have deployed your project (optionally with environment variables) you can install all dependencies and build your Gatsby site with:
cd ./your-gatsby-site/
npm install
npm run build
Now you should have a copy of your local project/Gatsby site on your remote server.
Next you are going to setup PM2 which will be used to keep your site alive and restart it with every reboot.
Setup PM2
You can install PM2 with:
npm install pm2@latest -g
You will need to create/configure an ecosystem.config.js file which will restart the default Gatsby server.
cd ~
pm2 init
sudo nano ecosystem.config.js
Copy/paste the template and replace the content.
module.exports = {
  apps: [
    {
      name: 'gatsby-site',
      cwd: ' /home/your-name/my-gatsby-site',
      script: 'npm',
      args: 'serve',
      env: {
        //NODE_ENV: 'production',
      },
    },
    // optionally a second project
],};
With
cd ~
pm2 start ecosystem.config.js
you can start your server which will run on the Port 9000.
You can always check the status with:
pm2 status
After the server reboots this PM2 should be always automatically be restarted. For that you are going to need a small Startup script which you can also copy/paste. Generate and configure a startup script to launch PM2:
cd ~
pm2 startup systemd

[PM2] Init System found: systemd
[PM2] To setup the Startup Script, copy/paste the following command:
**sudo env PATH=$PATH:/usr/bin /usr/lib/node_modules/pm2/bin/pm2 startup systemd -u your-name --hp /home/your-name**
- Copy/paste the generated command:
**sudo env PATH=$PATH:/usr/bin /usr/lib/node_modules/pm2/bin/pm2 startup systemd -u your-name --hp /home/your-name**

[PM2] Init System found: systemd
Platform systemd

. . .


[PM2] [v] Command successfully executed.
+---------------------------------------+
[PM2] Freeze a process list on reboot via:
   $ pm2 save

[PM2] Remove init script via:
   $ pm2 unstartup systemd
- And save the new PM2 process list and environments. Then Start the service with systemctl.
pm2 save

[PM2] Saving current process list...
[PM2] Successfully saved in /home/your-name/.pm2/dump.pm2
If you reboot your server now with sudo reboot the script should be automatically restart your Gatsby site. Give it a try!
Setup Github Webhook
One thing missing now is an continuos integration and continuos delivery (CI/CD) pipeline which you will setup using Github webhooks.
Therefore you need to create a new Webhook in your repository.
The following articles provide additional information to the steps below:
You need to create a server script which will do something if it is triggered by the Github webhook.
cd ~
mkdir NodeWebHooks
cd NodeWebHooks
sudo nano webhook.js
The script is going to create a server running on Port 8100. (Your Github webhook should be of course sending the webhook to something like http://server-ip:8100.)
If it gets triggered by a webhook it will
- go into your repo
~/my-gatsby-site/, - pull the latest commits,
- install all dependencies,
- build a new version of the site and
- restart the server via the PM2 script.
const secret = "your-secret-key";
const repo = "~/my-gatsby-site/";

const http = require('http');
const crypto = require('crypto');
const exec = require('child_process').exec;

const BUILD_CMD = 'npm run build';
const PM2_CMD = 'pm2 restart gatsby-site';

http.createServer(function (req, res) {
    req.on('data', function(chunk) {
        let sig = "sha1=" + crypto.createHmac('sha1', secret).update(chunk.toString()).digest('hex');

        if (req.headers['x-hub-signature'] == sig) {
            exec('cd ' + repo + ` && git pull && npm install && ${BUILD_CMD} && ${PM2_CMD}`);
        }
    });

    res.end();
}).listen(8100);
You will need to allow communication on Port 8100 with:
sudo ufw allow 8100/tcp
sudo ufw enable
Command may disrupt existing ssh connections. Proceed with operation (y|n)? y Firewall is active and enabled on system startup
Earlier you setup PM2 to restart your Gatsby site whenever the server reboots or is started. You will now do the same for the webhook script.
Run echo $PATH and copy the output for use in the next step.
echo $PATH

/home/your-name/.npm-global/bin:/home/your-name/bin:/home/your-name/.local/bin:/usr/local/sbin:/usr/local/bin:/usr/sbin:/usr/bin:/sbin:/bin:/usr/games:/usr/local/games:/snap/bin
Create a webhook.service file:
cd ~
sudo nano /etc/systemd/system/webhook.service
In the editor, copy/paste the following script, but make sure to replace your-name in two places with your username. Earlier, you ran echo $PATH, copy this to the Environment=PATH= variable, then save and exit:
[Unit]
Description=Github webhook
After=network.target

[Service]
Environment=PATH=your_path
Type=simple
User=your-name
ExecStart=/usr/bin/nodejs /home/your-name/NodeWebHooks/webhook.js
Restart=on-failure

[Install]
WantedBy=multi-user.target
Enable and start the new service so it starts when the system boots:
sudo systemctl enable webhook.service
sudo systemctl start webhook
Check the status of the webhook:
sudo systemctl status webhook
You can test your webhook with these instructions.
The Gatsby server is now running on your-ip:9000 and you implemented a CI/CD pipeline via PM2 and Github Webhooks but you still can't access your website via a domain because you need to configure a webserver like Nginx.
Configure Nginx
I am using Cloudflare to manage DNS for my domains but you can do this with every other provider also.
Create two A Records which will point your-domain.com and www.your-domain.com to the IP-adress of your server.
After that you will need to configure Nginx.
The following instructions are based on How To Install Nginx on Ubuntu 18.04 [Quickstart].
- Update your local package index:
sudo apt update
- install Nginx:
sudo apt install nginx
and adjust the Firewall:
sudo ufw allow 'Nginx Full'
sudo ufw delete allow 'Nginx HTTP'
You should now be able to see the Nginx landing page on http://your_server_ip.
Setting up Server Blocks
Create the directory for your-domain.com, using the -p flag to create any necessary parent directories:
sudo mkdir -p /var/www/your-domain.com/html
Assign ownership of the directory:
sudo chown -R $USER:$USER /var/www/your-domain.com/html
The permissions of your web roots should be correct if you haven’t modified your umask value, but you can make sure by typing:
sudo chmod -R 755 /var/www/example.com
Make a new server block at /etc/nginx/sites-available/your-domain.com:
sudo nano /etc/nginx/sites-available/example.com
Copy/Paste the following Gatsby-nginx configuration and update the server_name sections:
server {
    # Listen HTTP
    listen 80;
    listen [::]:80;

    server_name your-domain.com www.your-domain.com;

    # Redirect HTTP to HTTPS
    return 301 https://$host$request_uri;
}

server {
    # Listen HTTP
    listen 443 ssl;
    listen [::]:443 ssl;

    server_name your-domain.com www.your-domain.com;

    # SSL config
    include snippets/self-signed.conf;
    include snippets/ssl-params.conf;

    # Proxy Config
    location / {
        proxy_pass http://localhost:9000
        proxy_http_version 1.1;
        proxy_set_header X-Forwarded-Host $host;
        proxy_set_header X-Forwarded-Server $host;
        proxy_set_header X-Real-IP $remote_addr;
        proxy_set_header X-Forwarded-For $proxy_add_x_forwarded_for;
        proxy_set_header X-Forwarded-Proto $scheme;
        proxy_set_header Host $http_host;
        proxy_set_header Upgrade $http_upgrade;
        proxy_set_header Connection "Upgrade";
        proxy_pass_request_headers on;
    }
    location ~ /.well-known {
       allow all;
    }
}
Save the file and close it when you are finished.
Enable the file by creating a link from it to the sites-enabled directory:
sudo ln -s /etc/nginx/sites-available/your-domain.com /etc/nginx/sites-enabled/
Test for syntax errors:
sudo nginx -t
and finally enable the changes:
sudo systemctl restart nginx
Nginx should now be serving your gatsby site on your domain name. That means if you have a look at http://your-domain.com you should see your Gatsby site.
In the end should deny traffic to Port 9000 because Nginx is handling the requests with:
cd ~
sudo ufw deny 9000
To install SSL, you will need to install and run Certbot by Let's Encrypt.
]]>
2021-03-02 i started tracking my current location with OwnTracks and Strapi (How i constantly track my location and display a web-map with all the locations) and created a /map which shows all the locations i have ever been to.
Recently i reached one million datasets and unfortunately that means every user had to download about 50MB of location data before the map could be rendered. So i definitely needed a much faster solution and decided to render and serve server side some tiles which will be used to display the locations. In the end i built a tile-server following Manually building a tile server (20.04 LTS) with a custom Mapnik stylesheet.
In this article i want to show you how you can build your own Mapnik stylesheet for displaying any data from PostgreSQL/PostGIS.
The Mapnik stylesheet XML is not very handy but fortunately there are some tools which will help you to create one. After some research i decided to go with TileMill which is an open source map design studio to design maps. It offers a simple UI and (more important) the possibility to export the created map-style as Mapnik stylesheet.
Actually i couldn't get the latest version running so i decided to go with TileMill v0.10.1 which offers anything you will need to create a stylesheet. At https://tilemill-project.github.io/tilemill/docs/win-install/ you can download and install TileMill.
After you have installed TileMill you can create a new project and uncheck 'default data'. Otherwise TileMill will create some kind of basemap with a default style.

Now you will have to add some data to the project. Therefore you click on the layer button and add a new layer.

Switch to the PostGIS tab and fill out ID, Connection, Unique key field, Geometry field and SRS. It's actually pretty straight forward. Keep in mind that TileMill doesn't like large datasets so i would recommend you to set some extent.
In SRS you have to specify the PROJ.4 projection string. If you don't it know a look at https://epsg.io/[epsg-code] where you will replace [epsg-code] with the epsg code of your coordinate system and scroll down to PROJ.4 where you can copy the projection string.

Afterwards save the layer and the project. You won't see your data/features yet because you need to define some style for it. You can style the map with CartoCSS which is very similiar to CSS. For example i specified my layer id as locations and i am styling points so the CartoCSS properties could look like the following.
#locations {
   [vel >= 0] { marker-width:6; marker-fill: #f45; marker-line-color: #813; marker-allow-overlap: true; }
   [vel >= 50] { marker-width:6; marker-fill: #f45; marker-line-color: #813; marker-allow-overlap: true; }
   [vel >= 100] { marker-width:6; marker-fill: #f45; marker-line-color: #813; marker-allow-overlap: true; }
}
With CartoCSS you can also dynamically style your features depending on some attribute values. For more information about CartoCSS have a look at Styling data from TileMill.
When you are happy with your style you can export if as Mapnik-XML and use if for example for your tile-server.

At /map you can see my current stylesheet in 'action'.
]]>My goal: continuously track my location using my Android phone, store the data in a PostgreSQL database, and visualize all historical locations on a web map. Over time the stack evolved significantly. The original setup relied on OwnTracks, a Node.js webhook, GeoServer, MapProxy and OpenLayers. Today I use:
- Colota: my self-developed Android tracking app
- PostgreSQL + PostGIS: for geospatial data storage
- Martin: a lightweight vector tile server backed by PostGIS
- MapLibre GL JS: for rendering the interactive web map
Set up PostgreSQL
To install PostgreSQL with PostGIS support, first add the repository and install the packages:
sudo apt update
sudo apt install gnupg2 wget vim
sudo sh -c 'echo "deb https://apt.postgresql.org/pub/repos/apt $(lsb_release -cs)-pgdg main" > /etc/apt/sources.list.d/pgdg.list'
curl -fsSL https://www.postgresql.org/media/keys/ACCC4CF8.asc | sudo gpg --dearmor -o /etc/apt/trusted.gpg.d/postgresql.gpg
sudo apt update
sudo apt-get -y install postgresql postgresql-contrib postgis
Start and enable the service:
sudo systemctl start postgresql
sudo systemctl enable postgresql
Connect and create a database and user:
sudo su postgres
psql
CREATE DATABASE locations;
CREATE USER <username> WITH ENCRYPTED PASSWORD '<password>';
GRANT ALL PRIVILEGES ON DATABASE locations TO <username>;
Create the locations table:
CREATE TABLE public.locations (
  id bigserial NOT NULL,
  created_at timestamptz NULL DEFAULT CURRENT_TIMESTAMP,
  lat float8 NULL,
  lon float8 NULL,
  acc int4 NULL,
  alt int4 NULL,
  batt int4 NULL,
  bs int4 NULL,
  cog numeric(10, 2) NULL,
  rad int4 NULL,
  t varchar(255) NULL,
  tid varchar(255) NULL,
  tst int4 NULL,
  vac int4 NULL,
  vel int4 NULL,
  p numeric(10, 2) NULL,
  conn varchar(255) NULL,
  topic varchar(255) NULL,
  inregions jsonb NULL,
  ssid varchar(255) NULL,
  bssid varchar(255) NULL
);
The key columns are lat, lon and alt. The others (velocity, battery level, connection type) are used on my /now page to show what I am currently up to.
Creating a PostGIS geometry view
Enable the PostGIS extension and create a view that exposes a proper geometry column:
\c locations
CREATE EXTENSION postgis;
CREATE OR REPLACE VIEW public.locations_geom AS
SELECT
  id,
  lat,
  lon,
  alt,
  vel,
  ST_SetSRID(ST_MakePoint(lon, lat, alt::double precision), 4326) AS geom
FROM locations;
This view is what Martin will query to generate vector tiles.
Setting up Colota
Colota is the Android app I built to replace OwnTracks. It is written in React Native (TypeScript + Kotlin) and sends location payloads in the OwnTracks HTTP format, which makes it compatible with the webhook described below. It supports tracking profiles, geofencing and multiple backends including custom endpoints.
Setting up the locations webhook
To receive location payloads from Colota and write them to PostgreSQL, I run a small Node.js HTTP server. Colota sends a JSON POST request for each location update in the OwnTracks format. The server parses the body and inserts the relevant fields into the locations table.
const http = require("http");
const { Pool } = require("pg");

const pool = new Pool({
  user: "username",
  database: "locations",
  password: "password",
  port: 5432,
  host: "localhost",
});

async function insertData(body) {
  try {
    await pool.query(
      "INSERT INTO locations (lat, lon, acc, alt, batt, bs, tst, vac, vel, conn, topic, inregions, ssid, bssid) VALUES ($1, $2, $3, $4, $5, $6, $7, $8, $9, $10, $11, $12, $13, $14)",
      [body.lat, body.lon, body.acc, body.alt, body.batt, body.bs, body.tst, body.vac, body.vel, body.conn, body.topic, body.inregions, body.ssid, body.bssid]
    );
  } catch (error) {
    console.error(error);
  }
}

const server = http.createServer((request, response) => {
  let body = [];
  if (request.method === "POST") {
    request.on("data", (chunk) => body.push(chunk)).on("end", () => {
      insertData(JSON.parse(Buffer.concat(body).toString()));
    });
  }
  response.end();
});

server.listen(9001);
The server listens on port 9001. Point Colota at http://yourserverip:9001 and location data will start flowing into the database. In production, add an API key check in the request handler to restrict access to authorized clients only.
Serving vector tiles with Martin
Martin is a Rust-based tile server that reads directly from PostGIS and serves vector tiles (MVT) with no heavy backend required.
Run Martin with Docker Compose:
services:
  martin:
    image: ghcr.io/maplibre/martin:latest
    container_name: martin
    restart: always
    ports:
      - "3000:3000"
    environment:
      DATABASE_URL: postgresql://<username>:<password>@<host>/locations
    command:
      - --listen-addresses=0.0.0.0:3000
Martin will automatically detect all tables and views with a geometry column and expose them as tile endpoints. The locations_geom view created earlier becomes available at:
https://your-server/martin/locations_geom/{z}/{x}/{y}
You can verify it is working by opening the tilejson endpoint:
https://your-server/martin/locations_geom
Rendering the map with MapLibre
MapLibre GL JS is an open-source fork of Mapbox GL JS that renders vector tiles using WebGL. I use OpenFreeMap as the basemap, which provides free hosted vector tiles based on OpenStreetMap.
The map component for my website reads the current theme (data-theme attribute on <html>) and switches between light and dark basemap styles accordingly:
import { useEffect, useRef } from "react";
import maplibregl from "maplibre-gl";
import "maplibre-gl/dist/maplibre-gl.css";

const STYLE_LIGHT = "https://tiles.openfreemap.org/styles/bright";
const STYLE_DARK = "https://tiles.openfreemap.org/styles/dark";

function getStyle(): string {
  const attr = document.documentElement.getAttribute("data-theme");
  const prefersDark = window.matchMedia("(prefers-color-scheme: dark)").matches;
  return attr === "dark" || (!attr && prefersDark) ? STYLE_DARK : STYLE_LIGHT;
}

const LiveMap = ({ coords }: { coords?: { lat: number; lon: number } }) => {
  const mapElement = useRef<HTMLDivElement>(null);

  useEffect(() => {
    if (!mapElement.current) return;

    const getPrimaryColor = () =>
      getComputedStyle(document.documentElement)
        .getPropertyValue("--primary-color")
        .trim() || "#39b5e0";

    const addLocationsLayer = (map: maplibregl.Map) => {
      map.addSource("locations", {
        type: "vector",
        tiles: ["https://your-martin-server/locations_geom/{z}/{x}/{y}"],
        minzoom: 0,
        maxzoom: 16,
      });
      map.addLayer({
        id: "locations",
        type: "circle",
        source: "locations",
        "source-layer": "locations_geom",
        paint: {
          "circle-radius": 3,
          "circle-color": getPrimaryColor(),
          "circle-opacity": 0.7,
        },
      });
    };

    const map = new maplibregl.Map({
      container: mapElement.current,
      style: getStyle(),
      center: [coords?.lon ?? -15.439457, coords?.lat ?? 28.128124],
      zoom: 10,
    });

    map.on("load", () => addLocationsLayer(map));

    // Switch style when theme changes
    const observer = new MutationObserver(() => {
      map.setStyle(getStyle());
      map.once("styledata", () => {
        if (!map.getSource("locations")) addLocationsLayer(map);
        map.setPaintProperty("locations", "circle-color", getPrimaryColor());
      });
    });

    observer.observe(document.documentElement, {
      attributes: true,
      attributeFilter: ["data-theme"],
    });

    return () => {
      observer.disconnect();
      map.remove();
    };
  }, []);

  return <div style={{ height: "100%", width: "100%" }} ref={mapElement} />;
};

export default LiveMap;
The MutationObserver watches for data-theme changes and swaps the basemap style on the fly, then re-adds the locations layer once the new style has loaded.
The result is the interactive map on /map. It is limited to Gran Canaria for privacy reasons.

With getting into the IndieWeb i started to reflect about myself and how i can actually own my data instead of giving them to so called silos.
Due to the fact I am a passionate (mountain) bike rider i was thinking about how i could use tracking/activity apps in a way to get my data back, because obviously when i am going for a ride with my bike and i am tracking the route with strava and/or komoot the data is then saved by them. Considering that every route is tracked on a Garmin device anyway and then synchronised to the apps i decided to have a look at the Garmin Connect/Activity API.
Unfortunately the official Garmin Activity API is only available for approved business developer.
But after some searching i found the npm-package garmin-connect which allows you to connect to Garmin Connect for sending and receiving activity data.
Fetching and storing activities from Garmin Connect with Strapi
You can install the package with
npm install garmin-connect
or
yarn add garmin-connect
and use it like
const { GarminConnect } = require('garmin-connect');
// Create a new Garmin Connect Client
const GCClient = new GarminConnect();
// Uses credentials from garmin.config.json or uses supplied params
await GCClient.login('[email protected]', 'MySecretPassword');
const userInfo = await GCClient.getActivities());
I stored the email and the password for the login in environment variables and used them with
const { GarminConnect } = require('garmin-connect');
const GCClient = new GarminConnect();
await GCClient.login(process.env.GARMIN_EMAIL ,process.env.GARMIN_PWD);
const userInfo = await GCClient.getActivities());
Afterwards experimented a bit with the Garmin Connect and found out there are some very low limits. Approximately after ~50 requests in one minute couldn't get anymore any data and had to wait for some (maybe one?; i am not sure) hours until the request was successful again.
In general you can probably do way more with Garmin Connect as you will need, like for example:
- Get user info
- Get social user info
- Get heart rate
- Set body weight
- Get list of workouts
- Add new workouts
- Add workouts to you calendar
- Remove previously added workouts
- Get list of activities
- Get details about one specific activity
- Get the step count
I used only GCClient.getActivities(); to get all activities and and GCClient.getActivity({ activityId: id }); to get the details of the activity (like spatial data representing the route, start-point and end-point).
To be able to store the data in Strapi i created a new content type collection activities with the following fields/attributes:

Afterwards new entrys for activities can be created.
Strapi has a documention which explains how to fetch external data and create entries with it: Fetching external data.
To get the data from Garmin Connect into Strapi i created a function getGarminConnectActivities.js for Strapi (https://gist.github.com/dietrichmax/306b36abd5a9d1ac0c938adcd15f2f69)
The function will take care of:
- getting existing activities in Strapi,
- get recent activites from Garmin Connect,
- checking if an activity already exists in Strapi,
- creating the activity in Strapi if it doesn't exist yet and also get the details for it.
and basically looks like this:
module.exports = async () => {
  await GCClient.login(process.env.GARMIN_USERNAME, process.env.GARMIN_PWD)
  const activities = await GCClient.getActivities()
  const exisitingActivities = await getExistingActivities()
  activities ? activities.map((activity) => {
    const isExisting = exisitingActivities.includes(activity.activityId)
    isExisting ? console.log(activity.activityId + " already exists") : createEntry(activity)
  })
  : console.log("no activities found")
}
After all activities from Garmin are fetched, i am mapping through them to
- check if they already exist in my cms
- and create them if needed
The exisiting activities in my CMS are fetched with
const getExistingActivities = async () => {
  const existingActivityIds = []
  const activities = await axios.get(`https://strapi.url/activities`)

  activities.data.map((activity) => {
    existingActivityIds.push(activity.activityID)
  })
  return existingActivityIds
}
and the activityIds (originally from Garmin Connect) are returned to be able to check if an entry already exists. If the entry doesn't exist, details for the missing activity are fetched and a new entry is created with:
const createEntry = async (activity) => {
  const details = await GCClient.getActivity({ activityId: activity.activityId });
  await strapi.query('activity').create({
    activityID: activity.activityId,
    activityName: activity.activityName,
    beginTimestamp: activity.beginTimestamp,
    activityType: activity.activityType,
    distance: activity.distance,
    duration: activity.duration,
    elapsedDuration:  activity.elapsedDuration,
    movingDuration: activity.movingDuration,
    elevationGain: activity.elevationGain,
    elevationLoss: activity.elevationLoss,
    minElevation: activity.minElevation,
    maxElevation: activity.minElevation,
    sportTypeId: activity.sportTypeId,
    averageSpeed: activity.averageSpeed * 3.6 //(m/s -> km/h),
    maxSpeed: activity.maxSpeed * 3.6 //(m/s -> km/h),,
    startLatitude: activity.startLatitude,
    startLongitude: activity.startLongitude,
    endLatitude: activity.endLatitude,
    endLongitude: activity.endLongitude,
    details: details
  })
}
You can save way more but i tried to cut it down to the ones i really need or eventually will need.
Only thing missing is some automatic triggering. For this you can use cron jobs in Strapi (/config/functions/cron.js).
module.exports = {
// Add your own logic here (e.g. send a queue of email, create a database backup, etc.).

    '0 0 18 * * *': () => {
      strapi.config.functions.getGarminConnectActivities();
    },
};
I decied to trigger the function everyday at 6 pm so i can have a look at my activites in the evening. 😎
Thats the fun from the 'backend part'.
Next step is to visualize the data in NextJS.
Visualizing the data with NextJS
I am really liking the embeddable tours of komoot optic-wise, so i decided to create a similiar looking option for the preview of my activities in the posts-feed and activites-feed.
So the preview should consist of
- an title of the activitie (+datetime),
- an symbol displaying the activity type (cycling, running, etc.)
- some basic metrics like distance, duration and average speed,
- a map displaying the line of the route with osm-data and and aerial-view,
- and optionally a graph displaying the elevation along the track (still in work).
The component looks like this at the moment:

Showing some Metrics
In the activityType object you can find typeId which correlates to the type of the activity, e.g. cycling, running etc.
I created a small function which will return a icon from react-icons visualizing the activity type.
import { FaRunning, FaBiking } from 'react-icons/fa';

const getTypeIcon = activity => {
    if (activity.activityType.typeId == 5) {
        return <FaBiking/>
    } else if (activity.activityType.typeId == 15) {
      return <FaRunning/>
 }

getTypeIcon(activity)
Due to the fact the duration is given in seconds and i wanted it to display like 1h 10m 12s there is also a need for a workaround which looks like the following:
const secondsToHms = (s) => {
    const hours = (((s - s % 3600) / 3600) % 60)
    const minutes = (((s - s % 60) / 60) % 60)
    const seconds = (s % 60)
    return (`${hours}h ${minutes}min ${seconds}s`)
 }
secondsToHms(activity.duration)
Displaying a Map with "react-leaflet"
Then i created a small map with react-leaflet displaying
- the track as polyline,
- the start point and
- the end point.
Therefore i created a new map-component:
import React, { useEffect, useState } from "react"
import { Marker, MapContainer, TileLayer, LayersControl, Polyline } from "react-leaflet";
const Map = (data) => {
const geo = data.data
const style= {
color: '#11a9ed',
weight: "5"
}
const bounds = [[geo.maxLat, geo.maxLon], [geo.minLat, geo.minLon]]
return (
<MapContainer
style={{ height: "500px", width: "100%" }}
bounds={bounds}
scrollWheelZoom={false}
>
<LayersControl position="topright">
<LayersControl.BaseLayer checked name="OpenStreetMap.Mapnik">
<TileLayer
url='https://{s}.basemaps.cartocdn.com/rastertiles/voyager/{z}/{x}/{y}{r}.png'
attribution ='© <a href="proxy.php?url=https://www.openstreetmap.org/copyright">OpenStreetMap</a> contributors © <a href="proxy.php?url=https://carto.com/attributions">CARTO</a>'
/>
</LayersControl.BaseLayer>
<LayersControl.BaseLayer name="Esri World Imagery">
<TileLayer
attribution='Tiles © Esri — Source: Esri, i-cubed, USDA, USGS, AEX, GeoEye, Getmapping, Aerogrid, IGN, IGP, UPR-EGP'
url="https://server.arcgisonline.com/ArcGIS/rest/services/World_Imagery/MapServer/tile/{z}/{y}/{x}"
/>
</LayersControl.BaseLayer>
<Marker id="start" position={geo.startPoint}/>
<Polyline pathOptions={style} positions={geo.polyline} />
<Marker id="end" position={geo.endPoint}/>
</LayersControl>
</MapContainer>
);
};
export default Map;
Luckily the data from the Garmin Connect has already exactly the structure we need to create the map, which are the coordinates for the polyline and the two points.
The coordinates can be found in geoPolylineDTO in the activitydetails

With maxLat, maxLon, minLat and minLon i created the bounds which will set the default view for the map when passed to the MapContainer.
const bounds = [[geo.maxLat, geo.maxLon], [geo.minLat, geo.minLon]]

<MapContainer
      style={{ height: "200px", width: "100%" }}
      bounds={bounds}
      scrollWheelZoom={false}
 >
.
.
Then i added the LayerControl to be able to toggle between the two Tilelayers
- OSM (Carto) and
- Aerial Image (Esri)
After that i just created two markers and a polyline with the exisiting objects startPoint, endPoint and polyline.
.
.
        <Marker id="start" position={geo.startPoint}/>
        <Polyline pathOptions={style} positions={geo.polyline} />
        <Marker id="end" position={geo.endPoint}/>
.
.
You can find several other tilelayers in leaflet-providers-preview.
For an example of the preview head over to /activities. You can find the code for the activity-preview in my github-repositiory.
For the actual post of the activity i made the map a bit larger and added some more metrics for now.
(osm)

(Aerial view)


Integrating syntax highlighting into a Next.js project has evolved with the latest Next.js versions (12–14) and React Server Components. This guide shows a modern, performant approach to syntax highlighting using Prism.js, including lazy highlighting, a copy-to-clipboard button, and MDX integration.
1. Install Dependencies
Install Prism.js and a tree-shakable icon library for copy buttons:
npm install prismjs
npm install https://github.com/react-icons/react-icons/releases/download/v5.4.0/react-icons-all-files-5.4.0.tgz
The @react-icons/all-files package allows importing only the icons you need, keeping bundle size small.
2. Import Prism Styles
In your app/layout.tsx (or _app.tsx if using the Pages Router), import your Prism CSS:
import "@/styles/prism.css";
Download a custom Prism CSS theme here: Prism Download. Save it under styles/prism.css.
3. Create a Syntax Highlighter Component
Highlight code only when visible using IntersectionObserver:
// SyntaxHighlighter.tsx
"use client";

import Prism from "prismjs";
import { useEffect, useRef } from "react";

// Import only needed Prism languages
import "prismjs/components/prism-bash";
import "prismjs/components/prism-jsx";
import "prismjs/components/prism-tsx";
import "prismjs/components/prism-python";
import "prismjs/components/prism-sql";
import "prismjs/components/prism-yaml";
import "prismjs/components/prism-nginx";
import "prismjs/components/prism-git";
import "prismjs/components/prism-json";
import "prismjs/components/prism-docker";
import "prismjs/components/prism-powershell";

interface SyntaxHighlighterProps {
  language?: string;
  code?: string;
}

const SyntaxHighlighter = ({ language, code }: SyntaxHighlighterProps) => {
  const ref = useRef<HTMLDivElement>(null);

  useEffect(() => {
    const observer = new IntersectionObserver(
      (entries) => {
        entries.forEach((entry) => {
          if (entry.isIntersecting) {
            Prism.highlightAllUnder(entry.target);
          }
        });
      },
      { rootMargin: "100%" }
    );

    if (ref.current) observer.observe(ref.current);
    return () => {
      if (ref.current) observer.unobserve(ref.current);
    };
  }, []);

  return (
    <div ref={ref}>
      <pre className={`language-${language}`} tabIndex={0}>
        <code className={`language-${language}`}>{code?.trim() ?? ""}</code>
      </pre>
    </div>
  );
};

export default SyntaxHighlighter;
4. Add a Copy-to-Clipboard Button
Provide instant copy feedback with icons:
// CopyCodeButton.tsx
"use client";

import { FaCopy } from "@react-icons/all-files/fa/FaCopy";
import { FaCheck } from "@react-icons/all-files/fa/FaCheck";
import { useState } from "react";
import styles from "./CopyCodeButton.module.css";

export default function CopyCodeButton({ children }) {
  const [copied, setCopied] = useState(false);

  const handleClick = () => {
    navigator.clipboard.writeText(children.props.children);
    setCopied(true);
    setTimeout(() => setCopied(false), 2000);
  };

  return (
    <div className={styles.copyButton} onClick={handleClick} title="Copy code">
      <div className={styles.copyWrapper}>
        {copied ? (
          <>
            <FaCheck className={`${styles.icon} ${styles.iconCopied}`} /> Copied!
          </>
        ) : (
          <>
            <FaCopy className={`${styles.icon} ${styles.iconCopy}`} /> Copy code
          </>
        )}
      </div>
    </div>
  );
}
5. Integrate with MDX / Markdown
Override the code component in your MDX renderer:
// renderers.tsx
import SyntaxHighlighter from "./SyntaxHighlighter";
import CopyCodeButton from "./CopyCodeButton";
import styles from "./Markdown.module.css";

export const markdownComponents = {
  code: ({ inline, className, children, ...props }) => {
    const match = /language-(\w+)/.exec(className || "");
    if (!inline && match) {
      return (
        <div className={styles.codeBlock}>
          <SyntaxHighlighter language={match[1]} code={children} />
          <CopyCodeButton>{children}</CopyCodeButton>
        </div>
      );
    }
    return (
      <code className={styles.defaultCode} {...props}>
        {children}
      </code>
    );
  },
};
6. Wrap MDX Content in a Client Component
Here’s how to pass your custom renderers to MDX using next-mdx-remote:
// mdxWrapper.tsx
"use client";

import { MDXRemote, MDXRemoteProps } from "next-mdx-remote";
import { markdownComponents as renderers } from "../renderers/renderers";
import styles from "./mdxWrapper.module.css";

const MDXWrapper: React.FC<{ content: MDXRemoteProps }> = ({ content }) => {
  return (
    <div className={`${styles.contentWrapper} markdown`}>
      <MDXRemote {...content} components={renderers} />
    </div>
  );
};

export default MDXWrapper;
This ensures:
- Syntax highlighting is client-side only (avoiding SSR hydration issues).
- Custom MDX renderers (e.g.,
SyntaxHighlighter,CopyCodeButton) are applied. - Styles and copy functionality work seamlessly for all code blocks.
7. Benefits
- Lazy highlighting improves performance.
- Only required Prism languages are loaded.
- Users can copy code with a single click.
- Fully compatible with Next.js App Router + MDX.
- Can still switch to pre-rendered highlighting (
rehype-prism-plusorrehype-pretty-code) for build-time performance if desired.
This approach is fully Next.js 14 / React 18 ready, client-friendly, and keeps bundle size minimal.
]]>
This article shows you how can host your Next.js site on a (virtual private) server with Nginx and a CI/CD pipeline via PM2 and Github Webhooks.
Setup your server
First of all you need an server with root access. I strongly recommend to have a look at the guide "Initial Server Setup with Ubuntu 18.04" from the DigitalOcean community which will lead you through the process of:
- Logging in and set up root user access to your server with SSH
- Creating a new user
- Granting Administrative Privileges to the new user
- Setting up a basic firewall
- Giving your regular user access to the server with SSH key authentication.
After you have done that you can continue by installing all necessary dependencies on your server.
Install Node.js
Again there is an guide by DigitalOcean which will help you installing Node.js using PPA.
After completing
- install Node.js, NPM and
- the "build-essential package"
you will have to change npm's default directory.
- Create a
.npm-globaldirectory and set the path to this directory fornode_modules:
cd ~
mkdir ~/.npm-global
npm config set prefix '~/.npm-global'
- Create (or modify) a
~/.profileand add the following line:
sudo nano ~/.profile
# set PATH so global node modules install without permission issues
export PATH=~/.npm-global/bin:$PATH
Now you have to update your system variables:
source ~/.profile
Now you should be able to check your installed Node.js version with:
node -v
Install git
Check if git is already installed with:
git --version
If it isn't installed yet you can install it with
sudo apt install git
and configure Git with
git config --global user.name "Your Name"
git config --global user.email "[email protected]"
After git is installed and configured you can deploy your project by cloning it from Github.
Deploy from Github
It is important that you are loggin in as non-root user for the following steps.
cd ~
git clone https://github.com/your-name/your-project-repo.git path
Create a .env on the server if you are using one locally and copy/paste your content.
After you have deployed your project (optionally with environment variables) you can install all dependencies and build your Next.js site with:
cd ./my-project/
npm install
NODE_ENV=production npm run build
Now you should have a copy of your local project/Next.js site on your remote server.
Next you are going to setup PM2 which will be used to keep your site alive and restart it after every reboot.
Setup PM2
You can install PM2 with:
npm install pm2@latest -g
You will need to create/configure an ecosystem.config.js file which will restart the default Next.js server.
cd ~
pm2 init
sudo nano ecosystem.config.js
Copy/paste the template and replace the content.
module.exports = {
  apps: [
    {
      name: 'next-site',
      cwd: ' /home/your-name/my-nextjs-project',
      script: 'npm',
      args: 'start',
      env: {
        NEXT_PUBLIC_...: 'NEXT_PUBLIC_...',
      },
    },
    // optionally a second project
],};
With
cd ~
pm2 start ecosystem.config.js
you can start your server which will run on the Port 1337.
You can always check the status with:
pm2 status next-site
After the server reboots this PM2 should be always automatically be restarted. For that you are going to need a small Startup script which you can also copy/paste.
- Generate and configure a startup script to launch PM2:
cd ~
pm2 startup systemd

[PM2] Init System found: systemd
[PM2] To setup the Startup Script, copy/paste the following command:
**sudo env PATH=$PATH:/usr/bin /usr/lib/node_modules/pm2/bin/pm2 startup systemd -u your-name --hp /home/your-name**
- Copy/paste the generated command:
**sudo env PATH=$PATH:/usr/bin /usr/lib/node_modules/pm2/bin/pm2 startup systemd -u your-name --hp /home/your-name**

[PM2] Init System found: systemd
Platform systemd

. . .


[PM2] [v] Command successfully executed.
+---------------------------------------+
[PM2] Freeze a process list on reboot via:
   $ pm2 save

[PM2] Remove init script via:
   $ pm2 unstartup systemd
- And save the new PM2 process list and environments. Then Start the service with
systemctl.
pm2 save

[PM2] Saving current process list...
[PM2] Successfully saved in /home/your-name/.pm2/dump.pm2
If you reboot your server now with sudo reboot the script should be automatically restart your Next.js site. Give it a try!
Setup Github Webhook
One thing missing now is an continuos integration and continuos delivery (CI/CD) pipeline which you will setup using Github webhooks.
Therefore you need to create a new Webhook in your repository.
The following articles provide additional information to the steps below:
You need to create a server script which will do something if it is triggered by the Github webhook.
cd ~
mkdir NodeWebHooks
cd NodeWebHooks
sudo nano webhook.js
The script is going to create a server running on Port 8100.
(Your Github webhook should be of course sending the webhook to something like http://server-ip:8100.)
If it gets triggered by a webhook it will
- go into your repo
~/my-nextjs-project/, - pull the latest commits,
- install all dependencies,
- build a new version of the site and
- restart the server via the PM2 script.
const secret = "your-secret-key";
const repo = "~/my-nextjs-project/";

const http = require('http');
const crypto = require('crypto');
const exec = require('child_process').exec;

const BUILD_CMD = 'npm install && NODE_ENV=production npm run build';
const PM2_CMD = 'pm2 restart next-site';

http.createServer(function (req, res) {
    req.on('data', function(chunk) {
        let sig = "sha1=" + crypto.createHmac('sha1', secret).update(chunk.toString()).digest('hex');

        if (req.headers['x-hub-signature'] == sig) {
            exec('cd ' + repo + ` && git pull && npm install && ${BUILD_CMD} && ${PM2_CMD}`);
        }
    });

    res.end();
}).listen(8100);
You will need to allow communication on Port 8100 with:
sudo ufw allow 8100/tcp
sudo ufw enable

Command may disrupt existing ssh connections. Proceed with operation (y|n)? y
Firewall is active and enabled on system startup
Earlier you setup PM2 to restart the services (your Next.js site) whenever the server reboots or is started. You will now do the same for the webhook script.
- Run echo $PATH and copy the output for use in the next step.
echo $PATH

/home/your-name/.npm-global/bin:/home/your-name/bin:/home/your-name/.local/bin:/usr/local/sbin:/usr/local/bin:/usr/sbin:/usr/bin:/sbin:/bin:/usr/games:/usr/local/games:/snap/bin
- Create a webhook.service file:
cd ~
sudo nano /etc/systemd/system/webhook.service
- In the editor, copy/paste the following script, but make sure to replace your-name in two places with your username. Earlier, you ran echo $PATH, copy this to the Environment=PATH= variable, then save and exit:
[Unit]
Description=Github webhook
After=network.target

[Service]
Environment=PATH=your_path
Type=simple
User=your-name
ExecStart=/usr/bin/nodejs /home/your-name/NodeWebHooks/webhook.js
Restart=on-failure

[Install]
WantedBy=multi-user.target
- Enable and start the new service so it starts when the system boots:
sudo systemctl enable webhook.service
sudo systemctl start webhook
- Check the status of the webhook:
sudo systemctl status webhook
You can test your webhook with these instructions.
The Next.js server is now running on your-ip:3000 and you implemented a CI/CD pipeline via PM2 and Github Webhooks but you still can't access your website via a domain because you need to configure a webserver like Nginx.
Configure Nginx
I am using Cloudflare to manage DNS for my domains but you can do this with every other provider also.
- Create two
ARecords which will pointyour-domain.comandwww.your-domain.comto the IP-adress of your server.
After that you will need to configure Nginx.
The following instructions are based on How To Install Nginx on Ubuntu 18.04 [Quickstart].
- Update your local package index:
sudo apt update
- install Nginx:
sudo apt install nginx
- and adjust the Firewall:
sudo ufw allow 'Nginx Full'
sudo ufw delete allow 'Nginx HTTP'
You should now be able to see the Nginx landing page on http://your_server_ip.
Setting up Server Blocks
- Create the directory for
your-domain.com, using the -p flag to create any necessary parent directories:
sudo mkdir -p /var/www/your-domain.com/html
- Assign ownership of the directory:
sudo chown -R $USER:$USER /var/www/your-domain.com/html
- The permissions of your web roots should be correct if you haven’t modified your
umaskvalue, but you can make sure by typing:
sudo chmod -R 755 /var/www/example.com
- Make a new server block at
/etc/nginx/sites-available/your-domain.com:
sudo nano /etc/nginx/sites-available/example.com
- Copy/Paste the following nextjs-nginx configuration and update the server_name sections:
server {
    # Listen HTTP
    listen 80;
    listen [::]:80;

    server_name your-domain.com www.your-domain.com;

    # Redirect HTTP to HTTPS
    return 301 https://$host$request_uri;
}

server {
    # Listen HTTP
    listen 443 ssl;
    listen [::]:443 ssl;

    server_name your-domain.com www.your-domain.com;

    # SSL config
    include snippets/self-signed.conf;
    include snippets/ssl-params.conf;

    # Proxy Config
    location / {
        proxy_pass http://localhost:3000
        proxy_http_version 1.1;
        proxy_set_header X-Forwarded-Host $host;
        proxy_set_header X-Forwarded-Server $host;
        proxy_set_header X-Real-IP $remote_addr;
        proxy_set_header X-Forwarded-For $proxy_add_x_forwarded_for;
        proxy_set_header X-Forwarded-Proto $scheme;
        proxy_set_header Host $http_host;
        proxy_set_header Upgrade $http_upgrade;
        proxy_set_header Connection "Upgrade";
        proxy_pass_request_headers on;
    }
    location ~ /.well-known {
       allow all;
    }
}
Save the file and close it when you are finished.
- Enable the file by creating a link from it to the sites-enabled directory:
sudo ln -s /etc/nginx/sites-available/your-domain.com /etc/nginx/sites-enabled/
- Test for syntax errors:
sudo nginx -t
- and finally enable the changes:
sudo systemctl restart nginx
Nginx should now be serving content on your domain name. That means if you have a look at http://your-domain.com you should see your Next.js site.
In the end should deny traffic to Port 3000 with:
cd ~
sudo ufw deny 3000
- To install SSL, you will need to install and run Certbot by Let's Encrypt .
This guide is also using parts of Strapi Deployment on DigitalOcean which helped me a lot setting up Strapi and Next.js on a server in a proper way.
]]>
With Google Cloud (Build) you can automate your whole workflow from building your Gatsby site up to deploying your site to Firebase hosting.
What will you need?
- Firebase Hosting
- Cloud Build
- Cloud Scheduler (optional)
Firebase Hosting
To set up Firebase you will need an Google Cloud Account which has billing enabled and at least one project. You can add the Firebase SDK with:
npm install --save firebase
and configure it with
firebase init
In the process you can setup a new project which will create a new .firebaserc file if it doesn't exist yet and enable Hosting.

As public directory you have to set your public folder. After you have set your public folder you can reject all oncoming messages.
You can also have a look at the Google Firebase Docs for setting up Firebase.
In the end it will also create a firebase.json where you can copy/paste the following to optimize your hosting for a Gatsby site.
{
  "hosting": {
    "public": "public",
    "ignore": [
      "firebase.json",
      "**/.*",
      "**/node_modules/**"],
    "headers": [
      {
        "source": "**/*",
        "headers": [
          {
            "key": "cache-control",
            "value": "cache-control: public, max-age=0, must-revalidate"
          }
        ]
      },
      {
        "source": "static/**",
        "headers": [
          {
            "key": "cache-control",
            "value": "public, max-age=31536000, immutable"
          }
        ]
      },
      {
        "source": "**/*.@(css|js)",
        "headers": [
          {
            "key": "cache-control",
            "value": "public, max-age=31536000, immutable"
          }
        ]
      },
      {
        "source": "sw.js",
        "headers": [
          {
            "key": "cache-control",
            "value": "cache-control: public, max-age=0, must-revalidate"
          }
        ]
      },
      {
        "source": "page-data/**",
        "headers": [
          {
            "key": "cache-control",
            "value": "cache-control: public, max-age=0, must-revalidate"
          }
        ]
      }
    ],
  }
}
When you have build your Gatsy site and public folder is present you can upload it to your Firebase Hosting with:
firebase deploy
If you want to use your custom domain (for example mxd.codes) you have to go to Hosting in the Firebase console where you will find DNS-records to point your domain to your Firebase Hosting. You can also create a second domain (for example www.gis-netzwerk.com) to redirect automatically to your root domain.
In your project settings you can find your Firebase configurations which look like:
const firebaseConfig = {
  apiKey: "apiKey",
  authDomain: "{.firebaseapp.com",
  databaseURL: "https:// projectId.firebaseio.com",
  projectId: " projectId",
  storageBucket: " projectId.appspot.com",
  messagingSenderId: "1",
  appId: "2",
  measurementId: "G-123"
};
You probably want to save these as environment variables.
Cloud Build
To create a CI-/CD-Pipeline you have to activate Cloud Build for your account. The console itself is quite clear in comparison to AWS CodeBuild. You will see Dashboard which is displaying some basic informations, the history of your Cloud Builds, Triggers and Options.
You just will have to create a new trigger which will trigger a new build everytime new content is pushed to your linked GitHub repository..
First of all you have to connect your repository. After that you can create the trigger.

Important options are:
- Event: Push to branch
- Branch: ^master$ (or whatever branch you want to build)
- Cloud Build Configuration file: cloudbuild.yaml
After that you can create all environment variables as Substitution variables. You will notice that all variables have to start with an underscore. Because of that we will need a small workaround in the cloudbuild.yaml configuration file.
For now you can just create your substitions variables and add the underscore to your default variable names.
To be able to deploy via firebase you will need to authorize Firebase with a '$_TOKEN'. You can retrive this token on your local machine with:
firebase login:ci
A new page will be opened in your prefered browser where you will have to login with your Google account to get the token. Once you have the token you can also add it as substition variable.
_TOKEN : {TOKEN VALUE}
If you have created all substitution variables you can check again if they are inserted correct and create the new trigger.
Cloudbuild.yaml
Cloud build needs the cloudbuild.yaml to know what it should do. If you have inserted the path like above mentioned you will need a cloudbuild.yaml in your root directory.
You can copy the following into it:
steps:
# Install dependencies
  - name: node:10.16.0
    id: Installing dependencies...
    entrypoint: npm
    args: ["install"]
    waitFor: ["-"] # Begin immediately

# Install Firebase
  - name: node:10.16.0
    id: Installing Firebase...
    entrypoint: npm
    args: ["install", "firebase-tools"]
    waitFor:
      - Install dependencies...

# Create file with env-variables
  - name: node:10.16.0
    id: Creating Envirnonment variables...
    entrypoint: npm
    args: ["run", "create-env"]
    env:
    - "CLIENT_EMAIL=${_CLIENT_EMAIL}"
    - "PRIVATE_KEY=${_PRIVATE_KEY}"
    - "MAIL_CHIMP=${_MAIL_CHIMP}"
    - "GA_ID=${_GA_ID}"
    - "GA_VIEW_ID=${_GA_VIEW_ID}"
    - "IG_TOKEN=${_IG_TOKEN}"
    - "FIREBASE_API_KEY=${_FIREBASE_API_KEY}"
    - "FIREBASE_APP_ID=${_FIREBASE_APP_ID}"
    - "FIREBASE_AUTH_DOMAIN=${_FIREBASE_AUTH_DOMAIN}"
    - "FIREBASE_DB_URL=${_FIREBASE_DB_URL}"
    - "FIREBASE_MEASUREMENT_ID=${_FIREBASE_MEASUREMENT_ID}"
    - "FIREBASE_MESSAGE_SENDER_ID=${_FIREBASE_MESSAGE_SENDER_ID}"
    - "FIREBASE_PROJECT_ID=${_FIREBASE_PROJECT_ID}"
    - "FIREBASE_STORAGE_BUCKET=${_FIREBASE_STORAGE_BUCKET}"
    - "GATSBY_EXPERIMENTAL_PAGE_BUILD_ON_DATA_CHANGES=true"
    waitFor: ["-"] # Begin immediately

# Gatsby build
  - name: node:10.16.0
    id: Building Gatsby site...
    entrypoint: npm
    args: ["run", "build"]
    waitFor:
      - Installing dependencies...
      - Creating Envirnonment variables...

# Deploy
  - name: node:10.16.0
    id: Deploying to Firebase...
    entrypoint: "./node_modules/.bin/firebase"
    args: ["deploy", "--project", "$PROJECT_ID", "--token", "$_TOKEN"]
    waitFor:
      - Installing Firebase...
      - Building Gatsby site...

timeout: 30m0s
The cloudbuild.yaml is basically divided into six parts which will
- Install dependencies,
- Install Firebase,
- Create file with env-variables,
- Build the Gatsby site and
- Deploy it to Firebase
As you can see you will create a file with the environment variables which will map the substitutions variables with your "default" variables. Everything else should be pretty self-explanatory.
Cloud Build will timeout the build by default after 10 minutes. So if your build is gonna take longer you will have to set up a custom timeout like in the cloudbuild.yaml above. You can also set a timeout for each step.
Another import point is that you will have to add the Plugin for Google Analytics Reporting Api as dynamic plugin like for example the following because otherwise you will get errors during your build.
if (
  process.env.CLIENT_EMAIL &&
  process.env.PRIVATE_KEY &&
  process.env.GA_VIEW_ID
) {
  const startDate = new Date()
  startDate.setMonth(startDate.getMonth() - 3)
  dynamicPlugins.push(
    /*{
      resolve: `gatsby-plugin-guess-js`,
      options: {
        GAViewID: process.env.GA_VIEW_ID,
        jwt: {
          client_email: process.env.CLIENT_EMAIL,
          private_key: process.env.PRIVATE_KEY.replace(/\\n/g, "\n"),
        },
        period: {
          startDate,
          endDate: new Date(),
        },
      }
    },*/
    {
      resolve: `gatsby-source-google-analytics-reporting-api`,
      options: {
        email: process.env.CLIENT_EMAIL,
        key: process.env.PRIVATE_KEY.replace(/\\n/g, "\n"),
        viewId: process.env.GA_VIEW_ID,
        startDate: `2009-01-01`,
      }
    }
  )
}

module.exports = {
  plugins: [
    plugins...
  ].concat(dynamicPlugins),
};

Due to the fact that Code Build uses Linux machines small and capital letters are important (Windows doesnt care).
That means if you import a component like
javascript import MyComponent from "../Mycomponent"
and the actual folder name is ```MyComponent``` your build will fail.
## Speeding up your builds
+ **Image optimization**
If you aren't using preoptimized images yet you should consider to crop, resize images etc. **before** you will build the site because it can basically save a lot of time (depending on the amount of images).
Before i optimized my images a build on Google Cloud took about ~ 1800 sec.
After i optimized all my images for posts with Python ([Image optimization with Python](/articles/scaling-and-cropping-images-using-python "Image optimization with Python")) the build time went down to ~ 620 sec. So actually just a third.
## Set Cloud Scheduler (optional)
With Cloud Scheduler you can trigger a build automatically after a specific time.
The first 3 jobs a month a free and after that you have to pay $0.10 for every job after that.
(You can also use Cloud Scheduler with your default trigger (Push to branch) or without).
The trigger you created before has an ID and with a POST request you can start the trigger anytime you want.
To get the ID of the trigger you have to open the Cloud Shell, type ```gcloud beta builds triggers list``` and search for **id**. Copy that.
The URL for the POST request looks like (without []):
`https://cloudbuild.googleapis.com/v1/projects/[PROJECT_ID]/triggers/[TRIGGER_ID]:run`
Now you have to create a new job in Cloud Schedule.

cron 0 3 * * *
will trigger a build every day at 3 am MESZ.

The URL for the POST request looks like (without []):
`https://cloudbuild.googleapis.com/v1/projects/[PROJECT_ID]/triggers/[TRIGGER_ID]:run
`

In Text you will need
json { "branchName": "master" } ```
and you will authorize the job with your service account.
]]>
Since I used a lot of pictures (and also very large ones in the beginning), this had a huge impact on the speed of the page. Since PageSpeed is a not unimportant ranking factor for search engines like Google and Co, you should of course make a page as fast as possible.
The images used here are mainly satellite images from ESA, which are licensed under the CC BY-SA 3.0 IGO IGO) and may therefore also be used for your own purposes under certain conditions.
These pictures are often ~ 30MB, which is a bit too big for a website. Since I didn't want to crop all pictures manually, I decided to solve this problem with Python or Pillow.
Pillow library
Pillow is a Python library for image processing that can be installed on with (assuming you have Python already installed)
pip install Pillow
Finally you can import the library with
from PIL import Image
into your Python script.
All images for posts are in a separate "images /" folder in the root directory of the project.
First, all ".jpg" files in a certain directory are opened with Pillow and all file names are saved in an array. In addition, a variable is required and can later access any name in the array.
count = 0
image_list = []

for file in glob.iglob('path/to/images/*.jpg'):
    im=Image.open(file)
    image_list.append(os.path.basename(file))
Define sizes and calculate aspect ratio
Now you should know to which sizes the pictures should be cut and whether, for example, the proportions should be retained. For all "PostCover" (pictures in posts) the aspect ratio is ignored and the picture is simply cut to a certain size, which is declared in a global variable.
size = (1903,453) #(width,height)
With all "PostThumbnails" (picture preview) the aspect ratio should be retained and only scaled smaller. A global standard width is defined for this.
basewidth = 500
Then the original width and height of the images are determined, as we need them to be able to calculate and maintain the aspect ratio. Only the new height is needed here, as the standard width has already been predefined.
    width, height = im.size
    wpercent = (basewidth / float(im.size[0]))
    hsize = int((float(im.size[1]) * float(wpercent)))
Cropping and Rescaling
Now you can cut the images with Image.crop or scale them with Image.resize. The new width "basewidth" and the calculated height "hsize" are now used as parameters for scaling.
    imThumbnail = im.resize((basewidth, hsize), Image.LANCZOS)
    imCover = im.crop(((width-size[0])//2, (height-size[1])//2, (width+size[0])//2, (height+size[1])//2))
Then I renamed the thumbnail and saved both new files under static/assets with a quality of "85" .
With the additional parameter "optimize = True" a few KB can be saved.
    newCover = 'static/assets/{}'.format(image_list[count])
    newThumbnail = 'static/assets/{}_thumbnail.jpg'.format(image_list[count].replace(".jpg", ""))
    imCover.save(newCover,optimize=True,quality=85)
    imThumbnail.save(newThumbnail,optimize=True,quality=90)
    count +=1
Complete script:
from PIL import Image
import glob, os

count = 0
image_list = []
basewidth = 500
size = (1903,453)


for file in glob.iglob('path/to/images/*.jpg'):
    im=Image.open(file)
    image_list.append(os.path.basename(file))
    width, height = im.size
    wpercent = (basewidth / float(im.size[0]))
    hsize = int((float(im.size[1]) * float(wpercent)))
    imThumbnail = im.resize((basewidth, hsize), Image.LANCZOS)
    imCover = im.crop(((width-size[0])//2, (height-size[1])//2, (width+size[0])//2, (height+size[1])//2))
    newCover = 'static/assets/{}'.format(image_list[count])
    newThumbnail = 'static/assets/{}_thumbnail.jpg'.format(image_list[count].replace(".jpg", ""))
    imCover.save(newCover,optimize=True,quality=85)
    imThumbnail.save(newThumbnail,optimize=True,quality=90)
    count +=1
Run script automatically
In order not to have to run the script manually every time, you can add the following to "package.json".
"img-optimize": "py ./src/utils/resize_images.py"
So you can optimize all images automatically with npm run img-optimize.

Remote Sensing
Navigation devices, smartphones and weather forecasts are dependent on satellites and without these we have to rely on some services that make our everyday life easier.
Images of the Earth from satellites or aircraft are constantly being recorded. These remote sensing data often have a resolution of up to 30cm, are recorded in a range from 450nm to 2273nm and are mostly referenced by the operators of the satellites.
These pictures are then sold or even provided by many providers free of charge.
Copernicus Open Access Hub
On Sentinel Open Access Hub you can find free products from the Copernicus Program, those from the European Union and others operated by the European Space Agency (ESA).
The Copernicus program basically comprises six satellites (Sentinel-1, Sentinel-2, Sentinel-3, Sentinel-4 (planned start in 2021), Sentinel-5 and Sentinel-6 (planned start in late 2020) .
All of these satellites perform different tasks and help to observe land, sea and the atmosphere.
In the Copernicus Open Access Hub, you can now download all the data provided after registering free of charge. All available data is displayed for download via search criteria and a desired image section, which you can simply draw with a rectangle
ArcGIS currently supports level 1C products.
These image files are relatively large and it may take a while (depending on the internet bandwidth) before the ZIP file is downloaded.
Image classification
These multispectral bands can then be integrated in Arc-GIS or QGIS.
A classification now consists of two main components.
- Generate Training Samples and
- Classification based on the training samples and validation
Generate_Training samples
First, a classification method must be selected (e.g. supervised and pixel-based). This classification method divides individual pixels of the satellite image into thematic classes, e.g.
- Settlement
- Forest
- Water
- Meadow etc.
Here the system is taught (Machine Learning) that, for example, a green pixel stands for the forest class, blue for water, light green for meadow and gray for settlement ,
In order to get the most realistic result possible, one should choose areas / pixels that are as clear as possible for these samples. That For example, there shouldn't be a gray pixel in the class.
When the assignment of samples for each class is done, the actual classification now begins.
Classification based on training Samples and validation
There are various classification methods that can be used e.g. Maximum likelihood. The classification method now only has to be selected and the classification can then be started.
In order to check the quality of the classification, the results are usually validated with e.g. the ground truthing. method.
Then it is checked how many points were classified in the correct class (for example, a settlement was recognized as a settlement). Here one should not be too stingy with the Validierungssamples to achieve a meaningful validation of the image classification.
This can be noted in an Excel list and the overall accuracy of the classification can be easily calculated. Of course you have to write down the wrong and correct classification.
And that's it.
In short, remote sensing is the extraction of geodata or satellite images by satellites and the subsequent methodology (image classification) for evaluating this remote sensing data about the nature of the earth's surfac
]]>
FME Home license
Safe is at the moment not offering Free FME licences for private use anymore!
FME (Feature Manipulation Engine) is a powerful and the most used spatial ETL tool for the migration and processing of spatial data and non-spatial data. The software is very flexible and powerful. It can also handle very large amounts of data without problems.
Feature Manipulation Engine supports over 300 different data sources such as GIS - databases] (PostGIS, MySQL, Oracle, of course also most non-spatial databases), CAD files ( DWG, DXF), raster data, web services, coordinate lists, XML, KML, GML, GeoJSON and much more.
The software is very easy to use and it comes with a nice graphical user interface, in which the source and target data model or format is specified. This also makes complex processing processes very clear.
In between the readers and writers, countless so-called transformers can be used, with which the data can be processed before being imported into a new data source. This workflow can also be supplemented with Python or SQL scripts.
Safe Software offers FME in three versions:
- FME Desktop
- FME Server
- FME Cloud
That sounds great, but you still have no idea?
You can apply for a free (home) license for FME Desktop at Free Licenses for Home Use. If you are a student you can apply for a separate license here.
This license is of course only for personal and not commercial projects.
Submitting the application is very easy. All you have to do is enter your name, your email address, your company if applicable, and how you will use the license. Here it is enough to simply write that you want to get to know the program and of course want to learn it.
As soon as the application has been accepted, you will receive an email with the license key.
On the page Downloads you can then download the desktop version and enter the license key you received after the installation process. The license is valid for one year (four months for students) and can be expanded as required.
There is a Knowledge Base where you can find thousands of tutorials.
For more complex problems, it is also advisable to take a look at gis-stackexchange.com.
]]>
With the free contingent for AWS you always get an active AWS code pipeline per month and 100 minutes AWS codebuild per month.
So you can set up a continuous integration and continuous delivery pipeline for free or with more than 100 build minutes a month for relatively little money, which triggers a build with every push to a GitHub repository whoch will be automatically deployed to S3 and optionally also invalidate CloudFront Cache.
CodeBuild
First of all you need a new build project in CodeBuild. In the project configuration you can assign a name for it and select GitHub as the source provider under Source.
Depending on whether the repository is public or not, you then select "Public Repository" and enter the repository URL or you link your GitHub account and give CodeBuild the necessary rights to access the repository.
An environment image must now be selected under Environment. For GatsbyJS this would be a "managed image" and the operating system "Amazon Linux 2". "Standard" is selected as the runtime (s) and "aws / codebuild / amazonlinux2-x86_64-standard: 2.0" as the image.

Now a new service role can be created automatically (which is required) so that CodeBuild has the necessary rights for the AWS account.
This service role can also be assigned rights for CodePipeline, so that this service role can be used for CodeBuild and CodePipeline. If environment variables are used, these can be specified under "Additional configuration" in the environment. You can also make sure that "3GB RAM, 2vCPUs" is really selected, since only this option is included in the free contingent.
Buildspec now uses a buildspec file in YAML format. For a Gatsby site this should somehow look like the following:
version: 0.2
phases:
    install:
        runtime-versions:
            nodejs: 12
        commands:
            - 'touch .npmignore'
            - 'npm install -g gatsby'
    pre_build:
        commands:
            - 'npm install'
    build:
        commands:
            - 'npm run build'
    post_build:
        commands:
            - 'find public -type f -regex ".*\.\(htm\|html\|txt\|text\|js\|css\|json\)$" -exec gzip -f -k {} \' ## sofern cloudfront nicht automatisch die dateien komprimiert
artifacts:
    base-directory: public
    files:
        - '**/*'
    discard-paths: no
cache:
    paths:
        - '.cache/*'
        - 'public/*'
The buildspec.yml file only needs to be placed in the root directory so that CodeBuild can find it. In addition, the build script must of course still be available in "package.json".
"build": "gatsby build",
The default settings can be retained under Artifacts. With CloudWatch you have the possibility to save logs for CodeBuild in an S3 bucket.
There may be additional costs!
If all settings have now been entered correctly, the build project can be created. The only thing missing now is the code pipeline that triggers a build and deployed it in the S3 bucket.
CodePipeline
For this you switch to CodePipeline and create a new pipeline in which a name and a service role are selected first.
At Source you can now log in with a GitHub account and link the respective repository with a branch. You now have two options to trigger a build.
- GitHub-Webhooks and
- AWS CodePipeline
Then you choose the build provider "AWS CodeBuild" and the previously created project or (if you have not already done this) create a new project.
After a build, the public/ folder can also be automatically deployed to an S3 bucket with AWS CodeDeploy. Alternatively you can also skip this step and gatsby-plugin-s3, which also optimizes caching.
npm i gatsby-plugin-s3
bzw.
yarn add gatsby-plugin-s3
Now the configuration in gatsby-config.js and the deployment script are missing
plugins: [
  {
      resolve: `gatsby-plugin-s3`,
      options: {
          bucketName: 'my-website-bucket'
      },
  },
]
"scripts": {
    ...
    "deploy": "gatsby-plugin-s3 deploy --yes"
}
The deployment script "npm run deploy" must then of course be added to the buildspec file under post-build commands. The CodePipeline should now look something like this:

Experience shows that a build for around 100 pages takes around 10 minutes if you have some pictures per page.
Every time CodePipeline detects a push to the GitHub repository, a build is automatically triggered and made available on an S3 bucket.
With aws cloudfront create-invalidation --distribution-id DISTRIBUTION_ID --paths / * the CloudFront cache can also be invalidated.

As the volume of data continues to surge, effective management becomes paramount. Geographic Information System (GIS) databases emerge as powerful solutions, facilitating the storage, management, and querying of geodata. Here, we delve into both free and open-source as well as proprietary GIS databases to aid in your data management endeavors.
Free and Open-Source GIS Databases
ArangoDB Community Edition
- A user-friendly, potent open-source NoSQL database with a unique feature set.
- Website: https://www.arangodb.com
PostGIS / PostgreSQL
- PostGIS provides spatial objects for the PostgreSQL database, enabling storage and retrieval of location information.
- Website: https://postgis.net / https://www.postgresql.org
MariaDB
- A leading database server developed by the original creators of MySQL.
- Website: https://mariadb.org/
MySQL
- Widely used relational database management system, available as open-source or commercial enterprise versions.
- Website: https://www.mysql.com/
OrientDB
An open-source NoSQL database written in Java, combining features of document-oriented and graph databases.
Website: https://www.orientdb.com
SQLite / SpatialLite
SpatialLite is an open-source library extending SQLite with comprehensive spatial SQL functions.
Website: https://www.sqlite.org / https://www.gaia-gis.it/fossil/libspatialite
Proprietary GIS Databases
Oracle Spatial
- Oracle Spatial and Graph, a separately licensed component of the Oracle database, is utilized for storing and managing geographic information.
- Website: https://www.oracle.com
Whether you opt for the flexibility of open-source GIS databases or the robust features of proprietary solutions like Oracle Spatial, the choice depends on your project's specific needs.
]]>
In order to be able to work with digital maps or information (geodata), a geographic information system (GIS) is used. With GIS, geodata can be recorded, edited, analyzed and displayed appropriately. There are now many good providers of geographic information systems, the two best known of which are probably QGIS (Open Source) and ArcGIS from Esri.
Now you have decided on a GIS, but the question still arises which additional GIS applications (also called industry models) are required or which are available at all. I would like to go into this further in this article.
Basically there are GIS applications for the following industries:
- Banks
- Education
- Infrastructure development
- Disaster management
- Agriculture
- Logistics
- Marketing
- Medicine
- Telecommunications
- Tourism
- Crime mapping
- Traffic
- Insurance
- Economic development
For each of these industries, GIS service providers offer different GIS applications and also adapt them individually to the needs of the customers.
In the following, I would like to go into more detail about a few applications, especially for municipalities (GIS).
Tree cadastre
A tree cadastre supports municipalities and tree care companies in the collection, control and management of tree stands. Trees can be divided into groups of trees and various material data or media can also be added to the trees:
- Number, type, height, crown diameter, degree of sealing, type of soil, damage, maintenance measures carried out or checks and pictures, to name just a few.
The trend here is towards mobile solutions. This means apps that allow you to enter data into the GIS directly on a tablet using controls or maintenance measures. This data is stored online and can then be corrected or revised later in the office.
Development plans / land use plans
Development and land use plans can be easily managed and evaluated in a GIS.
Depending on the legal validity, areas of validity can be displayed in different colors, changes can be linked to the main plan, and text files, such as additions to the articles of association, can be added.
In addition, analog development plans can be prepared (scanned, georeferenced) and displayed in the GIS. This can be done with PDF or CAD files, for example.
As a result, you get a data record for each development plan, to which all associated files and changes are linked, and can present them in an appealing or clear manner.
Real estate cadastre
For example, in the case of a construction project in a certain area, all affected citizens can be identified and written to very easily by automatically creating reports using templates for writing and selecting all citizens in this area (in this area in the GIS).
Sealing cadastre (split sewage fees)
All sealed areas of a property are determined in a sealing register. This takes place via a previously carried out aerial survey, in which high-resolution images are taken, or via digitization of satellite images.
All parcels are combined into one plot and the sealed areas of these parcels are linked to the plot. This enables municipalities to determine the split rainwater fee.
Supply networks
Water
Water supply networks can be managed digitally in a GIS. Hydrant plans can be created automatically, which can be very helpful, for example, for the local fire brigade in an emergency.
Repairs carried out on pipes can be stored digitally, so that you always have an overview of which pipes have already been renovated and which should be renovated in the near future.
Sewage
Many commissions are legally obliged to keep a channel register.
A channel register is created either from analog data such as plans, which are digitized, or from a measurement that has been carried out beforehand.
In a channel cadastre, data such as posture length, depth, cable diameter material, etc. can be saved, managed and analyzed.
Large corporations now also have wastewater registers for their company premises.
Electricity / gas / broadband / street lighting
Enables the acquisition, management and analysis of all supply networks.
Tree and green areas
Allows the construction of a tree and green area register for further planning and maintenance of the inventory.
Conclusion
Especially in municipalities, the importance of a geographic information system is beyond question. A lot of time is saved due to less administrative work.
The various industry models can be easily combined with each other, making work processes much more efficient.
But also in the private sector, e.g. In the real estate market, in agriculture or in archeology, the advantages of a geographic information system (GIS) are increasingly recognized and used. Mobile apps that are combined with a GIS are particularly popular.
If you want to see more applications, check out GIS-Geography. There you will find 1000 GIS Applications & Uses - How GIS Is Changing the World.
]]>
GIS Volunteering offers a good opportunity to develop personally and professionally.
You can also get involved in a good cause. You can later pack the projects into a pretty portfolio and thus stand out from the competition with extra points when applying.
What's even better is that you can join these organizations with a PC at home and don't have to travel the world.
OpenStreetMap
![]()
https://www.openstreetmap.org/
OpenStreetMap is an international project that was founded in 2004.
The aim of OSM is to create a free world map and make it available to everyone free of charge. The data is collected by volunteers (also known as ** mappers **). Data on roads, railways, rivers, forests, houses, etc. are collected.
How to join
There are many different ways to contribute to OpenStreetMap, from reporting small errors on the map, completing existing data, drawing new buildings from aerial photographs and recording routes and points of interest with the GPS device. Our instructions will help you use the right programs and enter data. (OpenStreetMap).
Humanitarian OpenStreetMap Team
![]()
The Humanitarian OpenStreetMap Team (HOT) is an international team dedicated to the mapping and mapping of humanitarian actions and the development of communities. The data are used to reduce risks in the and to work on sustainable development.
GIS Freiwilligenarbeit mit HOT
As a mapping volunteer you can collect data for maps as with OpenStreetMap. ** Humanitarian and GIS Professionals ** also help in additional areas, such as data processing, validation of maps or create completely new maps and visualizations.
Standby Task Force
![]()
https://www.standbytaskforce.org/
Standby Task Force is a global network of trained and experienced volunteers who work together online.
The Standby Task Force is a non-profit organization founded in 2010.
The Standby Task Force has been involved in many natural disasters since then, and the volunteers have assisted many humanitarian organizations in election observation and other projects.
Voluntary with the Standby Task Force
You should already have professional experience in the areas of GIS management, disaster management and other technical areas.
GISCorps
![]()
https://www.giscorps.org/ GISCorps coordinates short-term, voluntary GIS services for disadvantaged communities.
The projects vary according to the needs of the partner agency and can include all aspects of GIS, including analysis, cartography, app development, needs analysis, technical workshops etc.
The service areas include humanitarian aid, disaster protection, environmental protection, health and health personnel services, GIS training and crowdsourcing of experts. GISCorps is supported by individual donations, companies and other non-profit groups with similar goals.
Engage
At GISCorps there are several ways to get involved. You can apply as a volunteer and actively support GIS projects. You can get a one-year ArcGIS license for free here, provided you are accepted.
You can of course also support the project with donations.
]]>
Podcasts are a great way to keep up to date with current developments. Best of all, you can listen to podcasts practically anywhere.
VerySpatial
The podcast is hosted by Jesse Rouse, Sue Bergeron and Frank Lafone. An established podcast that discusses geography, geographic information technologies and the impact of GIS on everyday digital life.

Mapscaping
New podcast. Mainly interviews with people from the GIS and geo industry.
https://mapscaping.com/blogs/the-mapscaping-podcast

Radio OSM
Reports and news about OpenStreetMap, the free wiki world map.
https://podcast.openstreetmap.de/

Geodorable
A podcast that can contain everything and everyone about the geodata world.

The Mappyist Hour
Geographers and geo-types who talk about how incredible their job is after work.
http://www.themappyisthour.com/

Speaking of GIS
A podcast by Kurt Towler. The podcast includes interviews with other geospatialists and reviews of conferences.

Scene from Above
A podcast with a view of the world of modern remote sensing and earth observation. Driven by their passion for all grid and geodata, they strive for a mix of news, opinions, discussions and interviews.

Directions Magazine
Every six weeks, new location-based podcasts are released by another geographic information branch.
https://player.fm/series/directions-magazine-podcasts

Cageyjames & Geobabbler
This monthly podcast by James Fee and Bill Dollins is about how you can use spatial technologies in your workflow.

Geographical Imaginations
Geographical Imaginations Expedition & Institute is a growing public geography initiative for multimedia media that aims to bring together academic and everyday geographic or spatial thinking.
https://podcasts.apple.com/us/podcast/geographical-imaginations/id1386704057?mt=2

Women and Drones
A podcast that serves to make women in the UAS industry better known around the world.
http://womenanddrones.libsyn.com/


In this post you will find a list of free and/or open-source and proprietary GIS-software options.
Free and open-source desktop-GIS software
1. QGIS
QGIS is a free and open-source geographic information system. With QGIS you can create, modify, visualize and analyze spatial data on Windows, Mac, Linux, BSD and Android.
2. GRASS GIS
GRASS GIS is a hybrid, modular geographic information system software with grid and vector-oriented functions.
3. SAGA GIS
Software for automated geoscientific analysis. The SAGA project is mainly developed at the Department of Geography at the University of Hamburg.
Java based open-source GIS.
5. GeoDa
GeoDa is a free and open-source GIS-software and serves as an introduction to geodata analysis.
6. gvSIG
Open-Source Desktop, Online und Mobile GIS.
7. MapmakerPro
MapMaker is aimed at specialists who need to create maps. For example foresters, archaeologists, emergency services, etc..
8. DIVA GIS
DIVA-GIS is a free GIS for mapping and analyzing geographic data.
9. TerraLib
TerraLib is an open source GIS software library that supports the development of custom geographic applications.
10. Kalypso
Kalypso is an open source modeling program. The focus is on numerical simulations in water management and ecology.
11. OrbisGIS
OrbisGIS is a cross-platform open source GIS developed by and for research.
12. OzGIS
OzGIS is a GIS for analyzing and displaying spatial statistics.
13. FalconView
FalconView is a GIS developed by the Georgia Tech Research Institute.
14. ILWIS
The Integrated Land and Water Information System (ILWIS) is a desktop-based GIS and remote sensing software that was developed by ITC up to Release 3.3 in 2005.
15. MapWindow GIS
MapWindow GIS is an open source GIS desktop application that is used by a large number of users and organizations around the world.
16. Whitebox GAT
Whitebox Geospatial Analysis Tools is an open source, cross-platform geospatial information system and remote sensing software package.
17. Capaware
3D-world-viewer.
The Generic Mapping Tools are a collection of free software for creating geological or geographical maps and diagrams.
Proprietary GIS Software
19. ArcGIS, ArcView
ArcGIS is the generic term for various GIS software products from Esri.
20. AutoCAD Map3D
AutoCAD Map3D from Autodesk is a GIS software solution and offers extensive access to all CAD and GIS data and enables its creation and editing.
21. Aquaevo GIS
Aquaveo is a GIS software for modeling environmental and water resources.
22. Bentley Map
23. Cadcorp
Cadcorp's GIS and Web Mapping Software are GIS software products for the creation, analysis and data management of geodata.
24. Conform
Conform is a GIS software for merging, visualizing, editing and exporting 3D environments for urban planning, games and simulations.
25. Dragon / ips
Dragon / ips is a remote sensing image processing software.
26. ENVI
The ENVI image analysis software is used by GIS experts, remote sensing scientists and image analysts to extract meaningful information from images to help them make better decisions.
27. ERDAS IMAGINE
ERDAS IMAGINE is software for evaluating remote sensing data, especially graphics and photos.
28. Field-Map
Field-Map is a proprietary integrated tool for programmatic field data acquisition by IFER - Monitoring and Mapping Solutions, Ltd. It is mainly used for mapping forest ecosystems and for data collection during field analysis.
29. Geosoft
GEOSOFT is one of Germany's leading developers of geodetic computing and organizational software for private and public surveying agencies.
30. GeoTime
GeoTime is a geodata analysis software that enables the visual analysis of events over time. The third dimension adds time to a two-dimensional map so that users can see changes in time series data.
31. Global Mapper
Geographic information system with distance and area calculation; offers an integrated scripting language, 3D display and GPS tracks.
32. Golden Software
Surfer and Mapviewer are two software solutions with a variety of mapping and adaptation options and support any geodata format (including LiDAR data), 3D visualization, as well as volume / distance / area calculations.
33. Intergraph
GeoMedia is a GIS software from Intergraph. GeoMedia is a software product family with desktop GIS, web GIS and is mainly aimed at municipalities.
34. Manifold System
Manifold System is software for the management of digital maps. Digital maps and remote sensing data can be easily edited.
35. MapInfo
MapInfo Professional is a geographic information system software from the US company MapInfo Corporation.
36. Maptitude
Maptitude is a mapping software program created by Caliper Corporation that allows users to view, edit, and integrate maps. The software and technology are designed to facilitate the geographic visualization and analysis of contained data or user-defined external data.
37. Netcad
NETCAD GIS is a CAD and GIS software that supports international standards and was designed for users of engineering and geographic information systems.
38. RegioGraph
RegioGraph is a geomarketing software specializing in questions in the areas of marketing, sales, controlling, logistics and corporate strategy.
39. RIWA GIS Zentrum
The RIWA GIS Zentrum is a powerful, web-based geographic information system that has been used in numerous municipal administrations and industrial companies for many years.
40. Smallworld
Smallworld GIS is the professional geographic information system for network operators in the energy and water industries.
41. TNTmips
TNTmips is a geospatial data analysis system that offers a fully featured GIS, RDBMS and automated image processing system with CAD, TIN, surface modeling, map layout and innovative data publishing tools.
42. TerrSet ( IDRISI )
TerrSet is an integrated geographic information system and remote sensing software for monitoring and modeling the Earth system.
43. Google Earth Pro
Google Earth Pro Desktop is free and intended for users who need advanced features. You can import and export GIS data and go on a journey through time with the help of historical images.
Online GIS
44. Bing Maps
Bing Maps is an online map service from Microsoft, through which various spatial data can be viewed and spatial services can be used. It is a further development of the MSN Virtual Earth and is part of the Bing search engine.
45. Google Maps
Google Maps is an online map service from the US company Google LLC. The surface of the earth can be viewed as a road map or as an aerial or satellite image, with locations of institutions or known objects also being displayed. The service started on February 8, 2005.
46. NASA World Wind
NASA World Wind is an open source software that enables satellite and aerial images to be displayed on a virtual globe combined with elevation data and to be zoomed in anywhere in the world in 3D graphics and viewed freely from all sides.
47. OpenStreetMap
OpenStreetMap is a free project, which collects freely usable geodata, structures it and keeps it in a database for everyone to use. This data is under a free license, the Open Database License.
48. Wikimapia
Wikimapia is a web interface that combines maps with a restricted wiki system without hypertext functions. It allows the user to add information in the form of a note to any position on the earth.
Other GIS-Tools and Software used with GIS
49. GDAL/OGR
The Geospatial Data Abstraction Library (GDAL / OGR) provides command line-based auxiliary programs. A large number of raster and vector geodata formats can be converted and processed using these.
50. Leaflet
Leaflet is the leading open-source JavaScript library for mobile-friendly interactive maps.
51. OpenLayers
OpenLayers makes it easy to put a dynamic map in any web page. It can display map tiles, vector data and markers loaded from any source.
52. R
R is a free programming language for statistical calculations and graphics.
53. Blender
Blender is a free, GPL-licensed 3D graphics suite with which bodies can be modeled, textured and animated.
]]>
Managing your own newsletter is crucial for creating a sustainable online-business. With E-Mails you can build a relationsship with your audience and engage with them so they will drive some nice traffic to your new post or whatever you just have published and want to promote.
If you are using Mailchimp you can use the plugin gatsby-plugin-mailchimp to manage your e-mail list.
Getting started
Simply add the plugin to your package.json with
npm install gatsby-plugin-mailchimp
or
yarn add gatsby-plugin-mailchimp
and implement it in your gatsby.config.js like
{
        resolve: 'gatsby-plugin-mailchimp',
        options: {
            endpoint: '', // string; add your MC list endpoint here; see instructions below
            timeout: 3500, // number; the amount of time, in milliseconds, that you want to allow mailchimp to respond to your request before timing out. defaults to 3500
        },
    },
If you don't have your Mailchimp endpoint yet i would suggest to have a README of gatsby-plugin-mailchimp. They described every step with images so it's really easy to get your endpoint url.
Once you have your Mailchimp endpoint you should save it as environment variable in your project.
Creating a sign-up form
Only thing you will need is to import the addToMailChimp method to your newsletter sign-up component which will work like this:
import addToMailchimp from 'gatsby-plugin-mailchimp'
(I am actually working with styled components which are stored in a separate file in the same folder. This file is imported with
import * as S from './styled'
and the components then are used like S.NewsletterWrapper. But to make it a bit more clear i declared everything in the same file for this post.)
So now you need some styled (and responsive) components which will create your actual form like:
<NewsletterWrapper>
  <DescriptionWrapper>
    <p>
      Do you want to know when I post something new? <br/>
      Then subscribe to my newsletter.
      🚀
    </p>
  </DescriptionWrapper>
  <InputWrapper>
    <Input
      type="email"
      name="email"
      id="mail"
      label="email-input"
      placeholder="Your e-mail address"
      onChange={(e) => setEmail(e.target.value)}
    />
  </InputWrapper>
  <ButtonWrapper>
    <Button
      type="button"
      aria-label="Subscribe"
      onClick={() => handleSubmit()}
    >
    Subscribe
    </Button>
  </ButtonWrapper>
</NewsletterWrapper>
In this component you will show a different message from the default one after a user has successfully subscribed to your newsletter. To do so you need a variable which will store the current state (submitted = true or submitted = false). This variable will have the default value false, which will be set to true after a user has subscribed successfully.
So if a user clicks on the "Subscribe-Button" the function handleSubmit will be executed which does the following:
- input data will be send to the Mailchimp endpoint with
addToMailchimp(email), - if the returned property from the Mailchim API has the value "error" your error handling function will handle the event,
- otherwise the subscribe is being tracking with a custom Google Analytics event and submitted will be set to true.
The Mailchimp API will always return a object with the properties result and msg.
{
    result: string; // either `success` or `error` (helpful to use this key to update your state)
    msg: string; // a user-friendly message indicating details of your submissions (usually something like "thanks for subscribing!" or "this email has already been added")
}
Finally you just have to check the value of submitted and render the relevant content like the following:
  return (
    <>
      {submitted ? (
        <NewsletterWrapper>
          <DescriptionWrapper>
            <h2>
              🎉 Successfully subscribed! 🎉
            </h2>
            <p>
            Thank your for your interest in my content.
            </p>
          </DescriptionWrapper>
        </NewsletterWrapper>
      ) : (
        <NewsletterWrapper>
            <DescriptionWrapper>
              <p>
                Do you want to know when I post something new? <br/>
                Then subscribe to my newsletter.
                🚀
              </p>
            </DescriptionWrapper>
          <InputWrapper>
            <Input
              type="email"
              name="email"
              id="mail"
              label="email-input"
              placeholder="Your e-mail address"
              onChange={(e) => setEmail(e.target.value)}
            />
          </InputWrapper>
          <ButtonWrapper>
            <Button
              type="button"
              aria-label="Subscribe"
              onClick={() => handleSubmit()}
            >
              "Subscribe"
            </Button>
          </ButtonWrapper>
        </NewsletterWrapper>
      )}
    </>
  )
}
If you want to learn more about sign-up forms i suggest to have a look at Non-Invasive Sign Up Forms from Slarsen Disney. He is creating super UX-friendly websites and is sharing the code for it.
import addToMailchimp from "gatsby-plugin-mailchimp"
import React, { useState } from "react"
import ConfettiAnimation from "../Animations/ConfettiAnimation"
import { trackCustomEvent } from "gatsby-plugin-google-analytics"
import styled from 'styled-components';

export const NewsletterWrapper = styled.form`
    display: flex;
    flex: 0 1 auto;
    flex-direction: row;
    flex-wrap: wrap;
    box-sizing: border-box;
    max-width: 750px;
    justify-content: center;
`
export const DescriptionWrapper = styled.div`
    text-align: center;
    flex-grow: 0;
    flex-shrink: 0;
    flex-basis: 100%;
    max-width: 100%;
`

export const InputWrapper = styled.div`
    flex-direction: column;
    justify-content: center;
    display: flex;
    flex-grow: 0;
    flex-shrink: 0;
    flex-basis: 50%;
    max-width: 66.66667%;
`

export const Input = styled.input`
    padding-top: 15px!important;
    padding-bottom: 15px!important;
    padding: 12px 20px;
    margin: 8px 0;
    box-sizing: border-box;
    border: 2px solid hsla(0,0%,90.2%,.95);
    :invalid {
        border: 1px solid red;
    }
`

export const ButtonWrapper = styled.div`
    flex-direction: column;
    justify-content: center;
    display: flex;
    flex-grow: 0;
    flex-shrink: 0;
    flex-basis: 50%;
    max-width: 33.33333%;
`

export const Button = styled.button`
    box-sizing: border-box;
    border: 2px solid ${props =>
        props.background ? props.background : 'white'};
    color: white;
    text-transform: uppercase;
    position: relative;
    padding-top: 15px!important;
    padding-bottom: 15px!important;
    outline: none;
    overflow: hidden;
    width: 100%;
    transition: all .2s ease-in-out;
    text-align: center;
    background: ${props =>
        props.background ? props.background : 'hsla(0,0%,90.2%,.95)'};
    :hover {
        box-shadow: rgba(0, 0, 0, 0.5) 0px 8px 16px 0px;
        transform: translateY(0) scale(1);
`

export default ({ }) => {
  const [email, setEmail] = useState("")
  const [submitted, setSubmitted] = useState(false)


  function errorHandling(data) {
    // your error handling
  }

  const handleSubmit = () => {
    addToMailchimp(email).then((data) => {

      if (data.result == "error") {
        errorHandling(data)
      } else {
        trackCustomEvent({
          category: "Newsletter",
          action: "Click",
          label: `Newsletter Click`,
        })
        setSubmitted(true)
      }
    })
  }

  return (
    <>
      {submitted ? (
        <NewsletterWrapper>
          <DescriptionWrapper>
            <h2>
              🎉 Successfully subscribed! 🎉
            </h2>
            <p>
            Thank your for your interest in my content.
            </p>
          </DescriptionWrapper>
        </NewsletterWrapper>
      ) : (
        <NewsletterWrapper>
            <DescriptionWrapper>
              <p>
                Do you want to know when I post something new? <br/>
                Then subscribe to my newsletter.
                🚀
              </p>
            </DescriptionWrapper>
          <InputWrapper>
            <Input
              type="email"
              name="email"
              id="mail"
              label="email-input"
              placeholder="Your e-mail address"
              onChange={(e) => setEmail(e.target.value)}
            />
          </InputWrapper>
          <ButtonWrapper>
            <Button
              type="button"
              aria-label="Subscribe"
              onClick={() => handleSubmit()}
            >
              "Subscribe"
            </Button>
          </ButtonWrapper>
        </NewsletterWrapper>
      )}
    </>
  )
}

What is OpenLayers?
OpenLayers is a JavaScript library that makes it relatively easy to visualize geodata in web applications (Web-GIS).
OpenLayers is a programming interface that allows client-side development independent of the server. Map tiles, vector data and markers from various data sources can be displayed.
Open Layers was developed to promote the use of geodata Of all kinds. OpenLayers is also free, open-source and is published under "2-clause BSD License".
To be able to create a map with OpenLayers, all you need is a basic general knowledge of programming languages. The missing pieces of the puzzle can be found very easily using the detailed documentation on OpenLayers.
Create HTML file
First of all, an HTML file is required as the basic framework. The basic structure usually looks like this:
    <html>
      <head>
        <title>OpenLayers Demo</title>
      </head>
      <body>
      </body>
    </html>
You can now copy this code and paste it into a file that you name, for example, "jsmap.html".
If you want to learn more about HTML, you can find a few useful tutorials on w3schools.
Insert OpenLayers Javascript library
Now the OpenLayers Javascript is integrated into the HTML. You copy for that
<script src="proxy.php?url=http://www.openlayers.org/api/OpenLayers.js"></script>
between <title> and <head>. You can do that right away
function init() {
  map = new OpenLayers.Map("basicMap"); //create a new map
  var mapnik = new OpenLayers.Layer.OSM(); //add an OpenStreetMap layer to have some data in the mapview
  map.addLayer(mapnik); //add the OSM layer to the map

  var markers = new OpenLayers.Layer.Markers( "Markers" ); //add a layer where markers can be put
  map.addLayer(markers); //add the markers layer to the current map

  var lonLat = new OpenLayers.LonLat( 13.0 ,47.8 ) //define a new location with these coordinates in WGS84
    .transform(  //transform the location to the coordinate system of our OpenLayers map
      new OpenLayers.Projection("EPSG:4326"), // transform from WGS 1984
      map.getProjectionObject() // to Spherical Mercator Projection
    );
  markers.addMarker(new OpenLayers.Marker(lonLat)); //add the newly created marker to the markers layer

  map.setCenter(lonLat, 15); // Use maker to center the map above and set zoom level to 15
}
also included in script tags. Here a function with the name init is created, the
- which creates the map and inserts it in the element "basicMap"
- created a layer with OpenStreetMap data and added it to the map
- creates a layer for markers and also adds this to the map
- Defined a marker in WGS84 and then transformed it from WGS1984 to Spherical Mercator Projection
- add this marker to the map
- and finally centered the map on this marker and set a zoom level.
Now this function must also be loaded and the card placed. For that you are replacing now
  <body>
  </body>
with
    <body onload="init();">
        <div style="width: 100%; height: 60%;" id="basicMap"></div>
    </body>
With javascript onload =" init ();the function is executed when loading the HTML file and inserted via the idid = "basicMap".
Your complete file should now look like this:
<html>
<head>
<title>OpenLayers Demo</title>
<script src="proxy.php?url=http://www.openlayers.org/api/OpenLayers.js"></script>
<script>
function init() {
map = new OpenLayers.Map("basicMap"); //create a new map
var mapnik = new OpenLayers.Layer.OSM(); //add an OpenStreetMap layer to have some data in the mapview
map.addLayer(mapnik); //add the OSM layer to the map
var markers = new OpenLayers.Layer.Markers( "Markers" ); //add a layer where markers can be put
map.addLayer(markers); //add the markers layer to the current map
var lonLat = new OpenLayers.LonLat( 13.0 ,47.8 ) //define a new location with these coordinates in WGS84
.transform( //transform the location to the coordinate system of our OpenLayers map
new OpenLayers.Projection("EPSG:4326"), // transform from WGS 1984
map.getProjectionObject() // to Spherical Mercator Projection
);
markers.addMarker(new OpenLayers.Marker(lonLat)); //add the newly created marker to the markers layer
map.setCenter(lonLat, 15); // Use maker to center the map above and set zoom level to 15
}
</script>
</head>
<body onload="init();">
<div style="width: 100%; height: 60%;" id="basicMap"></div>
</body>
</html>
If you save the file and open it, you will end up in the browser of your choice and your Javascript web map will be displayed with OpenLayers.
If you now want to change the position of the marker, all you have to do is change the coordinates.
Create markers with a 'for .. of ..' loop
Normally, you often want to display several points and not just one on the map. In theory you could
var lonLat = new OpenLayers.LonLat( 13.0 ,47.8 ) //define a new location with these coordinates in WGS84
.transform( //transform the location to the coordinate system of our OpenLayers map
new OpenLayers.Projection("EPSG:4326"), // transform from WGS 1984
map.getProjectionObject() // to Spherical Mercator Projection
);
markers.addMarker(new OpenLayers.Marker(lonLat)); //add the newly created marker to the markers layer
now copy for each additional marker you want to create and simply change the coordinates. But since the whole thing becomes relatively confusing, we will solve it differently.
First, we create an array of arrays.
var poi = [ // create array with point of interests
[ 11.557617 ,48.092757 ],
[ 8.558350, 50.028917 ],
[ 6.701660, 51.289406 ],
[ 13.337402, 52.496160 ]
];
All coordinates for the markers to be displayed are now stored in this array. Now we create a function that can be called to create markers and add them to the map.
function createmarker (lon,lat) {
var feature = new OpenLayers.LonLat( lon, lat ) // create features (locations) out of arrays in points
.transform( //transform the location to the coordinate system of our OpenLayers map
new OpenLayers.Projection("EPSG:4326"), // transform from WGS 1984
map.getProjectionObject() // to Spherical Mercator Projection
);
markers.addMarker(new OpenLayers.Marker(feature)); // Add new features to markers layer
}
This function should now be carried out for each pair of coordinates in the "poi" array. This can be solved with a "for .. of" loop.
for (var x of poi) { // for each array(object) in array
createmarker (x[0],x[1]) // create markers
}
In this loop, a marker is now created for each coordinate pair in the array, transformed and added to the map. The "poi" array can now be expanded as required and the additional markers are automatically added to the map.
Add markers via UI
In order to make the whole thing more user-friendly and not having to change the code manually every time, we are now creating a simple user interface to add additional markers.
The new coordinates should be entered via two input fields and created with a confirmation on a button.
The HTML framework can look like this and should be placed somewhere in the "body" area:
<div class="add_markers">
<div class="input_markers">
Add new markers with coordinates in WGS84!
<div class="row">
<div class="col-25">
<label for="lat">Latitude:</label>
</div>
<div class="col-75">
<input type="text" id="lat" name="firstname" placeholder="48.060614">
</div>
</div>
<div class="row">
<div class="col-25">
<label for="lon">Longitude:</label>
</div>
<div class="col-75">
<input type="text" id="lon" name="lastname" placeholder="12.190876">
</div>
</div>
<button id="add_marker" class="button">Add marker!</button>
<div id="poi_added" class="poi_added"></div>
</div>
</div>
</div>
The most important here are the ids via which the values of the fields are later adopted.
To create these markers we use a function that is called every time the button "Add Marker!" is clicked.
The complete function looks like this:
function addFeature() {
var lat = parseFloat(document.getElementById("lat").value); // get value of input lat and parse to float
var lon = parseFloat(document.getElementById("lon").value); // get value of input lon and parse to float
var newFeature = [ lon, lat ] // create array "newFeature" with lon , lat
poi.push(newFeature) // add NewFeature to array "poi"
createmarker (lon,lat) // create marker for input lat, lon
document.getElementById('poi_added').innerHTML = "Added marker for " + "latitude: " + lat + "; longitude: " + lon; // visual feedback for added marker
}
var lat = parseFloat(document.getElementById("lat").value); // get value of input lat and parse to float
var lon = parseFloat(document.getElementById("lon").value);
Are references to the elements with the ID "lat" and "lon", ie the two input fields. Here the two variables "lat" and "lon" are created, to which the value from the input fields is assigned.
Then they are merged into an array, since a marker always consists of two coordinates and is added to the "poi" array.
var newFeature = [ lon, lat ] // create array "newFeature" with lon , lat
poi.push(newFeature) // add NewFeature to array "poi"
Adding it to the "poi" array is not functionally necessary, but it can be useful if, for example, you want to create popovers that show the coordinates of each marker.
The coordinates are now saved in "lat" and "lon" and they only have to be transferred to the previously created function "createmarker", which creates the markers and adds them to the map.
createmarker (lon,lat) // create marker for input lat, lon
It would be nice if the user received feedback about what happened after clicking the button. This can be done with
document.getElementById('poi_added').innerHTML = "Added marker for " + "latitude: " + lat + "; longitude: " + lon; // visual feedback for added marker
The last thing that is missing is that the function is executed with a click on the button.
document.getElementById('add_marker').addEventListener('click', addFeature); // execute function "addFeature" when button with id "add_marjer" is clicked
As soon as the button with the id "add_marker" is clicked, the "addFeature" function is now executed.
With
var extent = map.zoomToExtent(markers.getDataExtent()); // get extent of markers layer
the extent of the "markers" layer is determined, zoomed onto it and assigned to the variable extent.
If you now save and open your file again, you should see your map with all markers and be able to add additional markers via a graphical user interface.
<html>
<head>
<title>OpenLayers Demo</title>
<script src="proxy.php?url=http://www.openlayers.org/api/OpenLayers.js"></script>
<script>
function init() {
map = new OpenLayers.Map("basicMap"); //create a new map
var mapnik = new OpenLayers.Layer.OSM(); //add an OpenStreetMap layer to have some data in the mapview
map.addLayer(mapnik); //add the OSM layer to the map
var markers = new OpenLayers.Layer.Markers( "Markers" ); //add a layer where markers can be put
map.addLayer(markers); //add the markers layer to the current map
function createmarker (lon,lat) {
var feature = new OpenLayers.LonLat( lon, lat ) // create features (locations) out of arrays in points
.transform( //transform the location to the coordinate system of our OpenLayers map
new OpenLayers.Projection("EPSG:4326"), // transform from WGS 1984
map.getProjectionObject() // to Spherical Mercator Projection
);
markers.addMarker(new OpenLayers.Marker(feature)); // Add new features to markers layer
}
var poi = [ // create array with point of interests
[ 11.557617 ,48.092757 ],
[ 8.558350, 50.028917 ],
[ 6.701660, 51.289406 ],
[ 13.337402, 52.496160 ]
];
for (var x of poi) { // for each array(object) in array
createmarker (x[0],x[1]) // create markers
}
var extent = map.zoomToExtent(markers.getDataExtent()); // get extent of markers layer
function addFeature() {
var lat = parseFloat(document.getElementById("lat").value); // get value of input lat and parse to float
var lon = parseFloat(document.getElementById("lon").value); // get value of input lon and parse to float
var newFeature = [ lon, lat ] // create array "newFeature" with lon , lat
poi.push(newFeature) // add NewFeature to array "poi"
createmarker (lon,lat) // create marker for input lat, lon
document.getElementById('poi_added').innerHTML = "Added marker for " + "latitude: " + lat + "; longitude: " + lon; // visual feedback for added marker
}
document.getElementById('add_marker').addEventListener('click', addFeature); // execute function "addFeature" when button with id "add_marjer" is clicked
}
// popover coordinates markers
</script>
<style>
/*dein style*/
</style>
</head>
<body onload="init();">
<div id="wrapper" >
<div style="width: 100%; height: 80%" id="basicMap"></div>
<div class="add_markers">
<div class="input_markers">
Add new markers with coordinates in WGS84!
<div class="row">
<div class="col-25">
<label for="lat">Latitude:</label>
</div>
<div class="col-75">
<input type="text" id="lat" name="firstname" placeholder="48.060614">
</div>
</div>
<div class="row">
<div class="col-25">
<label for="lon">Longitude:</label>
</div>
<div class="col-75">
<input type="text" id="lon" name="lastname" placeholder="12.190876">
</div>
</div>
<button id="add_marker" class="button">Add marker!</button>
<div id="poi_added" class="poi_added"></div>
</div>
</div>
</div>
</div>
</div>
</body>
</html>

You want to know which Open-Source Web-GIS applications are used to share geospatial data over the Internet?
Web-GIS applications
GeoServer
GeoServer is an open source server for sharing geospatial data.
degree
deegree is an open source software for geodata infrastructures and the geospatial web.
FeatureServer
FeatureServer is an implementation of a RESTful Geographic Feature Service.
MapGuide Open Source
MapGuide Open Source is a web-based platform that enables users to develop and deploy web mapping applications and geospatial services.
MapServer
MapServer is an open-source platform for publishing geodata and interactive map applications on the web.
Javascript libraries
OpenLayers
OpenLayers is a JavaScript library that enables geospatial data to be displayed in the web browser. OpenLayers is a programming interface that allows client-side development independent of the server.
Leaflet
Leaflet is a free JavaScript library that can be used to create Web-GIS applications. The library uses HTML5, CSS3 and therefore supports most browsers.
]]>
What is OpenStreetMap?
OpenStreetMap is the largest international project that aims to create a free world map. Voluntary "mappers" collect data about roads, railways, rivers, forests and houses and make them available online.
If you also want to get involved in the OpenStreetMap project, you can find further information here: https://www.openstreetmap.de/faq.html#wie_mitmachen.
The data is freely available to all people. You can also use OpenStreetMap data commercially because it was published under the Open Data Commons Open Database License
OSM Data Formats
The data is offered by OSM as XML or PBF, which is a "compact" data format for the raw data from OpenStreetMap. The file Planet.osm contains the entire planet that has been recorded so far and the full history planet version even contains all version histories of all objects. This file is usually updated once a week.
With tools such as Osmosis or Osm2pgsql, this geodata can then be imported into a Postgis database. However, since this file is very large (76GB), most of you will probably not be able to start with it. Instead of using the file of the entire planet it is more useful to extract the part of it that you will need. You can do this on your own or use services such as Geofabrik offers them.
Download via Geofabrik
Fortunately, there are Geofabrik that process OSM files and partially also make them available free of charge.
At https://download.geofabrik.de/ you will find download links for specific regions, where you can finally download OpenStreetMap data as shapefiles. There is also a small map at the top right of the website that shows the area of the selected data.
The data can also be downloaded as .pbf or bz2 files.
With a click on a region you land in the "sub-region", in which data of individual countries can then be downloaded. In Europe, shapefiles of the OSM data can be downloaded for almost all countries.
For Germany there is unfortunately only the possibility to download shapefiles of the individual federal states.
In addition, polygons of the dimensions of the individual federal states can be downloaded.
Structure of raw OSM data
There is of course a unique ID for each object. When looking at street objects, there are so-called "other_tags" in addition to the name and type of street (residential, tertiary, secondary, unclassified, etc.).
There you will find all additional attributes that describe the object in more detail. In the case of the street, the maximum permitted speed, the maximum allowed weight, the zip code of the municipality, the material of the street and even more properties are described.
With special queries you can access these "other_tags" and, for example, only show all paved roads in QGIS.
With the usual "OSM Basemap" all these objects are rendered and displayed in the usual OpenStreetMap design.
]]>
PyQGIS is a powerful tool that enables the automation of various processes, including the seamless export of images for all layers from a map.
To start the automation, you'll need one or more layers containing raster and/or vector data.
Add layers with PyQGIS
In the initial step, if all your files reside in the same folder, you can use a "for .. in loop" to read them in. By adding .endswith(".gpkg"), for instance, you can specifically target files with the ".gpkg" extension. The layer names are then stored in an array for future reference.
import os, sys
from PyQt5.QtCore import QTimer
# path to look for files
path = "ordner/nocheinordner/"
# set path
dirs = os.listdir( path )
# array for storing layer_names
layer_list = []
# variable for further processing
count = 0
#look for files inpath
for file in dirs:
# search for ".gpkg" files
if file.endswith(".gpkg"):
#add vectorlayers
vlayer = iface.addVectorLayer(path + file, "Layername", "ogr")
layer_list.append(vlayer.name())
The newly added vector layers will then appear in the QGIS layer tree.
Image Export for Each Layer
Once you are satisfied with the display, you can use two functions to export a georeferenced image for each layer.
def prepareMap():
# make all layers invisible
iface.actionHideAllLayers().trigger()
# get layer by layer_name
layer_name = QgsProject.instance().mapLayersByName(layer_list[count])[0]
# select layer
iface.layerTreeView().setCurrentLayer(layer_name)
# set selected layer visible
iface.actionShowSelectedLayers().trigger()
# Wait a second and export the map
QTimer.singleShot(1000, exportMap)
The "prepareMap ()" function first deactivates all layers. A layer is then selected from the "layer_list" array using its layer name and then displayed again. The QTimer class is particularly important here. Before an image is created, there must always be a short wait before the selected layer is really visible. Without QTimer, the script would run so quickly that the result would be loud images with the same content. After waiting a second, the "exportMap" function is called.
def exportMap():
global count
# save current view as image
iface.mapCanvas().saveAsImage( path + layer_list[count] + ".png" )
# feedback for printed map
print('{}.png exported sucessfully'.format(layer_list[count]))
# get map for every layer in layer_list
if count < len(layer_list)-1:
# Wait a second and prepare next map (timer is needed because otherwise all images have the samec content
# the script excecutes faster then the mapCanvas can be reloaded
QTimer.singleShot(1000, prepareMap)
count += 1
Now the current map, in which only one level is shown, is saved as a PNG image in the source directory. Ultimately, you "land" in a loop that goes through all the layers that are in the "layer_list" array and calls the "prepareMap" function for each layer again.
]]>
For individuals seeking access to high-resolution satellite imagery, numerous options are available for convenient and free downloads. Explore the following key sources to download global satellite images effortlessly:
Copernicus Open Access Hub
The Copernicus Open Access Hub (Sentinels Scientific Data Hub) facilitates free and open access to Sentinel-1, Sentinel-2, and Sentinel-5P products. Sentinel data is accessible through Copernicus Data and Information Access Services (DIAS) on various platforms. Find more information on Copernicus DIAS.
GEOSS Portal
The GEOSS Portal, operated by the European Space Agency (ESA), offers a map-based online interface for downloading earth observation data globally.
Worldview - NASA
NASA Worldview provides an interactive user interface to search for high-resolution and global satellite images. Explore thematic images related to forest fires, air quality, flood monitoring, and more.
European Space Imaging
European Space Imaging is a leading provider of Very High Resolution (VHR) satellite images for Europe, North Africa, and the CIS countries.
GloVis - USGS Global Visualization Viewer
Access remote sensing data through the USGS Global Visualization Viewer (GloVis), available since 2001. The platform was redesigned in 2017 to adapt to changing Internet technologies, providing users with easy-to-use navigation tools for instant viewing and downloading of scenes.
GeoStore - Airbus Defence and Space
The GeoStore, operated by AIRBUS, allows users to order high-resolution and current satellite images.
EOWEB GeoPortal - DLR
The EOWEB GeoPortal (EGP) by DLR is a multi-mission web portal providing interactive access to the DLR earth observation database.
]]>
With AWS (and in particular the free AWS contingent) you have the option of a static website with a custom domain for a few Hosting cents a month including CDN via CloudFront and CI / CD integration.
Before I switched completely to AWS, I had a common shared hosting option that cost me around € 72 a year. With this option I had
- 250 GB SSD storage space,
- free unlimited traffic,
- 6 domains included,
- 250 GB SSD mail storage space,
- 25 MySQL databases,
- and, and, and.
On the whole, much more than I need to run my static GatsbyJS website.
So why shouldn't I only use and pay for resources that I ultimately need and also get some cloud computing experience?
Creating S3-Buckets
The basis for hosting on AWS is formed by S3 Buckets. Buckets are "containers" on the web where you can save files. In order for redirects from subdomains such as www.mxd.codes to mxd.codes to work, you need a bucket for each domain.
First of all, you create an S3 bucket for the root domain. In my case, the bucket name is the domain name mxd.codes and you select a region (for example EU (Frankfurt)). The default settings can be kept under Options, unless you want to save different versions or access protocols. So that everyone can access the website content later, remove the tick that is present by default at "Block any public access", check the bucket settings again and finally create it.
In each bucket you can or should enter a bucket policy that further defines access. To do this, click on the name of the bucket and go to "Permissions" -> "Bucket Policy".
The following guideline must then be saved for public access.
{
"Version": "2008-10-17",
"Statement": [
{
"Sid": "AllowPublicRead",
"Effect": "Allow",
"Principal": {
"AWS": "*"
},
"Action": "s3:GetObject",
"Resource": "arn:aws:s3:::mxd.codes/*"
}
]
}
"mxd.codes" has to be replace with your bucket name!
If everything was done correctly, the permissions should now look something like this:

In the bucket settings you have to activate the "hosting a static website" and specify an index document and an error document. For GatsbyJS that would be index.html and 404.html.

Now the S3 bucket for the subdomain www.mxd.codes is still missing. So create a new bucket with the name of the subdomain www.mxd.codes with public access and add the bucket policy.
In the settings for "hosting a static website" you use "redirect requests" and enter the target bucket mxd.codes and you can enter https as a protocol, because later on the content of the static website is delivered via CloudFront, which can be encrypted with SSL certificates.

The buckets are now created and correctly configured for the operation of a static website including redirect.
CloudFront Distributions
With the free AWS contingent, 50 GB of data transfer can be burned per month in Cloudflare.
With a page size of generous 4 MB, this is enough for 12,500 page views per month and should therefore be more than sufficient for a website with average traffic. So why not take a free CDN with you?
If the costs incurred after the free year should deter someone, you still have the option to switch to another CDN provider such as CloudFlare.
At CloudFront you have to create a web distribution for each bucket. As the origin domain name, a bucket can not be selected from the dropdown list, but the end point of the bucket from S3 must be copied.

In the distribution for the bucket mxd.codes, for example "mxd.codes.s3-website.eu-central-1.amazonaws.com" is specified as origin. "Origin ID" will then be filled in automatically. In "Viewer Protocol Policy" Redirect HTTP to HTTPS is selected because users should only be able to access the website via HTTPS. "Compress Objects Automatically" Yes can be selected, so that CloudFront will zip all files automatically. Under "Alternate Domain Names (CNAMES)" you have to specify the bucket for the root domain for the distribution for the root domain. For example mxd.codes
At "SSL-Certifacte" you can now create for the two domains mxd.codes and www.mxd.codes two free Amazon SSL certificate via the Certificate Manager (ACM ). To do this, add your two domains in ACM.

You can now have this validated using a DNS or email method. If you have included your domain in Route 53, you can do it more or less automatically by simply following the instructions.
Back in the CloudFront Distribution Creation you only have to specify a "Default Root Object". -> index.html If you don't do this, CloudFront always shows an "Access Denied" message in XML format when you access your domain (atleast that was my case).
Finally, the distribution must of course still be activated under "Distribution State".
First distribution finished. The same procedure now for the subdomain www.mxd.codes with the corresponding "Origin Domain Name" (Bucket end point!)
This can take up to 20 minutes (If you want to clear your CloudFront cache and have already installed AWS CLI, you can do this with the following command:
aws cloudfront create-invalidation --distribution-id DEINE_DISTRIBUTION ID --paths "/*"
In the meantime, you can create the redirects for Cloudfront in Route 53.
Route 53 DNS settings
In [Route 53]("Route 53") you need a hosted zone (= 0.50€ per month). Then A (and provided that in the CLoudFrontDistribution IPv6 is activated (which it is by default), as well as an AAAA) data record can be created.
That means you basically need 4 "alias" data sets:
- mxd.codes A "CloudFront URL for root domain"
- mxd.codes AAAA "CloudFront URL for root domain"
- www.mxd.codes A "CloudFront URL for subdomain"
- www.mxd.codes AAAA "CloudFront URL for subdomain"
Exceptionally, you can select the CDN url from the dropdown list. With "Routing Guideline" and "Assess the state of the target" you can leave the default settings, unless you want to experiment.
Now if you wait a little you should be redirect from
- http://wwww.mxd.codes,
- https://wwww.mxd.codes,
- wwww.mxd.codes,
- http://mxd.codes and
- mxd.codes to https://mxd.codes .

The difference between GIS and CAD
Understanding the fundamental disparities between Geographic information systems (GIS) and Computer-Aided Design (CAD) is crucial for anyone delving into spatial data and digital modeling. Let's explore the key differences that set these systems apart:
GIS: Unveiling the Power of Geospatial Information
Geographic information systems (GIS) serves as a comprehensive system designed for the display and processing of geodata. This includes data enriched with spatial positions, allowing for the structured presentation, representation, and analysis of complex issues. Key differentiators include:
- Local Reference Requirement: GIS data or geodata relies on a local reference for accurate spatial positioning.
- Focus on Visualization and Analysis: GIS places emphasis on the visualization, maintenance, and analysis of data, aiding in a holistic understanding of geographical information.
- Diversity in Data Formats: GIS accommodates a wide range of data formats and sources, reflecting the varied nature of geospatial information.
- Efficiency and Flexibility: GIS systems excel in efficient and flexible data management, adapting to diverse datasets seamlessly.
CAD: Precision in Digital Modeling
CAD systems, on the other hand, are geared towards the creation and graphical modeling of digital content. These systems commonly handle plans, drawings, and 3D models, prioritizing precision in representation. Key attributes of CAD systems include:
- Emphasis on Precision: CAD systems prioritize highly precise representations, facilitating the creation of components with exact specifications.
- Standard File Formats: CAD data is predominantly stored in DXF or DWG files, adhering to industry standards.
- Focused on Digital Modeling: The primary role of CAD lies in the creation and manipulation of digital models, ensuring accuracy in design and manufacturing processes.
Complementary Roles and Synergy
While GIS and CAD serve distinct purposes, they can complement each other effectively. The synergy between these systems arises from their ability to address different aspects of spatial data management. GIS excels in handling diverse geospatial information, while CAD ensures meticulous precision in digital modeling. Together, they form a powerful combination, offering a comprehensive solution for diverse applications.
In conclusion, the choice between GIS and CAD depends on the specific needs of a project. Understanding their unique features enables professionals to leverage the strengths of each system, ultimately enhancing the overall efficiency and effectiveness of spatial data utilization.
]]>
The shapefile format is a widely used standard for storing vector GIS - data. Developed by Esri, it has become an open format and a preferred choice for data transfer, compatible with major GIS software programs such as ArcGIS and QGIS.
Despite the singular name, a shapefile is a collection of three essential files: .shp, .shx, and .dbf. These files, residing in the same directory, collectively enable visualization. Additional files like .prj may contain projection information, and the entire package is often compressed in a ZIP file for easy transmission via email or download links on websites.
Key File Extensions Associated with a Shapefile
All files within a shapefile share the same name but have different formats. Three core files constitute a shapefile:
- .shp: Contains the geometry of data records.. If you want to transform coordinates for example, you only have to transform this file.
- .dbf: Stores attribute data in [dBASE](https://www.wikipedia.com/wiki/DBASE "DBASE) format.
- .shx: Links factual data (.dbf) with the geometry (.shp) through a common index.
Optional files may include .atx, .sbx, .sbn, .qix, .aih, .ain, .shp.xml, .prj, and .cpg, each serving specific functions.
- .atx: attribute index
- .sbx: and .sbn Spatial index
- .qix: Alternative spatial index (used and created by GDAL
- .aih and .ain: index for table links
- .shp.xml: metadata about the shapefile
- .prj: projection of the data
- .cpg: to specify the character set used in the .dbf.
Understanding Geometries in Shapefiles
Shapefiles store elements of a single geometry type, such as
points,
lines,
surfaces,
polygons or
multi-points
However, a data record doesn't necessitate an associated geometry; pure factual data can be stored as a shapefile.
Limitations of Shapefiles
- Shape files are relatively sluggish
- Multiple files create complexity (everyone knows the problem if you only get the .shp sent)
- Attribute names are limited to 10 characters
- Topologies can't be saved
- File size is capped at 2GB
- Only one geometry type is allowed per file
- No genuine 3D support
Exploring Alternatives to Shapefiles
For those seeking more robust options, GIS databases, like PostGIS (PostgreSQL) and GeoPackages, emerge as superior alternatives. Databases offer limitless file sizes, support various geometry types, and allow topological creations. Data can be effortlessly shared as geopackages, streamlining the transfer process into a single, convenient file. Shapefiles remain a staple, but exploring these alternatives ensures flexibility and enhanced capabilities in GIS data management.
]]>
Geodata, also known as GIS data, is information with a spatial reference utilized in Geographic Information Systems (GIS). These data play a crucial role in various applications, providing valuable insights into geographical elements.
Primary and Secondary Geodata
- Primary data: This is raw information directly acquired through measurements, such as property measurements, in its unprocessed form
- Secondary data: These are refined versions of primary data, processed through calculations, modeling, or other methods to enhance their usability.
Components of Geodata: Object Attributes and Geometries
All geodata comprise two fundamental components: object attributes and object geometries.
- Object attributes: These describe the characteristics of an object, such as a restaurants's brand, address, and reviews.
- Object geometries: These determine the object's position and shape, represented as points, lines, surfaces, or bodies. For instance, when using Google Maps to find restaurants, the object geometry is a point with specific coordinates.
Categories of Geodata
Geodata is further categorized based on its nature.
- Geospatial base data: Official and fundamental data used as a foundation for specialized and thematic maps, including topography, property data, and information from surveying administrations.
- Geo-technical data: Data from various specialties, crucial in urban planning, environmental protection, demography, and more.
Storage Formats for Geographic Information
Geographic information can be stored in various formats:
- Geodatabase: E.g. PostgreSQL.
- Shapefile: A common format for storing vector-based geospatial information.
- Raster image: A format using grids of cells to represent information.
- Table data: Tabular data storing information in rows and columns.
Acquiring Geodata: Public and Private Sources
Geodata can be obtained from both public and private providers. Public entities, like the State Office for Digitization, Broadband, and Surveying, may offer aerial photos and topographic maps with legal restrictions and varying costs.
Quality Considerations: Ensuring Fitness for Purpose
The quality of geodata is critical, depending on its application:
- Accuracy: Varies according to the object's dimensions; precision proportional to the object's size is essential.
- Logical consistency: Ensuring data consistency, for instance, avoiding negative values in population mapping.
- Temporal dimension: Acknowledging time as a critical factor, especially in historical data or analyzing population structures over time.
Conclusion: Geodata as a Decision-Making Medium
In conclusion, geodata represents real-world objects with attributes and geometries. Its primary and secondary forms are stored in various formats, serving as the backbone for GIS analysis. Understanding the quality considerations is paramount for effective decision-making in diverse fields. Geodata is not just information; it is a powerful tool for spatial analysis and decision support.
]]>Link: https://blog.gurucomputing.com.au/doing-more-with-docker/
]]>Link: https://francescoschwarz.com/articles/running-on-my-own/
]]>Link: https://mxb.dev/blog/using-webmentions-on-static-sites/
]]>


 ]]>
]]>


happyplace #mountainbike #scottspark #chasingsunsets


 ]]>
]]>
 ]]>
]]>
 ]]>
]]>
 ]]>
]]>
 ]]>
]]>
 ]]>
]]>