My Intro to Multiple Classification with Random Forests, Conditional Inference Trees, and Linear Discriminant Analysis

After the work I did for my last post, I wanted to practice doing multiple classification.  I first thought of using the famous iris dataset, but felt that was a little boring.  Ideally, I wanted to look for a practice dataset where I could successfully classify data using both categorical and numeric predictors.  Unfortunately it was tough for me to find such a dataset that was easy enough for me to understand.

The dataset I use in this post comes from a textbook called Analyzing Categorical Data by Jeffrey S Simonoff, and lends itself to basically the same kind of analysis done by blogger “Wingfeet” in his post predicting authorship of Wheel of Time books.  In this case, the dataset contains counts of stop words (function words in English, such as “as”, “also, “even”, etc.) in chapters, or scenes, from books or plays written by Jane Austen, Jack London (I’m not sure if “London” in the dataset might actually refer to another author), John Milton, and William Shakespeare. Being a textbook example, you just know there’s something worth analyzing in it!!  The following table describes the numerical breakdown of books and chapters from each author:

# Books # Chapters/Scenes
Austen 5 317
London 6 296
Milton 2 55
Shakespeare 12 173

Overall, the dataset contains 841 rows and 71 columns.  69 of those columns are the counted stop words (wow!), 1 is for what’s called the “BookID”, and the last is for the Author.  I hope that the word counts are the number of times each word shows up per 100 words, or something that makes the counts comparable between authors/books.

The first thing I did after loading up the data into R was to create a training and testing set:

> authorship$randu = runif(841, 0,1)
> authorship.train = authorship[authorship$randu < .4,]
> authorship.test = authorship[authorship$randu >= .4,]

Then I set out to try to predict authorship in the testing data set using a Random Forests model, a Conditional Inference Tree model, and a Linear Discriminant Analysis model.

Random Forests Model

Here’s the code I used to train the Random Forests model (after finding out that the word “one” seemed to not be too important for the classification):

authorship.model.rf = randomForest(Author ~ a + all + also + an + any + are + as + at + be + been + but + by + can + do + down + even + every + for. + from + had + has + have + her + his + if. + in. + into + is + it + its + may + more + must + my + no + not + now + of + on + one + only + or + our + should + so + some + such + than + that + the + their + then + there + things + this + to + up + upon + was + were + what + when + which + who + will + with + would + your, data=authorship.train, ntree=5000, mtry=15, importance=TRUE)

It seemed to me that the mtry argument shouldn’t be too low, as we are trying to discriminate between authors!  Following is a graph showing the Mean Decrease in Accuracy for each of the words in the Random Forests Model:

Discriminating Words - RF

As you can see, some of the most important words for classification in this model were “was”, “be”, “to”, “the”, “her” and “had.  At this point, I can’t help but think of the ever famous “to be, or not to be” line, and can’t help but wonder if these are the sort of words that would show up more often in Shakespeare texts.  I don’t have the original texts to re-analyze, so I can only rely on what I have in this dataset to try to answer that question.  Doing a simple average of how often the word “be” shows up per chapter per author, I see that it shows up an average of 12.9 times per scene in Shakespeare, and an average of 20.2 times per chapter in Austen!  Shakespeare doesn’t win that game!!

Anyway, the Random Forests model does pretty well in classifying authors in the test set, as you can see in the counts and proportions tables below:

> authorship.test$pred.author.rf = predict(authorship.model.rf, authorship.test, type="response")
> table(authorship.test$Author, authorship.test$pred.author.rf)
> prop.table(table(authorship.test$Author, authorship.test$pred.author.rf),1)

              Austen London Milton Shakespeare
  Austen         182      4      0           0
  London           1    179      0           1
  Milton           0      1     33           2
  Shakespeare      1      2      0         102

                   Austen      London      Milton Shakespeare
  Austen      0.978494624 0.021505376 0.000000000 0.000000000
  London      0.005524862 0.988950276 0.000000000 0.005524862
  Milton      0.000000000 0.027777778 0.916666667 0.055555556
  Shakespeare 0.009523810 0.019047619 0.000000000 0.971428571

If you look on the diagonal, you can see that the model performs pretty well across authors.  It seems to do the worst with Milton (although still pretty darned well), but I think that should be expected due to the low number of books and chapters from him.

Conditional Inference Tree

Here’s the code I used to train the Conditional Inference Tree model:

> authorship.model.ctree = ctree(Author ~ a + all + also + an + any + are + as + at + be + been + but + by + can + do + down + even + every + for. + from + had + has + have +  her + his + if. + in. + into + is + it + its + may + more + must + my + no + not + now + of + on + one + only + or + our + should + so + some + such + than + that + the + their + then + there + things + this + to + up + upon + was + were + what + when + which + who + will + with + would + your, data=authorship.train)

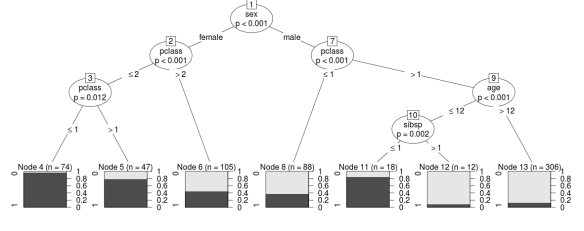
Following is the plot that shows the significant splits done by the Conditional Inference Tree:

Discriminating Words - CTree

As is painfully obvious at first glance, there are so many end nodes that seeing the different end nodes in this graph is out of the question.  Still useful however are the ovals indicating what words formed the significant splits.  Similar to the Random Forests model, we see “be” and “was” showing up as the most significant words in discriminating between authors.  Other words it splits on don’t seem to be as high up on the list in the Random Forests model, but the end goal is prediction, right?

Here is how the Conditional Inference Tree model did in predicting authorship in the test set:

> authorship.test$pred.author.ctree = predict(authorship.model.ctree, authorship.test, type="response")
> table(authorship.test$Author, authorship.test$pred.author.ctree)
> prop.table(table(authorship.test$Author, authorship.test$pred.author.ctree),1)

              Austen London Milton Shakespeare
  Austen         173      8      1           4
  London          18    148      3          12
  Milton           0      6     27           3
  Shakespeare      6     10      5          84

                   Austen      London      Milton Shakespeare
  Austen      0.930107527 0.043010753 0.005376344 0.021505376
  London      0.099447514 0.817679558 0.016574586 0.066298343
  Milton      0.000000000 0.166666667 0.750000000 0.083333333
  Shakespeare 0.057142857 0.095238095 0.047619048 0.800000000

Overall it looks like the Conditional Inference Tree model is doing a worse job predicting authorship compared with the Random Forests model (again, looking at the diagonal).  Again we see the Milton records popping up as having the lowest hit rate for classification, but I think it’s interesting/sad that only 80% of Shakespeare records were correctly classified.  Sorry old man, it looks like this model thinks you’re a little bit like Jack London, and somewhat like Jane Austen and John Milton.

Linear Discriminant Analysis

Finally we come to the real star of this particular show.  Here’s the code I used to train the model:

> authorship.model.lda = lda(Author ~ a + all + also + an + any + are + as + at + be + been + but + by + can + do + down + even + every + for. + from + had + has + have +  her + his + if. + in. + into + is + it + its + may + more + must + my + no + not + now + of + on + one + only + or + our + should + so + some + such + than + that + the + their + then + there + things + this + to + up + upon + was + were + what + when + which + who + will + with + would + your, data=authorship.train)

There’s a lot of summary information that the lda function spits out by default, so I won’t post it here, but I thought the matrix scatterplot of the records plotted along the 3 linear discriminants looked pretty great, so here it is:

linear discriminants for authorship

From this plot you can see that putting all the words in the linear discriminant model seems to have led to pretty good discrimination between authors.  However, it’s in the prediction that you see this model shine:

> authorship.test$pred.author.lda = predict(authorship.model.lda, authorship.test, type="response")
> authorship.test$pred.author.lda = predict(authorship.model.lda, authorship.test)$class
> table(authorship.test$Author, authorship.test$pred.author.lda)
> prop.table(table(authorship.test$Author, authorship.test$pred.author.lda),1)

              Austen London Milton Shakespeare
  Austen         185      1      0           0
  London           1    180      0           0
  Milton           0      0     36           0
  Shakespeare      0      0      0         105

                   Austen      London      Milton Shakespeare
  Austen      0.994623656 0.005376344 0.000000000 0.000000000
  London      0.005524862 0.994475138 0.000000000 0.000000000
  Milton      0.000000000 0.000000000 1.000000000 0.000000000
  Shakespeare 0.000000000 0.000000000 0.000000000 1.000000000

As you can see, it performed flawlessly with Milton and Shakespeare, and almost flawlessly with Austen and London.

Looking at an explanation of LDA from dtreg I’m thinking that LDA is performing best here because the discriminant functions created are more sensitive to the boundaries between authors (defined here by stop word counts) than the binary splits made on the predictor variables in the decision tree models.  Does this hold for all cases of classification where the predictor variables are numeric, or does it break down if the normality of the predictors is grossly violated?  Feel free to give me a more experienced/learned opinion in the comments!

Binary Classification – A Comparison of “Titanic” Proportions Between Logistic Regression, Random Forests, and Conditional Trees

Now that I’m on my winter break, I’ve been taking a little bit of time to read up on some modelling techniques that I’ve never used before. Two such techniques are Random Forests and Conditional Trees.  Since both can be used for classification, I decided to see how they compare against a simple binomial logistic regression (something I’ve worked with a lot) for binary classification.

The dataset I used contains records of the survival of Titanic Passengers and such information as sex, age, fare each person paid, number of parents/children aboard, number of siblings or spouses aboard, passenger class and other fields (The titanic dataset can be retrieved from a page on Vanderbilt’s website replete with lots of datasets; look for “titanic3”).

I took one part of the dataset to train my models, and another part to test them.  The factors that I focused on were passenger class, sex, age, and number of siblings/spouses aboard.

First, let’s look at the GLM:

titanic.survival.train = glm(survived ~ pclass + sex + pclass:sex + age + sibsp,
family = binomial(logit), data = titanic.train)

As you can see, I worked in an interaction effect between passenger class and sex, as passenger class showed a much bigger difference in survival rate amongst the women compared to the men (i.e. Higher class women were much more likely to survive than lower class women, whereas first class Men were more likely to survive than 2nd or 3rd class men, but not by the same margin as amongst the women).  Following is the model summary output, if you’re interested:

> summary(titantic.survival.train)

Call:
glm(formula = survived ~ pclass + sex + pclass:sex + age + sibsp, 
    family = binomial(logit), data = titanic.train)

Deviance Residuals: 
    Min       1Q   Median       3Q      Max  
-2.9342  -0.6851  -0.5481   0.5633   2.3164  

Coefficients:
                Estimate Std. Error z value Pr(>|z|)    
(Intercept)     6.556807   0.878331   7.465 8.33e-14 ***
pclass         -1.928538   0.278324  -6.929 4.24e-12 ***
sexmale        -4.905710   0.785142  -6.248 4.15e-10 ***
age            -0.036462   0.009627  -3.787 0.000152 ***
sibsp          -0.264190   0.106684  -2.476 0.013272 *  
pclass:sexmale  1.124111   0.299638   3.752 0.000176 ***
---
Signif. codes:  0 ‘***’ 0.001 ‘**’ 0.01 ‘*’ 0.05 ‘.’ 0.1 ‘ ’ 1 

(Dispersion parameter for binomial family taken to be 1)

    Null deviance: 858.22  on 649  degrees of freedom
Residual deviance: 618.29  on 644  degrees of freedom
AIC: 630.29

Number of Fisher Scoring iterations: 5

So, after I used my model to predict survival probabilities on the testing portion of the dataset, I checked to see how many records showed a probability of over .5 (or 50%), and then how many of those records were actual survivors.  For the GLM, 146/164 (89%) of those records scored at 50% or higher were actual survivors.  Not bad!

Now let’s move on to Random Forests:

> titanic.survival.train.rf = randomForest(as.factor(survived) ~ pclass + sex + age + sibsp, data=titanic.train,ntree=5000, importance=TRUE)

> titanic.survival.train.rf

Call:
 randomForest(formula = as.factor(survived) ~ pclass + sex + age +      sibsp, data = titanic.train, ntree = 5000, importance = TRUE) 
               Type of random forest: classification
                     Number of trees: 5000
No. of variables tried at each split: 2

        OOB estimate of  error rate: 22.62%
Confusion matrix:
    0   1 class.error
0 370  38  0.09313725
1 109 133  0.45041322

> importance(titanic.survival.train.rf)
               0          1 MeanDecreaseAccuracy MeanDecreaseGini
pclass  67.26795 125.166721            126.40379         34.69266
sex    160.52060 221.803515            224.89038         62.82490
age     70.35831  50.568619             92.67281         53.41834
sibsp   60.84056   3.343251             52.82503         14.01936

It seems to me that the output indicates that the Random Forests model is better at creating true negatives than true positives, with regards to survival of the passengers, but when I asked for the predicted survival categories in the testing portion of my dataset, it appeared to do a pretty decent job predicting who would survive and who wouldn’t:

For the Random Forests model, 155/184 (84%) of those records predicted to survive actually did survive!  Again, not bad.

Finally, lets move on to the Conditional Tree model:

> titanic.survival.train.ctree = ctree(as.factor(survived) ~ pclass + sex + age + sibsp, data=titanic.train)

> titanic.survival.train.ctree

	 Conditional inference tree with 7 terminal nodes

Response:  as.factor(survived) 
Inputs:  pclass, sex, age, sibsp 
Number of observations:  650 

1) sex == {female}; criterion = 1, statistic = 141.436
  2) pclass <= 2; criterion = 1, statistic = 55.831
    3) pclass <= 1; criterion = 0.988, statistic = 8.817       
     4)*  weights = 74      3) pclass > 1
      5)*  weights = 47 
  2) pclass > 2
    6)*  weights = 105 
1) sex == {male}
  7) pclass <= 1; criterion = 1, statistic = 15.095     
   8)*  weights = 88    
  7) pclass > 1
    9) age <= 12; criterion = 1, statistic = 14.851
      10) sibsp <= 1; criterion = 0.998, statistic = 12.062               11)*  weights = 18        
      10) sibsp > 1
       12)*  weights = 12 
    9) age > 12
      13)*  weights = 306

Titanic Conditional Tree

I really happen to like the graph output by plotting the conditional tree model.  I find it pretty easy to understand.  As you can see, the model started the split of the data according to sex, which it found to be most significant, then pclass, age, and then siblings/spouses.  That being said, let’s look at how the prediction went for comparison purposes:

134/142 (94%) of records predicted to survive actually did survive!  Great!!  Now let’s bring all those prediction stats into one table for a final look:

                     glm randomForests ctree
Actually Survived    146           155   134
Predicted to Survive 164           184   142
% Survived           89%           84%   94%

So, in terms of finding the highest raw number of folks who actually did survive, the Random Forests model won, but in terms of having the highest true positive rate, the Conditional Tree model takes the cake!  Neat exercise!

Notes:

(1) There were numerous records without an age value.  I estimated ages using a regression model taken from those who did have ages.  Following are the coefficients for that model:

44.59238 + (-5.98582*pclass) + (.15971*fare) + (-.14141*pclass:fare)

(2) Although I used GLM scores of over .5 to classify records as survived, I could have played with that to get different results.  I really just wanted to have some fun, and not try all possibilities here:)

(3) I hope you enjoyed this post!  If you have anything to teach me about Random Forests or Conditional Trees, please leave a comment and be nice (I’m trying to expand my analysis skills here!!).

EDIT:
I realized that I should also post the false negative rate for each model, because it’s important to know how many people each model missed coding as survived. So, here are the stats:

                           glm    rf ctree   gbm
Actually Survived          112   103   124    74
Predicted Not to Survive   495   475   517   429
False Negative Rate      22.6% 21.7%   24% 17.2%

As you can see, the gbm model shows the lowest false negative rate, which is pretty nice! Compare that against the finding that it correctly predicted the survival of 184/230 (80%) records that were scored with a probability of 50% or higher, and that makes a pretty decent model.

My Goodness. What a Fat Dataset!

Recently at work we got sent a data file containing information on donations to a specific charitable organization, ranging all the way back to the 80’s.  Usually, when we receive a dataset with a donation history in it, each row represents a specific gift from a specific person at a specific time.  Also, each column represents some kind of information about that gift.  The result is usually a dataset which is fairly long (thousands or hundreds of thousands, in my recent experience) with maybe about 15 columns or more.

In this case, each row represented one person, but there were 1,551 columns!!  As it turned out, after the first column, which was the ID of the person donating the money, there were supposed to be just 31 extra columns to describe the gift in each row.  However, the person who put the data together decided that we should get 31*50 columns so that each row represented a person, and not a gift, and every subsequent gift from that person was represented by an extra 31 columns to the right of the previous 31.  Ridiculous!!

Anyway, I knew that I could reshape this using R, by stacking all 50 copies of the same variable together, and making sure that each new resultant 31 vectors should just take the names of the first 31 vectors.  Following is a gist that shows what eventually worked for me:


# Here's where I extract the database IDs and repeat them 50 times to make the column long enough for
# my new long-form dataset (596,100 rows)
client.data.new = rep(client.data[,1],50)
for (i in 2:32){
# for each column in the first 31 after the ID column, find the 49 matching columns
# to the right and stack them using melt
stacked.data = melt(client.data, id.vars="CnBio_ID", measure.vars=seq(i,(i+(31*49)),31), value.name=names(client.data)[i])
# Once we have one new stacked column, we add it on to the right of whatever has already been built in the
# new long-form dataset.
client.data.new = data.frame(client.data.new, stacked.data[,3])
}
# I don't know why the "value.name" argument didn't give me the right variable names for my
# new long-form dataset, but it was easy enough to use this last line of code to fix that!
names(client.data.new) = names(client.data)[1:32]

In conclusion, if you need your dataset to get in shape, you need only remember one letter: R!

Know Your Dataset: Specifying colClasses to load up an ffdf

When I finally figured out how to successfully use the ff package to load data into R, I was apparently working with relatively pain free data to load up through read.csv.ffdf (see my previous post).  Just this past Sunday, I naively followed my own post to load a completely new dataset (over 400,000 rows and about 180 columns) for analysis.  Unfortunately for me, the data file was a bit messier, and so read.csv.ffdf wasn’t able to finalize the column classes by itself.  It would chug along until certain columns in my dataset, which it at first took to be one data type, proved to be a different data type, and then it would give me an error message basically telling me it didn’t want to adapt to the changing assumptions of which data type each column represented.

So, I set out to learn how I could use the colClasses argument in the read.csv.ffdf command to manually set the data types for each column.  I adapted the following solution from a stackoverflow thread about specifying colClasses in the regular read.csv function.

First, load up a sample of the big dataset using the read.csv command (The following is obviously non-random. If you can figure out how to read the sample in randomly, I think it would work much better):

headset = read.csv(fname, header = TRUE, nrows = 5000)

The next command generates a list of all the variable names in your dataset, and the classes R was able to derive based on the number of rows you imported:

headclasses = sapply(headset, class)

Now comes the fairly manual part. Look at the list of variables and classes (data types) that you generated, and look for obvious mismatches. Examples could be a numeric variable that got coded as a factor or logical, or a factor that got coded as a numeric. When you find such a mismatch, the following syntax suffices for changing a class one at a time:

headclasses["variable.name"] = "numeric"

Obviously, the “variable.name” should be replaced by the actual variable name you’re reclassifying, and the “numeric” string can also be “factor”, “ordered”, “Date”, “POSIXct” (the last two being date/time data types). Finally, let’s say you want to change every variable that got coded as “logical” into “numeric”. Here’s some syntax you can use:

headclasses[grep("logical", headclasses)] = "numeric"

Once you are certain that all the classes represented in the list you just generated and modified are accurate to the dataset, you can load up the data with confidence, using the headclasses list:

bigdataset = read.csv.ffdf(file="C:/big/data/loc.csv", first.rows=5000, colClasses=headclasses)

This was certainly not easy, but I must say that I seem to be willing to jump through many hoops for R!!

A function to find the “Penultimax”

Penulti-what?  Let me explain: Today I had to iteratively go through each row of a donor history dataset and compare a donor’s maximum yearly donation total to the second highest yearly donation total.  In even more concrete terms, for each row I had to compare the maximum value across 5 columns against the next highest number.  This seemed to be a rather unique task, and so I had to make an R function to help carry it out.

So, I named the function “penultimax”, to honour the idea that it’s finding the second highest, or second max.  It works pretty simply, really just by removing the maximum value from the input vector, and returning the maximum of the new vector, if it’s there at all.  Following is the code for it (notice that it draws on an earlier function that I made, called safe.max, that returns an NA when it can’t find a maximum, instead of an error):


penultimax = function(invector) {
# If the vector starts off as only having 1 or 0 numbers, return NA
if (length(invector) <= 1) {
return(NA)
}
first.max = safe.max(invector)
#Once we get the max, take it out of the vector and make newvector
newvector = invector[!invector == first.max]
#If newvector now has nothing in it, return NA
if (length(newvector) == 0) {
return(NA)
}
#Now we get the second highest number in the vector.
#So long as it's there, we return that second highest number (the penultimax)
#or else we just return NA
second.max = safe.max(newvector)
if (is.na(first.max) & is.na(second.max)) {
return (NA) }
else if (!is.na(first.max) & is.na(second.max)) {
return (NA) }
else if (!is.na(first.max) & !is.na(second.max)) {
return (second.max)}
}
safe.max = function(invector) {
na.pct = sum(is.na(invector))/length(invector)
if (na.pct == 1) {
return(NA) }
else {
return(max(invector,na.rm=TRUE))
}
}

view raw

penultimax.r

hosted with ❤ by GitHub

Did I miss something out there that’s simpler than what I wrote?

Big data analysis, for free, in R (or “How I learned to load, manipulate, and save data using the ff package”)

Before choosing to support the purchase of Statistica at my workplace, I came across the ff package as an option for working with really big datasets (with special attention paid to ff dataframes, or ffdf). It looked like a good option to use, allowing dataframes with multiple data types and way more rows than if I were loading such a dataset into RAM as is normal with R. The one big problem I had is that every time I tried to use the ffsave function to save my work from one R session to the next, it told me that it could not find an external zip utility on my Windows machine. I guess because I just had so much else going on, I didn’t have the patience to do the research to find a solution to this problem.

This weekend I finally found some time to revisit this problem, and managed to find a solution! From what I can tell, R appears to expect, in cases like the ffsave function, that you have command-line utilities like a zip utility at the ready and recognizable by R. Although I haven’t tested the ff package on either of my linux laptops at home, I suspect that R recognizes the utilities that come pre-installed on them. However, in the windows case, the solution seems to be to install a supplementary group of command-line programs called Rtools.  When you visit the page, be sure to download the version of Rtools that corresponds with your R version.

When you go through the installation process, you will see a screen like below. Be sure that you check the same boxes as in the screenshot below so that R knows where the zip utility lives.

Once you have it installed, that’s when the fun finally begins. Like in the smaller data case, I like reading in CSV files. So, ff provides read.csv.ffdf for importing external data into R. Let’s say that you have a data file named bigdata.csv, here would be a command for loading it up:

bigdata = read.csv.ffdf(file=”c:/fileloc/bigdata.csv”, first.rows=5000, colClasses=NA)

The first part of the command, directing R to your file, should look straightforward. The first.rows argument tells it how big you want the first chunk of data it reads in should be (ff reads parts of your data at a time to save RAM.  Correct me if I’m wrong).  Finally, and importantly, the colClasses=NA argument tells R not to assume the data types of each of your columns from the first chunk alone.

Now that you’ve loaded your big dataset, you can manipulate it at will.  If you look at the ff and ffbase documentation, a lot of the standard R functions for working with and summarizing data have been optimized for use with ff dataframes and vectors.  The upshot of this is that working with data stored in ffdf format seems to be a pretty similar experience compared to working with normal data frames.  Importantly, when you want to subset your data frame to create a test sample, the ffbase package replaces the subset command so that the resultant subset is also an ffdf, and doesn’t take up more of your RAM.

I noticed that you can use the glm() and lm() functions on an ffdf, but I think you have to be careful because they are not optimized for use with ffdfs and therefore will take up the usual amount of memory if you save them to your workspace.  So if you build models using these functions, be sure to select a sample from your ffdf that isn’t overly big!

Next, comes the step of saving your work.  The syntax is simple enough:

ffsave(bigdata, file=”C:/fileloc/Rwork/bigdata”)

This saves a .ffData file and a .RData file to the directory of your choice with “bigdata” as the filenames.

Then, when you want to load up your data in a new R session during some later time, you use the simple ffload command:

ffload(file=”C:/fileloc/Rwork/bigdata”)

It gives you some warning messages, but as far as I can tell they do not get in the way of accessing your data.  That covers the basics of working with big data using the ff package.    Have fun analyzing your data using less RAM! 🙂

A Return to Reliable R

The saga with Statistica continues:

Statistica kept crashing on me while doing my data processing.  One of the big problems was a wonderful bug that occurred when some of my text data variables were coded (unsurprisingly) as text!  Under this condition, I would only be able to add a certain small number of extra variables when I needed to make them, and then after that, any extra variable that I tried to add would crash the program!

I was told that this is a known bug in Statistica and they’re hoping to fix it with an update coming around by the end of the year.  In the meanwhile, a workaround is to go into the “Variable Specs” for any variable coded as Text and recode it as “Double”, save the worksheet, then try again.  That seemed to get rid of the crashing, but then my biographical ID column that held all the original database IDs for the individuals in my dataset got messed up.  Numerous IDs, which were previously unique, became spontaneously reassigned to more than one person.  I can’t have that because once I’m done with the dataset, I have to return important parts of it back to the clients I work with so they can put certain new columns into their database.  So it was a bit of a catch 22.

My supervisor advised me to make a new, strictly numeric, ID column outside of Statistica, and import only the new ID column, and not the old one, back into the program.  I did that, and all seemed well until finally it crashed, yet again!  This time, I had no clue whatsoever why the crash happened.

That’s when I told myself “screw it, I’m wasting time in Statistica and am going to do the rest of this analysis in R”.  Man, is it ever nice to be back in R.  Ironically, things are much more simple and flow a lot faster for me.  The only problem is that I have a few projects coming up soon that really need a data analysis program that can handle humongous data sets.  For that reason, I’m probably going to have to see if reinstalling Statistica makes it more reliable to work with.  If not, I suppose I’ll have to move on to other options!

Processing Data from a Statistica Worksheet Using R

Context: I work with data from non-profit organizations, and so a big concern in many of my analyses is if and how much people are donating from one year to the next.  One of the  things I normally like to do in my analyses is get a value for each person that represents how much their yearly donations are increasing or decreasing on average for 5 years (a simple slope from the regression of their giving values on the years that they gave).  It was pretty simple and quick to do this in R for previous projects, so there was no hassle there.  Now that we have Statistica in the office, my supervisor wants me to use it for our current project.

Problem: I was looking for a way in Statistica of doing the above slope calculation for each row in a dataset of roughly 82,000 rows, and could not find it.

Solution:  As I mentioned in my last post, it’s possible to feed your Statistica dataset into R using the Statconn Dcom server, so that you can process it/analyze it in R and then output your results back into Statistica.  So, I fed my dataset of 82,000 rows and 264 columns into R, and used some code I had used previously to calculate 5 year giving slopes for each row in the data set, and to output a new worksheet with the newly calculated slopes column.  Although the code is pretty simple, the entire process seemed to take about 5 minutes, which was unbearably slow!!  It’s a pretty important part of my analysis, so going without it isn’t an option.

I sent an email to one of the Statistica support guys, so hopefully they have a way of doing this kind of data processing natively, instead of having to wait all that time for the data to be processed through R.

Using R from Inside Statistica

I’ve been spending a lot of time in the last month or so doing projects at work not statistics related, hence the lack of posts!  In the interim, I had to do some serious research on handling datasets bigger than the last one I worked with (the one that kept threatening to max out my 8 gigs of RAM!).  I kept trying to practice working with R packages like bigmemory and ffdf, but nothing was completely satisfying my need to be able to handle a big dataset with different data types in different columns.  So, after reading up on different commercial stats packages, I determined that getting Statistica would be best for my supervisor and I (she’s insanely busy and wouldn’t have the time for the learning curve to learn Revolution R, if we were to buy that).

In speaking with my supervisor about Statistica, she mentioned that it can interface with R.  So once we got our copies of Version 11 Advanced, I went ahead and learned how the interface works.

Setup/Installation: The setup and installation of the R integration was really annoying.  There is a COM server application you have to download and install.  You have to make sure you run the installation in administrator mode.  Then you have to make sure that R is installed using administrator mode.  You have to make sure you get the rscproxy package in R and that it is installed in the R Home directory that sits in your program files folder.  It was quite a hassle.  Statistica put a white paper on their website explaining the process.

Memory Usage:  When you actively use the R integration in Statistica, take a look at your memory usage (I’m using a windows 7 computer for work).  What you will notice is that any time you run an R function in statistica, the R connector program starts taking up more and more memory, representing the fact that data is being passed from Statistica to R to be processed.  The upshot of this is that you should probably be careful how much data you’re passing to an R procedure from Statistica so that you don’t max out your memory.

Syntax: Check out the screenshot below.  Typing in R syntax into Statistica is, thankfully, pretty easy.  As you can see in the screenshot, if you want to access the active dataset to do something with it, you treat it as a dataframe labelled ActiveDataSet, and then you can use the $ sign and type the variable name of your statistica dataset like you would with R.  The only catch seems to be variables with spaces in them.  So for those variables it seems that you have to resort to referring to them by their column numbers, instead of name.

Functionality: So far, it looks like data only flows from the Statistica spreadsheet, to R, back to the Statistica report output, or a new Statistica spreadsheet.  It would be nice if I could modify data from R within a spreadsheet, but that seems to be out of the question.

Main advantage: Being a commercial product, the good folks at Statsoft aren’t just going to give you the product with all of the statistical procedures they came up with for free.  For example, since I now have Statistica Advanced, it does allow me to do some cool multivariate procedures, but I can’t generate random forests unless I get Statistica Data Miner.  The advantage that the R integration brings then, is allowing me to have advanced statistical procedures, like Random Forests, or even graphing abilities like ggplot2, without having to pay extra.  I show an example of having used a random forest procedure in Statistica using R in the screenshot above.

ggplot2: Creating a custom plot with two different geoms

This past week for work I had to create some plots to show the max, min, and median of a measure across the levels of a qualitative variable, and show the max and min of the same variable within a subgroup of the dataset.  To illustrate what I mean, I took a fun dataset from the data and story library and recreated the plot that I made at work.
The data are supposed to represent the results of a study done on how long it took subjects to complete a pen and paper maze while they were either smelling a floral scent or not.  Other than the time to completion (the main variable of interest), some other variables are recorded, like sex and whether or not the subject is a smoker.
 I represent the min, max, and median completion time that it took men and women to complete the maze with the “crossbar” geom, which show obvious overlap in performance across the genders (however it’s apparent that men were a bit more variable in their performance than women).  The seemingly interesting result is represented by the dots.  The dots show the min and max values for the smokers within each gender.  While smoking doesn’t appear to have an effect on performance amongst the women, it seems to be correlated with much slower performance amongst the men in the study.  Then again, I just re-checked the data, which show that there are only 2 male smokers and 6 female smokers, so the comparison seems pretty unreliable.
Stepping away from the study itself, what I like here is that you can call up several geoms in the same plot, passing different data subsets to each geom.  It allows for useful customization so that you can tackle problems that aren’t so cut and dried.
Finally, I realize that before putting this kind of graph into a report, I really should create a little legend that shows the reader that the ends of the boxes are max and mins, and the middle lines represent medians, and the dots represent max and mins of the subset.
Following is the code and the plot I created:


scents = read.table("clipboard",header=TRUE,sep="\t")
strial3.by.sex.wide = ddply(scents, 'Sex', function (x) quantile(x$S.Trial.3, c(0,.5,1), na.rm=TRUE))
strial3.by.sex.smokers = melt(ddply(subset(scents,Smoker == "Y") , 'Sex', function (x) quantile(x$S.Trial.3, c(0,1), na.rm=TRUE)),variable.name="Percentile",value.name="Time")
ggplot() + geom_crossbar(data=strial3.by.sex.wide, aes(x=Sex, y=strial3.by.sex.wide$"50%", ymin=strial3.by.sex.wide$"0%", ymax=strial3.by.sex.wide$"100%"),fill="#bcc927",width=.75) +
geom_point(data=strial3.by.sex.smokers, aes(x=Sex, y=Time, stat="identity"), size=3)
+ opts(legend.title = theme_text(size=10, face="bold"), legend.text = theme_text(size=10),
axis.text.x=theme_text(size=10), axis.text.y=theme_text(size=10,hjust=1), axis.title.x=theme_text(size=12,face="bold"), axis.title.y=theme_text(size=12, angle=90,
face="bold")) + scale_y_continuous(name="Time to Completion")