If you’ve ever gone down the rabbit hole of ricing your Linux desktop, you know how deep it can get — endless config files, CSS tweaks, and theming layers that never quite fit together. But lately, one project has completely changed how I approach desktop customization: DankMaterialShell.
DMS instantly grabbed my attention when its author first posted it on Reddit’s r/unixporn. I remember literally rejoicing — I had been waiting for someone to make a quickshell-based configuration for Niri, and DMS was exactly that.
Now, after months of using it daily, I can confidently say: this project delivers one of the best desktop experiences you can get on Wayland.
]]>
If you’ve ever gone down the rabbit hole of ricing your Linux desktop, you know how deep it can get — endless config files, CSS tweaks, and theming layers that never quite fit together. But lately, one project has completely changed how I approach desktop customization: DankMaterialShell.
DMS instantly grabbed my attention when its author first posted it on Reddit’s r/unixporn. I remember literally rejoicing — I had been waiting for someone to make a quickshell-based configuration for Niri, and DMS was exactly that.
Now, after months of using it daily, I can confidently say: this project delivers one of the best desktop experiences you can get on Wayland.
What Is DankMaterialShell?
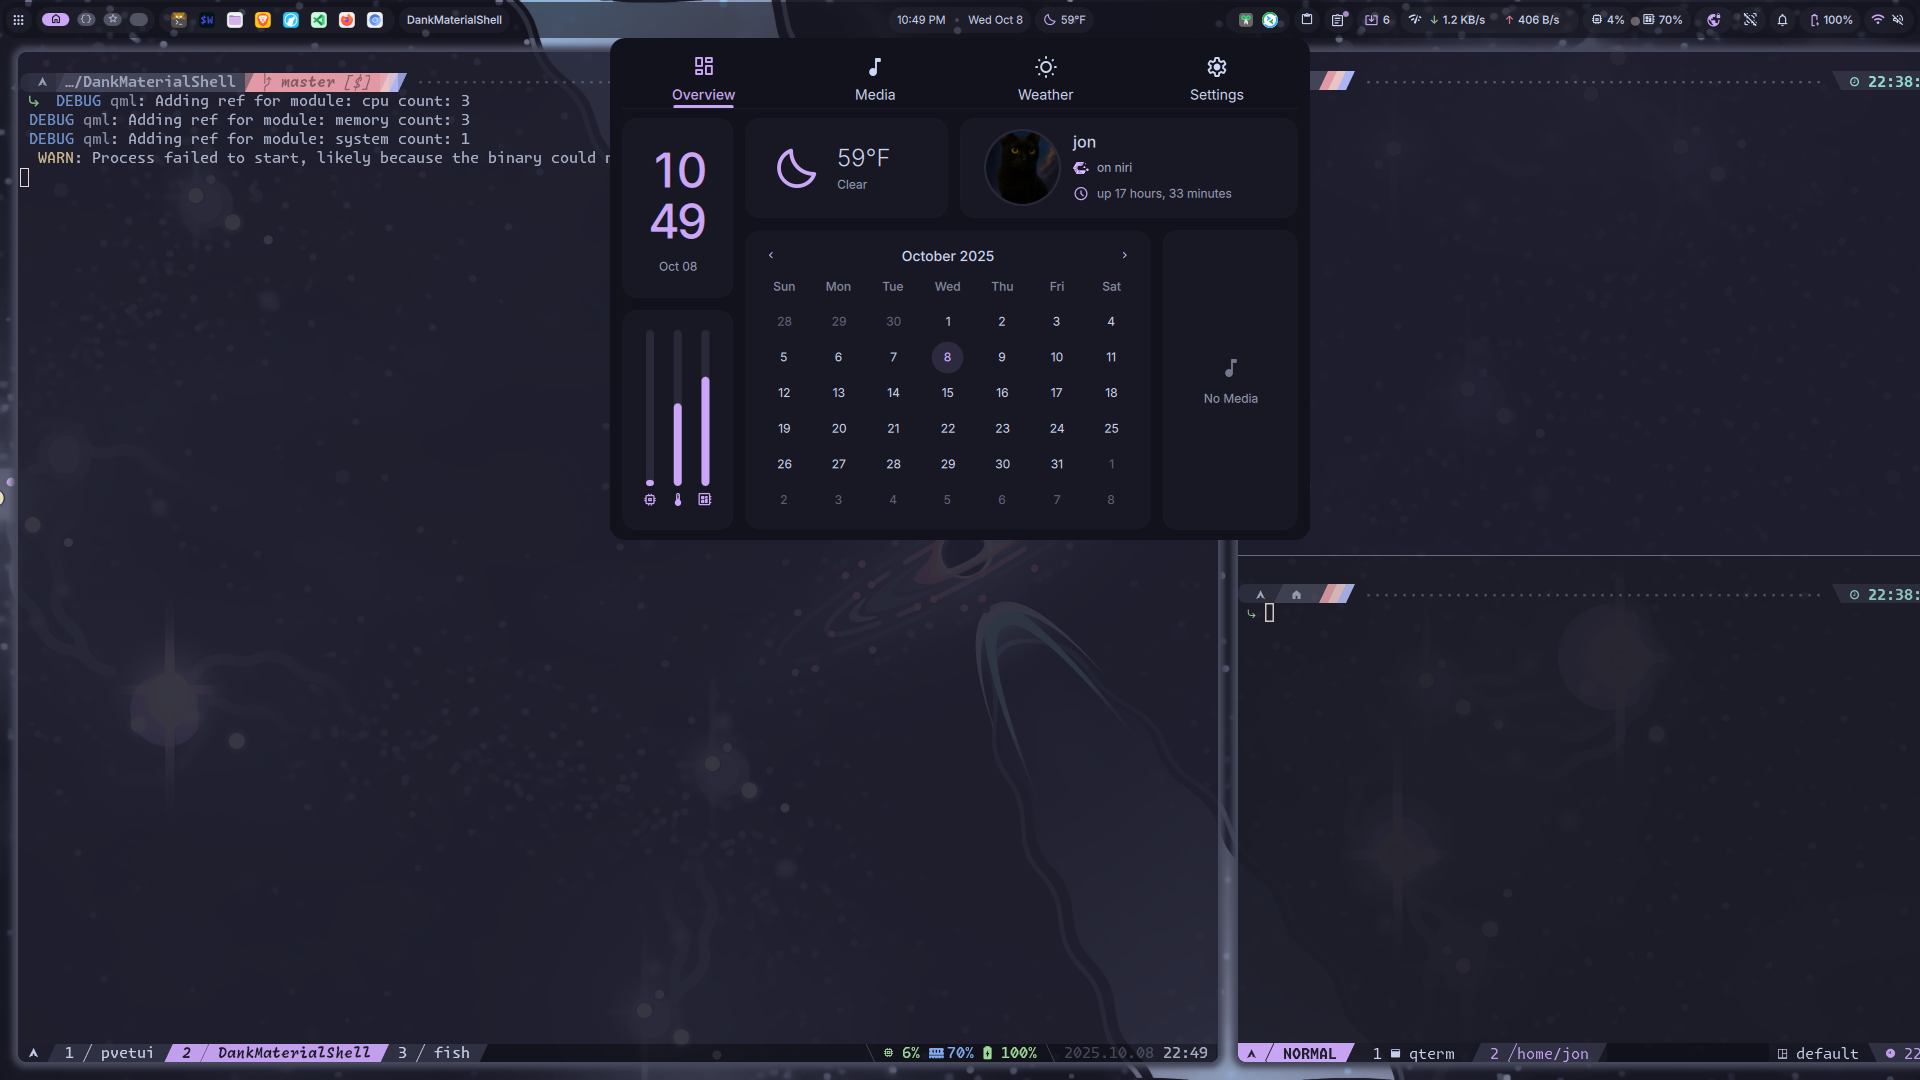
DankMaterialShell is a quickshell-based desktop shell built for both Niri and Hyprland. It provides a polished Material-inspired interface — complete with panels, widgets, and automatic theming — while keeping things lightweight and easy to customize.
It runs beautifully across modern Linux distributions: Arch (CachyOS, EndeavourOS), Fedora, NixOS, and more. You don’t need to be running a specific ecosystem; if you’re on a modern Wayland stack, you’re good to go.
My Setup and First Impressions
I’ve been using DMS since very early on, running it exclusively on my daily driver laptop — CachyOS + Niri — and it has completely transformed how my desktop feels.
My NixOS laptop (a spare I use for testing) currently runs Hyprland with Hyprpanel, but DMS is next on the list for that machine. The integration with Hyprland has matured a lot recently, and I’m curious to see how it stacks up compared to my Niri setup.


From Fork to First-Class Support
When I first started using DMS, I actually maintained a personal fork to bring in my favorite Catppuccin color scheme. At the time, it wasn’t built in — but now, not only does DMS include Catppuccin support, it also supports custom themes out of the box.
Even better, DMS integrates with Matugen for automatic wallpaper-based theming — your entire desktop dynamically adapts its colors to match your wallpaper. It’s seamless, elegant, and brings that Android-like Material You vibe to Linux in the best way.


My Contribution: The VPN Widget
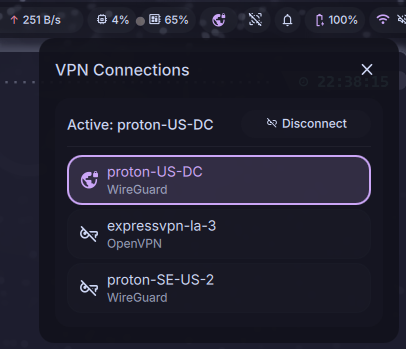
I’ve been fortunate to contribute to the project as well. I developed the VPN widget functionality, which is now part of the main branch of DankMaterialShell.
It integrates directly into the panel, letting you view and toggle VPN connections at a glance. The widget relies on NetworkManager, which is already a core dependency of DMS, so it fits naturally into the ecosystem — no custom scripts or exotic backends required.
The Plugin System: Endless Potential
One of the most exciting recent additions is the new plugin system. This opens the door to limitless extensibility — from new widgets and notifications to external service integrations.
If you enjoy extending your desktop experience, this system means you can finally build custom modules without hacking core files. It’s a huge step forward for both maintainability and creativity.
Why I Love DankMaterialShell
A few things that make DMS special:
-
🎨 Material-Inspired Design – Beautiful, minimal, and cohesive right out of the box.
- 🧰 Built-in Tools – Clipboard history, Application Launcher, Notepad, System Monitors, Notification Manager
- 🌈 Matugen Wallpaper Integration – Automatically theme your entire desktop based on wallpaper colors.
- 🧩 Modular Widgets – Network, VPN, weather, media, battery, notifications — all cleanly organized.
- 🔌 Plugin System – Expand functionality infinitely without touching the base code.
- ⚙️ Custom & Catppuccin Themes – Easy to tweak, elegant defaults, and full color control.
- ⚡ Cross-Distro Compatibility – Works great on Arch, Fedora, NixOS, and most modern Linux distros.
- 🧠 Built on Quickshell – Lightweight, efficient, and purpose-built for Wayland compositors.
Why It Matters
DankMaterialShell is more than just eye candy — it’s a cohesive design system that unifies the Wayland desktop experience. It manages to strike the balance between beauty, performance, and simplicity — something few projects pull off this well.
Whether you’re a ricer, a minimalist, or just someone who wants their Linux desktop to feel modern, DMS is worth a look. You can go from a blank compositor to a refined, elegant desktop in minutes.
Final Thoughts
DankMaterialShell has grown into one of my favorite open-source desktop projects. It’s easy to install, deeply customizable, and just plain fun to use.
Massive credit to the author and community for continually pushing it forward — from built-in theming and plugins to the Matugen integration, it’s evolving fast.
If you’ve ever wanted the polish of a full desktop environment without the bloat, this is it.
🔗 Useful Links
-
Project Repository: github.com/AvengeMedia/DankMaterialShell
-
Quickshell: github.com/quickshell
-
Niri: github.com/YaLTeR/niri
-
Hyprland: github.com/hyprwm/Hyprland
-
Matugen: github.com/InioX/matugen
That’s where pvetui comes in. It’s a Terminal User Interface (TUI) for Proxmox VE designed to give you quick access to clusters, nodes, VMs, and containers — all without leaving your terminal.
]]>That’s where pvetui comes in. It’s a Terminal User Interface (TUI) for Proxmox VE designed to give you quick access to clusters, nodes, VMs, and containers — all without leaving your terminal.
🚀 Key Features
-
Lightning Fast – Caching ensures snappy performance
-
Complete Management – Control VMs, containers, nodes, and clusters
-
Multi-Profile Support – Easily switch between multiple Proxmox connections
-
Automatic Migration – Old configs migrate seamlessly into new profile format
-
Secure Authentication – Works with API tokens or passwords, with auto-renewal
-
Integrated Shells – SSH directly into nodes, VMs, and containers
-
VNC Console Access – Embedded noVNC client with seamless auth
-
Community Scripts – Install popular Proxmox community scripts right from the TUI
-
Modern Interface – Vim-style navigation with customizable key bindings
-
Flexible Theming – Automatically adapts to your terminal color scheme
-
Extensive Documentation – Guides for config, theming, and development
📸 Screenshots


👉 See the full screenshot gallery
📦 Installation
Pre-compiled Binaries
-
Download from Releases
-
Extract and run:
./pvetui
macOS users may see Gatekeeper warnings with binaries. See the Troubleshooting Guide for solutions.
From Source
git clone --recurse-submodules https://github.com/devnullvoid/pvetui.git
cd pvetui
make install      # Build and install
# or:
make install-go   # Install via Go toolchain
⚠️ Note: go install github.com/devnullvoid/pvetui/cmd/pvetui@latest does not work (missing submodules for noVNC). Use the source install method.
🔧 Configuration
-
On first run, an interactive wizard helps you set up profiles
-
Supports multiple Proxmox connections with profile switching
-
Compatible with SOPS-encrypted configs
-
API token setup is recommended (simpler and more secure than passwords)
Example config (~/.config/pvetui/config.yml):
profiles:
  default:
    addr: "https://your-proxmox-host:8006"
    user: "root"
    realm: "pam"
    token_id: "mytoken"
    token_secret: "YOUR_SECRET"
    ssh_user: "your-ssh-user"
default_profile: "default"
👉 See Configuration Docs for details.
🔌 Usage
Run with the default config:
./pvetui
Or specify a custom profile/config:
./pvetui --profile work --config /path/to/config.yml
Common Flags
-
-c, --config– Path to config file -
-p, --profile– Use specific connection profile -
-w, --config-wizard– Launch config wizard -
-n, --no-cache– Disable caching -
-v, --version– Show version info
Key Bindings
-
h j k l– Navigate -
s– SSH shell -
v– VNC console -
g– Global menu -
/– Search -
q– Quit
👉 All key bindings are customizable.
🎨 Theming
-
Automatic adaptation to your terminal’s color scheme
-
Built-in themes with semantic highlighting
-
Full customization via
key_bindingsandthemingoptions
See Theming Docs .
📺 VNC Console Access
-
Zero-config embedded noVNC client
-
Automatic authentication
-
Works with VMs, containers, and node shells
-
Secure local WebSocket proxy
⚠️ Node VNC shells still require password auth (Proxmox limitation). Ensure VNC ports are accessible.
🤝 Contributing
-
Report issues on GitHub Issues
-
Submit pull requests (code, docs, testing)
-
Star ⭐ the repo to support development
📝 License & Disclaimer
-
Licensed under the MIT License
-
Proxmox® is a registered trademark of Proxmox Server Solutions GmbH
-
This project is not affiliated with or endorsed by Proxmox Server Solutions GmbH
Conclusion
If you love Proxmox but want something faster than the browser and friendlier than memorizing CLI commands, give pvetui a try.
It’s a modern, fast, terminal-native interface for day-to-day Proxmox management — built for admins who live in the shell.
]]>
I've recently started using Obsidian Notes as a part of my daily workflow and I have to say, it's wonderful. For the unitiated: Obsidian Notes is a personal knowledge base solution that uses local plain-text Markdown files. So, basically, it's a very advanced Markdown editor, with tons of features...and its free. I had long been searching for such a product. I've tried many: EverNote, OneNote, Google Keep, Notion, Joplin and a few others. None quite met my needs: support for Markdown syntax, synchronization, mobile apps, encryption, extensibility through themes/plugins. Joplin came very close. I had been using it most recently until I decided to take the plunge and try Obsidian. I haven't looked back.
On top of those things, Obsidian has some killer features that set it apart from the rest, namely Graph View and Backlinks. Per the Obsidian docs, Graph view lets you visualize the relationships between the notes in your vault. This goes hand-in-hand with Backlinks, which can be used to find notes that reference the note your writing. This allows you to create links to notes that don't even exist yet, allowing you to write freely without worrying about structure or hierarchy. It's an amazing concept once you start to work with it.
Workflow
For my current workflow, I use the built-in Daily Notes plugin with a template to automatically create a new note every day when I get into work. Then, I make use of Beeftext combos to create a log of my day, complete with backlinks to specific items, like Users, Clients and Computers. I'll try to explain with pictures:


Pictured above, we have the Editing View and Reading View of the Obsidian note editor. The editing view shows the Markdown syntax w/ live preview turned on. I currently work in tech support and my workflow looks like this: When I receive a call, I run my Beeftext combo .nc to insert a snippet with the current time and various fields for me to fill in as I gather information from the user. Since I create backlinks to the user, client and computer, I can add specific notes about those items at any time. For example: say a user has an accessibility need -- I ctrl+click the backlink and a new note is generated for that user in which I can make note of that need. Also, once a backlink is created, Obsidian will auto-complete them in the future, even if the note file doesn't exist yet! Then we can use the Graph View to see a map of all the relationships between the notes and backlinks:

Sync Options
While Obsidian is free, the official sync feature will cost you $10/mo or $96/yr. But, there are free alternatives! Since Obsidian uses plain-text files that you control, you could always keep your Obsidian vault in something like Dropbox or Google Drive. You could also use Syncthing (a great tool, btw) or Git. But thanks to the Obsidian Community, there's an even better option: Self-hosted LiveSync. This community plugin works inside the Obsidian app, across all platforms (including mobile). You've just gotta have somewhere to host the database. Since self-hosting is a passion of mine, this was a no-brainer. The author of the plugin provides instructions for two server installation methods: using IBM Cloudant or with your own CouchDB server.
Self-Hosting Obsidian LiveSync
I love self-hosting. I've been doing it ever since I built my first Linux server back in the early 2000s, but that's a story for another time. Docker has made self-hosting extremely simple these past few years. The author of the LiveSync plugin provides instructions for using Docker Compose to run the CouchDB service. I initially got this running on one of my free Oracle Cloud nodes, but I've since adapted it for use in my homelab's Docker Swarm setup. Either way, it's pretty straightforward and it's been working quite well! See below for screenshots of the LiveSync plugin's configuration pages in Obsidian and the Web UI of the CouchDB instance showing notes that have been sync'ed:


Closing
Thanks to Obsidian, I really feel like I have a second brain. And with Self-hosted LiveSync, it's got built-in synchronization on all platforms, for free! I look forward to expanding my personal knowledgebase and seeing the graph view come a year from now! Don't let the Markdown requirement be a barrier to entry. It's very simple to use and once you start, you won't want to stop! Got any feedback about your note-taking experience? Let me know in the comments!
]]>What's a text expander?
A text expander is basically what it sounds like. It takes a short keyword and expands it into a full word, sentance, paragraph...anything! The epyonmous TextExpander is a great example of one such product. TextExpander, however, is not free. While it's got some great features, I believe these free alternatives are just as useful for your average needs.
Beeftext
Beeftext is Windows-only. It's got a simple GUI and its easy to get started with. However, that doesn't mean it's not powerful. You can create some pretty advanced combos (snippets) thanks to Beeftext's variable substitutions. For example, I needed a way to automatically insert the word morning, afternoon or evening depending on the time of day. Beeftext has a variable type that calls a powershell script, then inserts the script's output into your snippet. So I whipped up a quick powershell one-liner to do just that. I passed that script to Beeftext et voila! Now I have a quick way to insert "Good <morning/afternoon/evening>," into my correspondance. There's a whole lot more that you can do with Beeftext, so check out the Beeftext wiki for complete documentation.


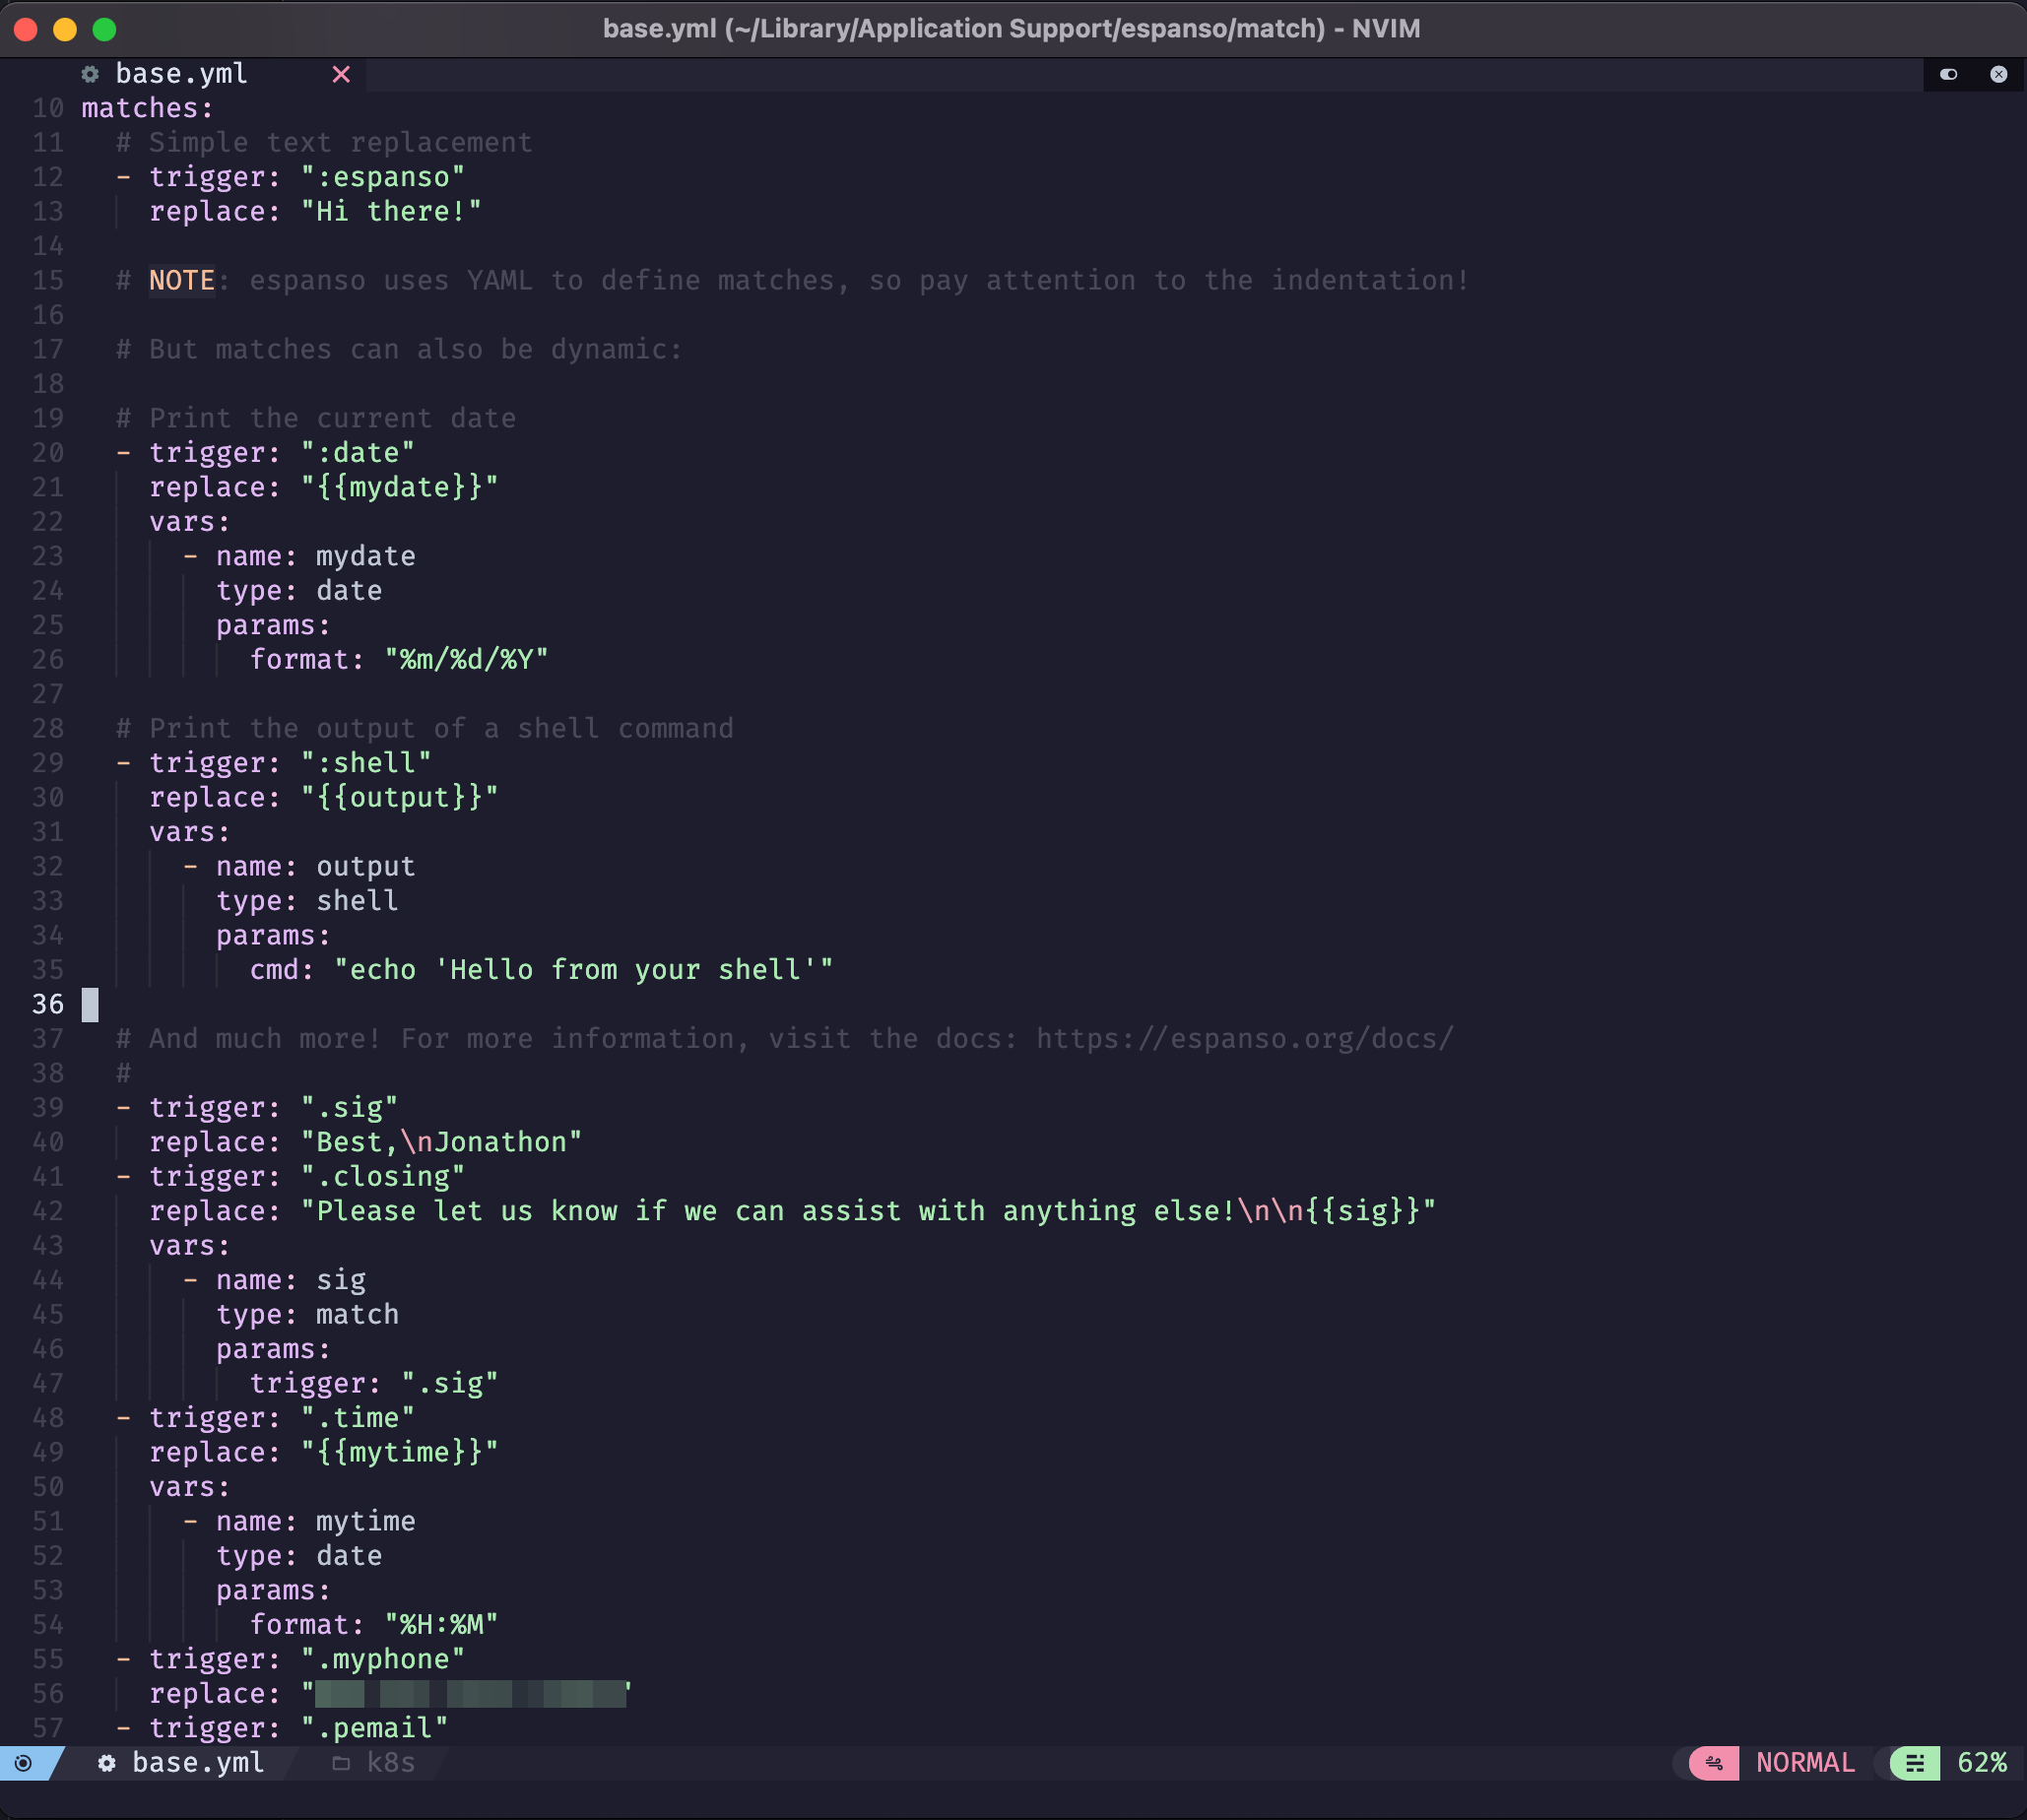
Espanso
Espanso is cross-platform & highly customizable. However, it doesn't have much of a GUI -- at all. You'll be editing YAML files by hand to define your snippets. While that increases the learning curve, don't be discouraged! YAML files are incredibly simple to work with (and you'll get to learn a little bit too)! Espanso is just as powerful as Beeftext, if not more so. The documentation is quite detailed, but easy to follow. I recommend Espanso if you need cross-platform snippets. Since the configuration is YAML (text) based, it's very easy to sync with Git, Syncthing, Dropbox, etc.
AutoHotKey
AutoHotKey is the original text expander (and so much more). It's as barebones as you can get. It is very powerful -- you can pull off some pretty neat things with it. It's a Windows-only scripting language that allows you to create a keyboard (or mouse) shortcut to do just about anything. In fact, I wrote an AutoHotKey script a few years ago that got a few hundred stars on GitHub, before Windows Terminal came along and depricated my efforts. Ahhh, memories... Anyway, AHK is a little beyond the scope of this post. But if you're ever interested in learning, it's a decent introduction to basic scripting.
Closing
Since my current job requires that I use Windows (😣), I've found BeefText to be the perfect companion to my daily workflow. The GUI is simple and it's very easy to add/edit snippets on-demand. I've also got Espanso setup on my Mac and Linux machines. Espanso is a little more complicated to get setup, but the documentation is extremely detailed. When I have the time, I may work on replicating all of my Beeftext combos in Espanso, just so I have the same experience across all platforms. One area where these free options fall short is syncing and sharing: TextExpander allows for syncing and sharing of snippets with friends/coworkers, automatic sharing with employees, setting permissions, etc. With these free options, you have to bring your own syncing/sharing platform. That said, I encourage you to try either of these options. Once you start using text snippets you'll wonder how you ever lived/worked without them!
]]>
I've long been a fan of Docker (and containerization in general), but I've managed to avoid Kubernetes (k8s) for some time. Mostly because I didn't have a suitable environment in which to play around with it. That changed recently when I discovered Oracle Cloud and their very generous free offerings.
We're going to be setting up a cloudlab on OCI with a Kubernetes cluster. Traefik will serve as an SSL-enabled reverse proxy to Rancher (for k8s management) and Wordpress (an example service stack).
Oracle Cloud Infrastructure
Oracle Cloud Infrastructure offers an impressive suite of "Always Free" resources, including:
- 2x x86-64 (AMD-based) VM Instances
- 1-4x ARM64 VM Instances, with 24 GB of memory split between them
- 2x Block Volume Storage, 200 GB total
- 1x Flexible Load Balancer (10Mbps)
Get started here. You'll need a valid credit/debit card for signup, but you won't be charged anything. It may take a day or two for your account to activate. While you're waiting, you can go ahead and install OCI Cli, Kubectl and Helm. You should also have your own domain name. I use NameCheap as my registrar, with Cloudflare providing Authoritative DNS. Traefik supports these providers for LetsEncrypt SSL cert generation. You're welcome to use whichever you prefer, but this guide is aimed at Cloudflare.
Kubernetes
Once you've got everything above set up, it's time to dig in to the real meat and potatoes: Kubernetes. K8s is what's known as a "container orchestration platform." Here's a great analogy that explains how K8s works. Basically: there's Docker, a container engine, which can be thought of as a single cargo ship. That ship has any number of cargo containers, or "services" (i.e. Wordpress, mariadb, apache). Then there's K8s. It's the "eye in the sky." It manages the logistics needed for any number of those cargo ships to operate together: their manifests, communications, crew, routes, schedules, etc. In short, K8s manages clusters of containers. Make sense?
Now then, let's create your K8s cluster on OCI. From your Dashboard, navigate to Developer Services > Kubernetes Clusters (OKE). Create a cluster. Quick create. For our purposes, let's create a cluster with a Public Endpoint and Private Workers. You can name it anything you like. To take advantage of OCI's free offerings, the shape should be VM.Standard.A1.Flex. For OCPUs and Memory, choose 1 & 6 GB, respectively. With this configuration, you can create up to 4 nodes for free! Under "advanced options" you can choose to either import an existing SSH public key or generate a new private/public keypair. Keep that safe. Click Next to review, then Create cluster. It may take a few moments to come up, but once it's done you should see a green Active status. Once it's up, click the Access Your Cluster button for instructions on configuring kubectl. Select Local Access and follow the instructions to get kubectl setup to manage your cluster. Once you're done with that, run:
$ kubectl cluster-info
If you did everything right, the above command should output something like:

Now that we've got a working k8s cluster and a properly configured kubectl, we can start deploying some services!
Kubernetes Dashboard
This isn't strictly required, but it'll help you out in a pinch if you botch a few deployments and make your cluster inaccessible. Kubernetes dashboard won't be exposed on a public endpoint, but we can access it through a neat feature of kubectl: proxy. Run this to get it installed and initialize the proxy:
$ kubectl apply -f https://raw.githubusercontent.com/kubernetes/dashboard/v2.5.1/aio/deploy/recommended.yaml

$ kubectl proxy
This will forward a port on your local machine directly to the Kubernetes dashboard. Once the proxy is up, you can access it at:

Token Auth
In a separate terminal session, you'll want to do the following to get the authentication token for Kubernetes Dashboard:
$ kubectl create serviceaccount dashboard-admin-sa
$ kubectl create clusterrolebinding dashboard-admin-sa --clusterrole=cluster-admin --serviceaccount=default:dashboard-admin-sa
$ kubectl get secrets
In the list, you should see an entry for dashboard-admin-sa-token-xxxxx. Use this command to actually view the token (replacing xxxxx as needed):
$ kubectl describe secret dashboard-admin-sa-token-xxxxx
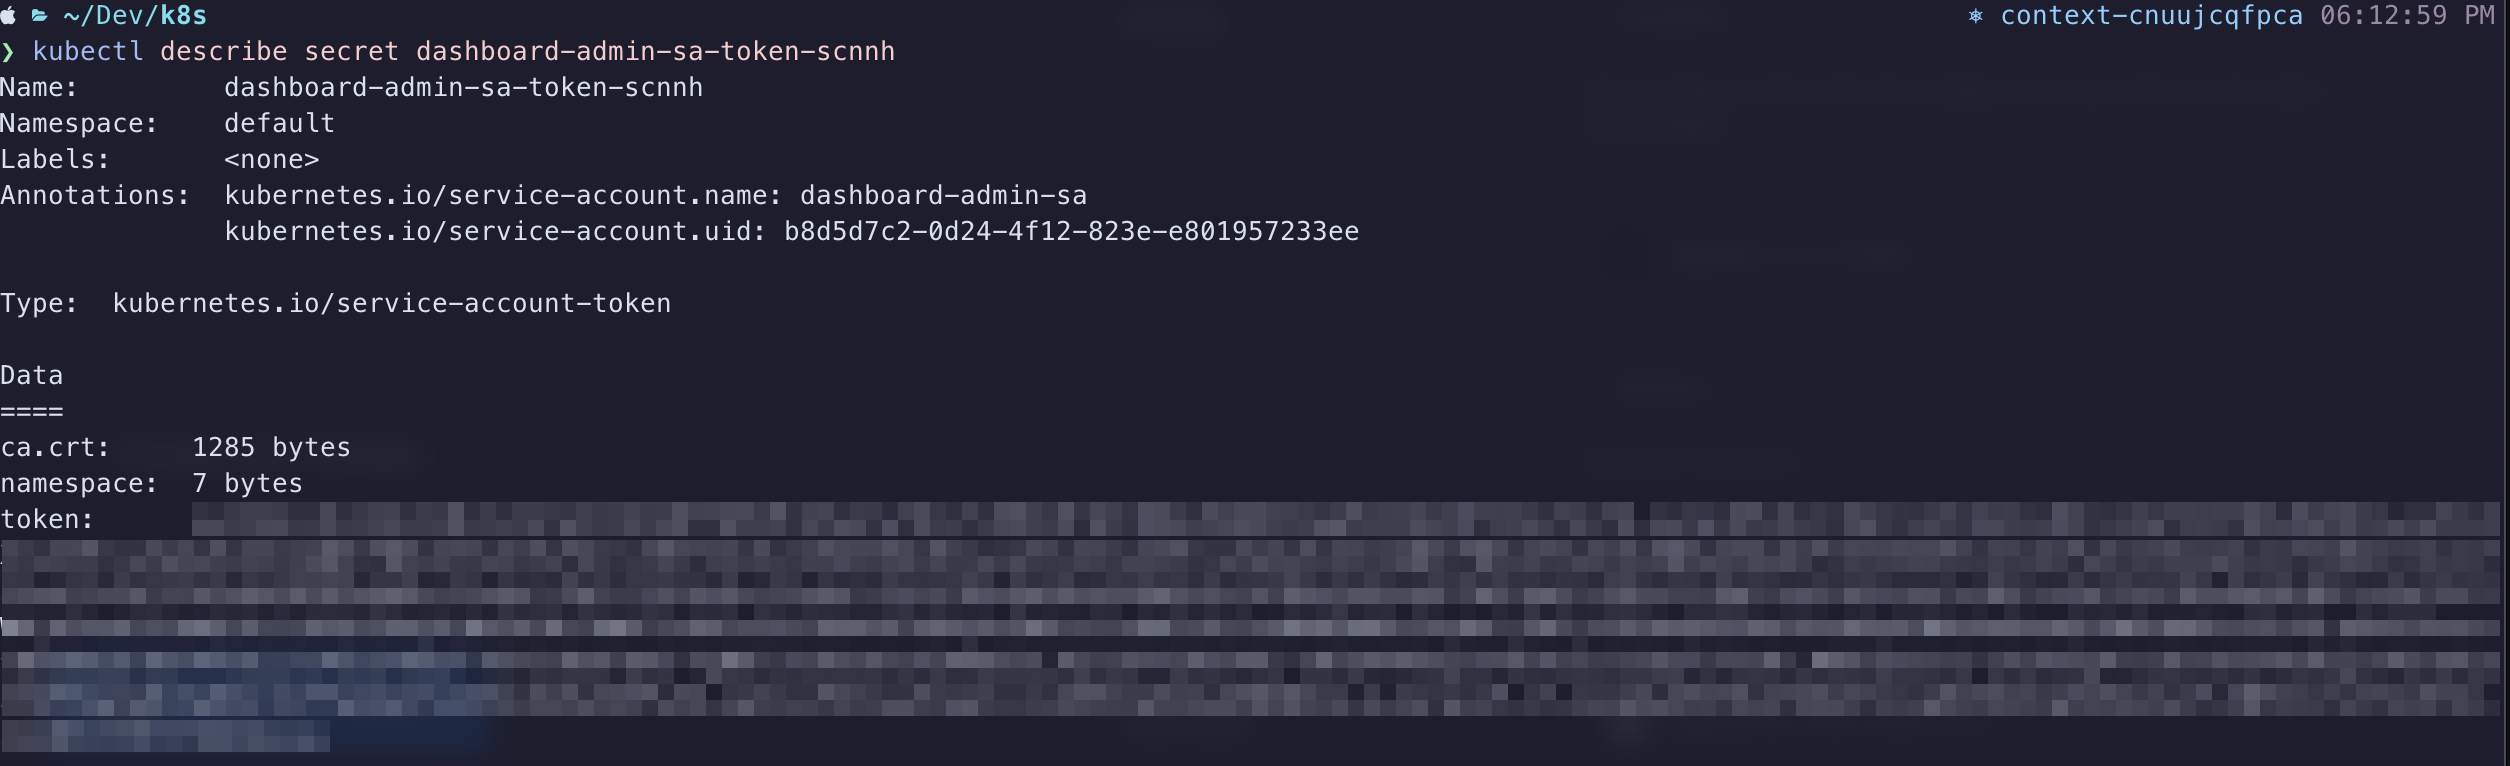
Copy the value from the token field and paste it into the Enter token field on your Kubernetes Dashboard sign-in screen. If all goes well, you should gain entry to the dashboard, where you'll have a birds-eye view of your k8s cluster. Feel free to click around in here to get acquainted with your cluster.
Traefik
I've been using Traefik in my Docker homelab for years now. It's a wonderful piece of software. It's a load balancer, router and reverse proxy in one. Their slogan, "Makes Netowkring Boring," is true. It makes this complex process extremely simple. That said, the documentation can be a little vague sometimes, so I've had to rely on lots of online tutorials to fully understand how it works. Once you've got it configured properly, you likely won't have to touch it all that often.
You installed helm right? Good. Let's use it to get Traefik installed on the cluster:
$ helm repo add traefik https://helm.traefik.io/traefik
$ helm repo update
Now let's create a file called traefik-values.yml. This file will store your customized variables, like your Cloudflare API key, Cloudflare email address and your Domain name. Replace values below as needed:
# traefik-values.yml
---
additionalArguments:
  - --entrypoints.websecure.http.tls.domains[0].main=yourdomain.tld
  - --entrypoints.websecure.http.tls.domains[0].sans=*.yourdomain.tld
  - --certificatesResolvers.le.acme.dnsChallenge=true
  - --certificatesResolvers.le.acme.dnsChallenge.provider=cloudflare
  - [email protected]
  - --certificatesresolvers.le.acme.storage=/data/acme.json

ports:
  web:
    redirectTo: websecure

env:
  - name: CF_API_EMAIL
    value: [email protected]
  - name: CF_API_KEY
    value: oHW0uldNtY0uLikeT0KN0www1337

ingressRoute:
  dashboard:
    enabled: true

persistence:
  enabled: false

securityContext:
  readOnlyRootFilesystem: false
  runAsGroup: 0
  runAsUser: 0
  runAsNonRoot: false

podSecurityContext:
  fsGroup: null
Issue this command to install Traefik with your customizations in place:
$ helm install traefik traefik/traefik --values=traefik-values.yml
The reason we're not using persistence for Traefik's data is twofold:
- Oracle's always free tier claims we can have 200GB of Block Storage, but they neglect to tell you that the Boot Volumes for our Nodes draw from that pool. Since the minimum size of a boot volume is ~47GB, we really have no leftover space to use for a persistent volume claim. This is also why we're using Longhorn inside the boot volumes.
- Traefik's data is basically: log files and a JSON file containing SSL cert definitions dynamically generated from LetsEncrypt. So long as we're not hammering the LetsEncrypt servers, we're safe.
You can view the Traefik dashboard by issuing this command:
$ kubectl port-forward $(kubectl get pods --selector "app.kubernetes.io/name=traefik" --output=name) 9000:9000
This will start a proxy to your Traefik's dashboard running on port 9000, but it's not exposed via a public endpont. While this proxy is running, you can view it at http://localhost:9000/dashboard/#/http/routers. Press CTRL-C when you're ready to stop the proxy and move on.
The Traefik helm chart automatically provisions a load balancer in OCI that isn't compatible with the always free tier. We have to make an adjustment. So open up your Oracle Cloud dashboard and navigate to Networking > Load Balancers. You'll see the automagically generated Load Balancer. Click on it to show it's details, then click the Update Shape button. You need to change it to a Flexible Load Balancer with 10 Mbps Minimum & 10 Mbps Maximum Bandwidth. Also take note of the IP Address, we'll need that for our DNS provider:


DNS Setup
Setting up Cloudflare as the Authoritative DNS provider for your domain name is relatively easy. I venture to say it's out of scope for this guide. Follow this guide to get started. Once you've got your DNS setup properly, you'll want to add a few records to point to the services your cluster will provide:
| Record Type | Hostname | Destination |
| A | yourdomain.tld | Load Balancer IP Address |
| CNAME | rancher.yourdomain.tld | yourdomain.tld |
| CNAME | blog.yourdomain.tld | yourdomain.tld |
Feel free to change those however your like. Perhaps you want your Wordpress at the root of the domain (with a www CNAME) instead. Just make sure you persist those changes as we continue below.
Rancher
Rancher is an excellent app we can use to manage our cluster. It's similar to the Kubernetes Dashboard we setup above, but it's much more "user friendly." We're going to expose it on a public endpoint at rancher.yourdomain.tld so you can access it anywhere.
Let's deploy the helm chart:
$ helm repo add rancher-latest https://releases.rancher.com/server-charts/latest
$ helm repo update
$ kubectl create namespace cattle-system
$ helm install rancher rancher-latest/rancher --namespace cattle-system \
    --set hostname=rancher.yourdomain.tld \
    --set bootstrapPassword=admin \
    --set ingress.tls.source=secret
Remember to replace your domain name in the hostname variable. This will install the Rancher service in a separate namespace called cattle-system. Namespaces are an organizational feature of K8s, allowing you to categorize services in their own self-contained unit. Your rancher deployment should come up within a matter of seconds. However, our load balancer (Traefik) doesn't yet know which HTTPS traffic it should proxy to our Rancher deployment. So, we need to define an IngressRoute for rancher.yourdomain.tld:
# rancher-ingress.yaml
apiVersion: traefik.containo.us/v1alpha1
kind: IngressRoute
metadata:
  name: rancher-tls
  namespace: cattle-system
spec:
  entryPoints:
    - websecure
  routes:
    - kind: Rule
      match: Host(`rancher.yourdomain.tld`)
      services:
        - name: rancher
          port: 80
  tls: # This route uses TLS
    certResolver: le # Uses our certificate resolver to get a certificate automatically!
$ kubectl apply -f rancher-ingress.yml
Now you should be able to open https://rancher.yourdomain.tld and be greeted by the Welcome to Rancher page. Follow the wizard to setup your admin account. Remember, the admin password is "admin" (or whatever you set "bootstrapPassword" to in the helm command above). Please please please set a secure password!
Longhorn
This is where things diverge from the norm. You wouldn't want to do this in a real-world production environment. I'm still trying to come up with a better workaround. We're going to use Longhorn as a block storage provider inside the boot volume of our nodes. The reason we do this is because we're limited to 200GB Block Storage with the Oracle always free plan & each of our nodes' Boot Volumes are ~47GB. If we have 4 nodes, then that's 188GB of the 200GB limit. They don't tell you Boot Volumes count towards that 200GB quota, so watch out!
We can setup Longhorn entirely from the Rancher GUI. So open up your browser to your new Rancher instance and navigate to Apps > Charts and find the entry for Longhorn in the list:
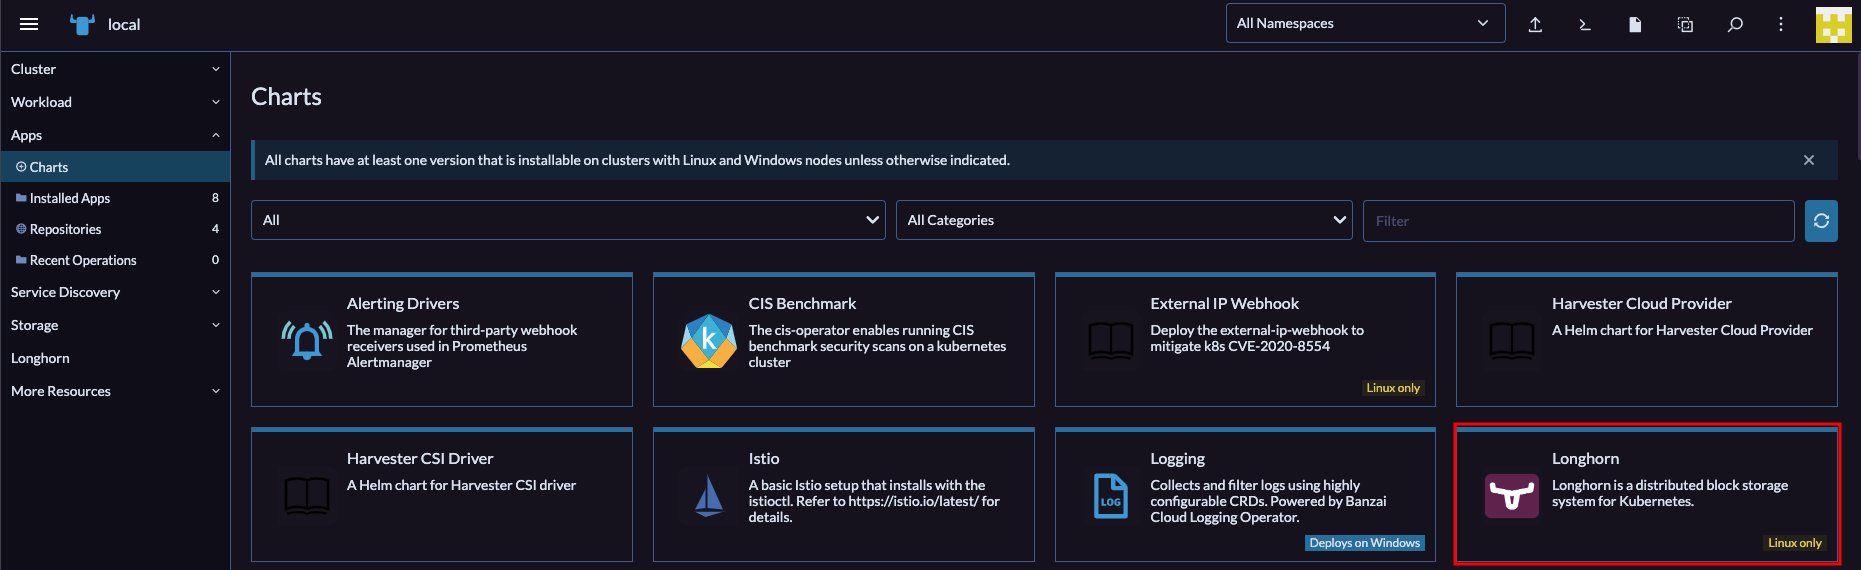
Click on that to open up the details of the Helm Chart. Next, select the Install button in the top right corner. Now click through the prompts and complete the install. Once that's done, you should have a Longhorn entry in Rancher's left sidebar. Open that, then click the Manage storage system via UI button that shows next. You should now be seeing the Longhorn web UI. Pretty! Click around a bit to explore. There's not much else for us to do here at the moment, our volumes are going to be created dynamically in the next section.
Wordpress
I'm using Wordpress as an example because it relies on at least 2 containers to function: one for the web server & one for the database server. Wordpress is also a stateful application, meaning data has to be preserved between deployments. Most real-world scenarios will involve multiple containers that have to communicate with one-another and persist data between deployments. If data wasn't persistent, it would be lost anytime our application restarted or moved to a different node.
The Wordpress helm chart offered by Bitnami is not compatible with our ARM64-based nodes in OCI, so we're going to have to build this ourselves. Don't worry, it's pretty easy!
Go ahead and download this configuration file for our stack & open it in your editor. You're going to want to change some things: the hostname blog.yourdomain.tld should be your own domain that you configured above; CHANGEME should be the password you want to use for the Wordpress MariaDB user; CHANGEME2 should be the password of the MariaDB root user; 5Gi is the size of the PersistentVolumeClaim for both our Wordpress volume & MariaDB volume (remember we're using the node's boot volume, so we don't want to make these too big). Once you've made your changes, go ahead and issue this command to start the stack:
$ kubectl apply -f wordpress_mariadb.yml
If everything went well, then after a moment or two you should be able to navigate to https://blog.yourdomain.tld and be greeted by the Wordpress installation page. Setup your admin username and password et voila! You should now have a fully functioning Wordpress website hosted on Kubernetes in the Cloud. For free!
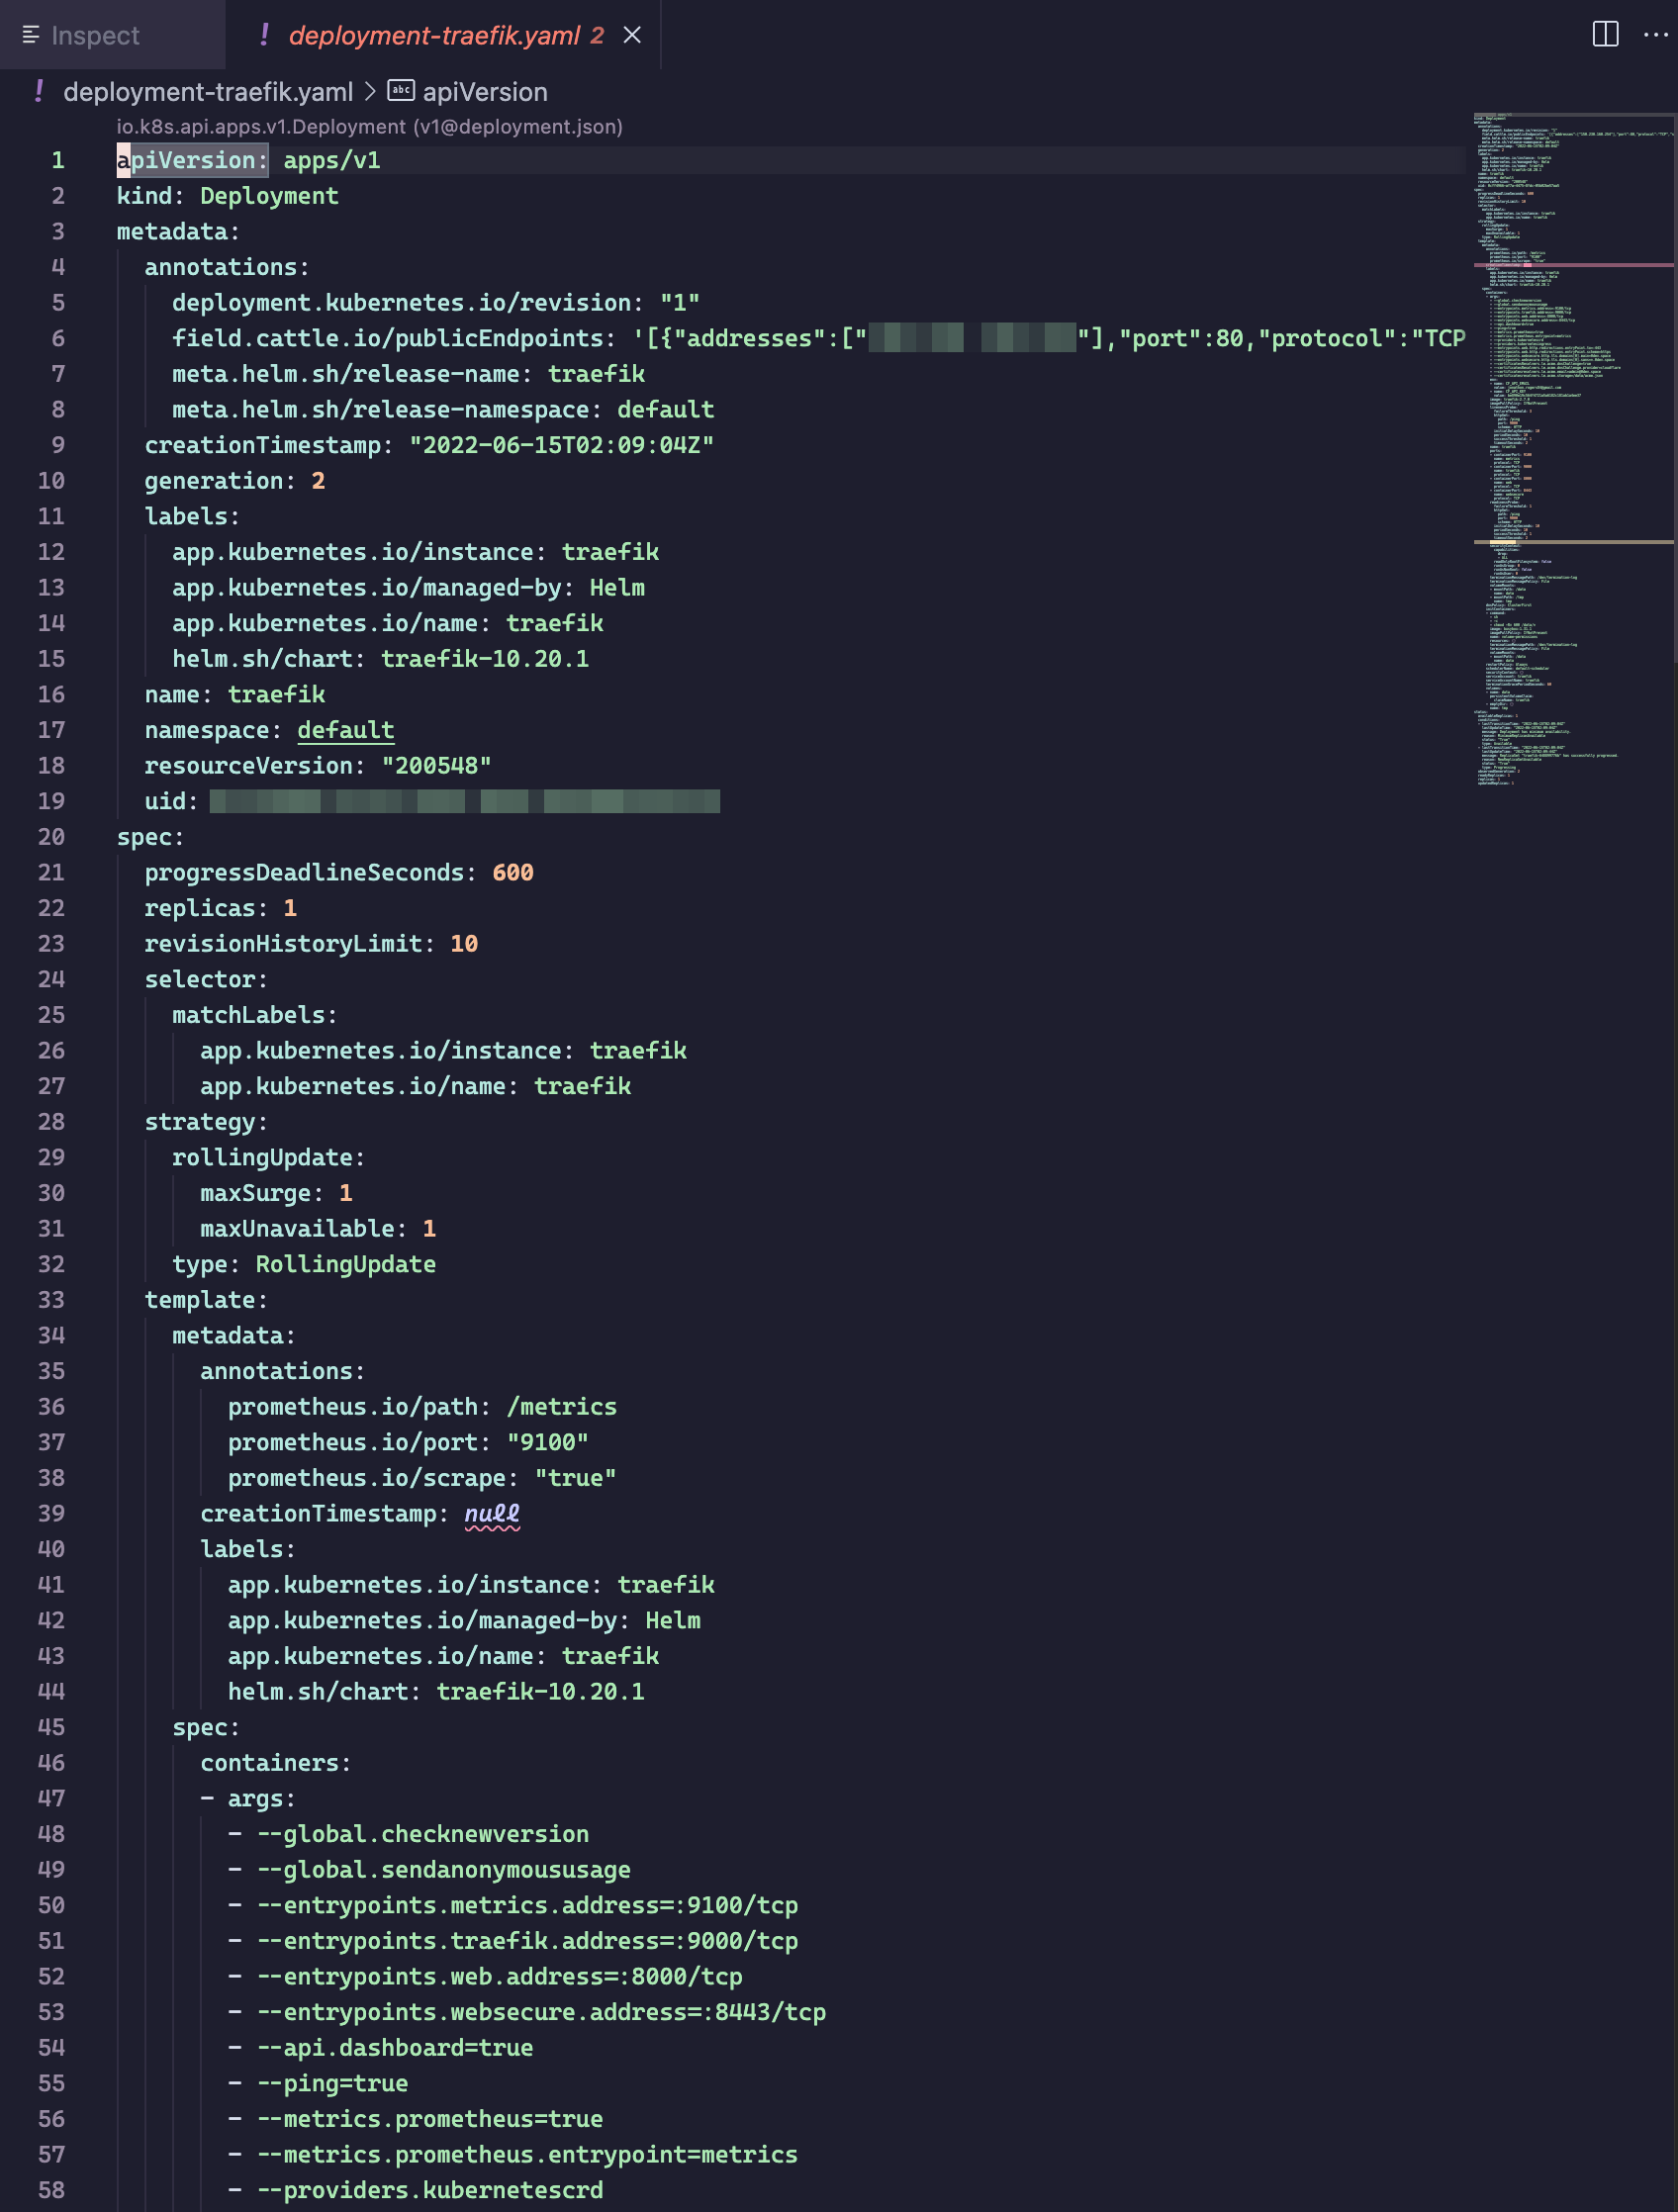
Bonus: Visual Studio Code Extension
Once you have kubectl configured properly, you can install the Kubernetes extension for Visual Studio Code to get access to a tree-view of your cluster. You can drill down and inspect the YAML of every aspect of your cluster: nodes, workloads, network, storage. It's pretty cool! Also, it'll help you to better understand what's going on "under the hood" and how everything fits together.
Closing
Now you should have a fully operational Wordpress installation running on a kubernetes cluster in the cloud. Neat! You can take the concepts described in this post and expand upon them to your heart's content. I'm still a K8s n00b myself, so please let me know if you have any improvements to this setup! Remember, some of the practices we used were kind-of unorthodox, but it was the only way to stay within to scope of the always free plan. If you have any improvements or suggestions, please let me know in the comments!
References
]]>
Last night, I was taking inventory of my old Ubuntu 18.04 Intel NUC's Docker stacks & containers. I'm prepping it to start fresh and integrate into the Docker Swarm I run now. Anyway, I came across a container for Netdata. The container was listed as "unhealthy" in Portainer and I couldn't get it to start, so I headed to the internet to do some research.
It turns out Netdata has grown quite a bit from what I remember. As I recall, it was an on-prem server resource monitor. They now offer free cloud infrastructure monitoring through Netdata Cloud. What this entails is: running an agent on each node (server, workstation, VM, docker container, etc), which reports various metrics back to a dashboard running in the cloud.
The setup could not be easier. You start by visiting https://app.netdata.cloud and signing in with your choice of Google, GitHub or Email address. Next, you're greeted by an empty "War Room" with instructions on adding your first node:
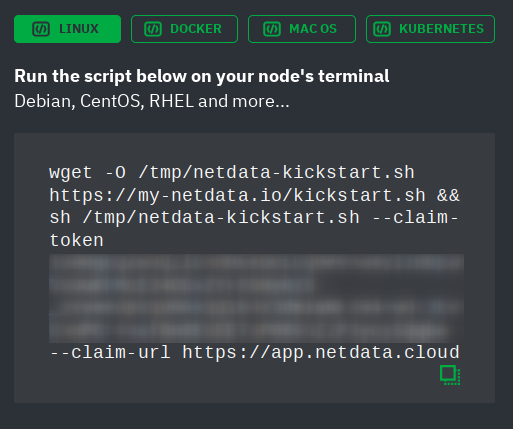
As you can see, there are options to install the agent to Linux, MacOS, Docker or Kubernetes. I chose the option for Linux, then copied & pasted the script into my terminal/ssh session. It did ask for my sudo password, but that was only used for installing packages through apt. You can examine the script yourself if you're wary. After the install completed, a new item appeared in my Netdata Cloud dashboard:
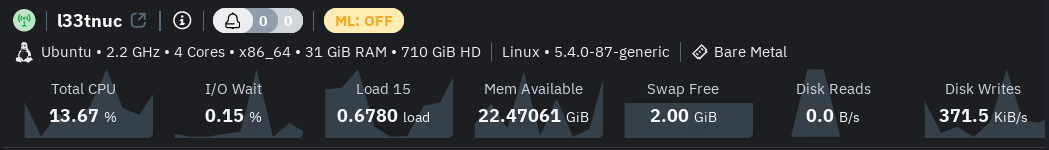
It took a few minutes for all of the fields (OS, CPU, RAM, etc) to populate. Once they did, I clicked on the new node to open it's individual dashboard. This is where things got really interesting! I was now looking at over 1200 beautiful charts! One for each metric collected by the Netdata agent:
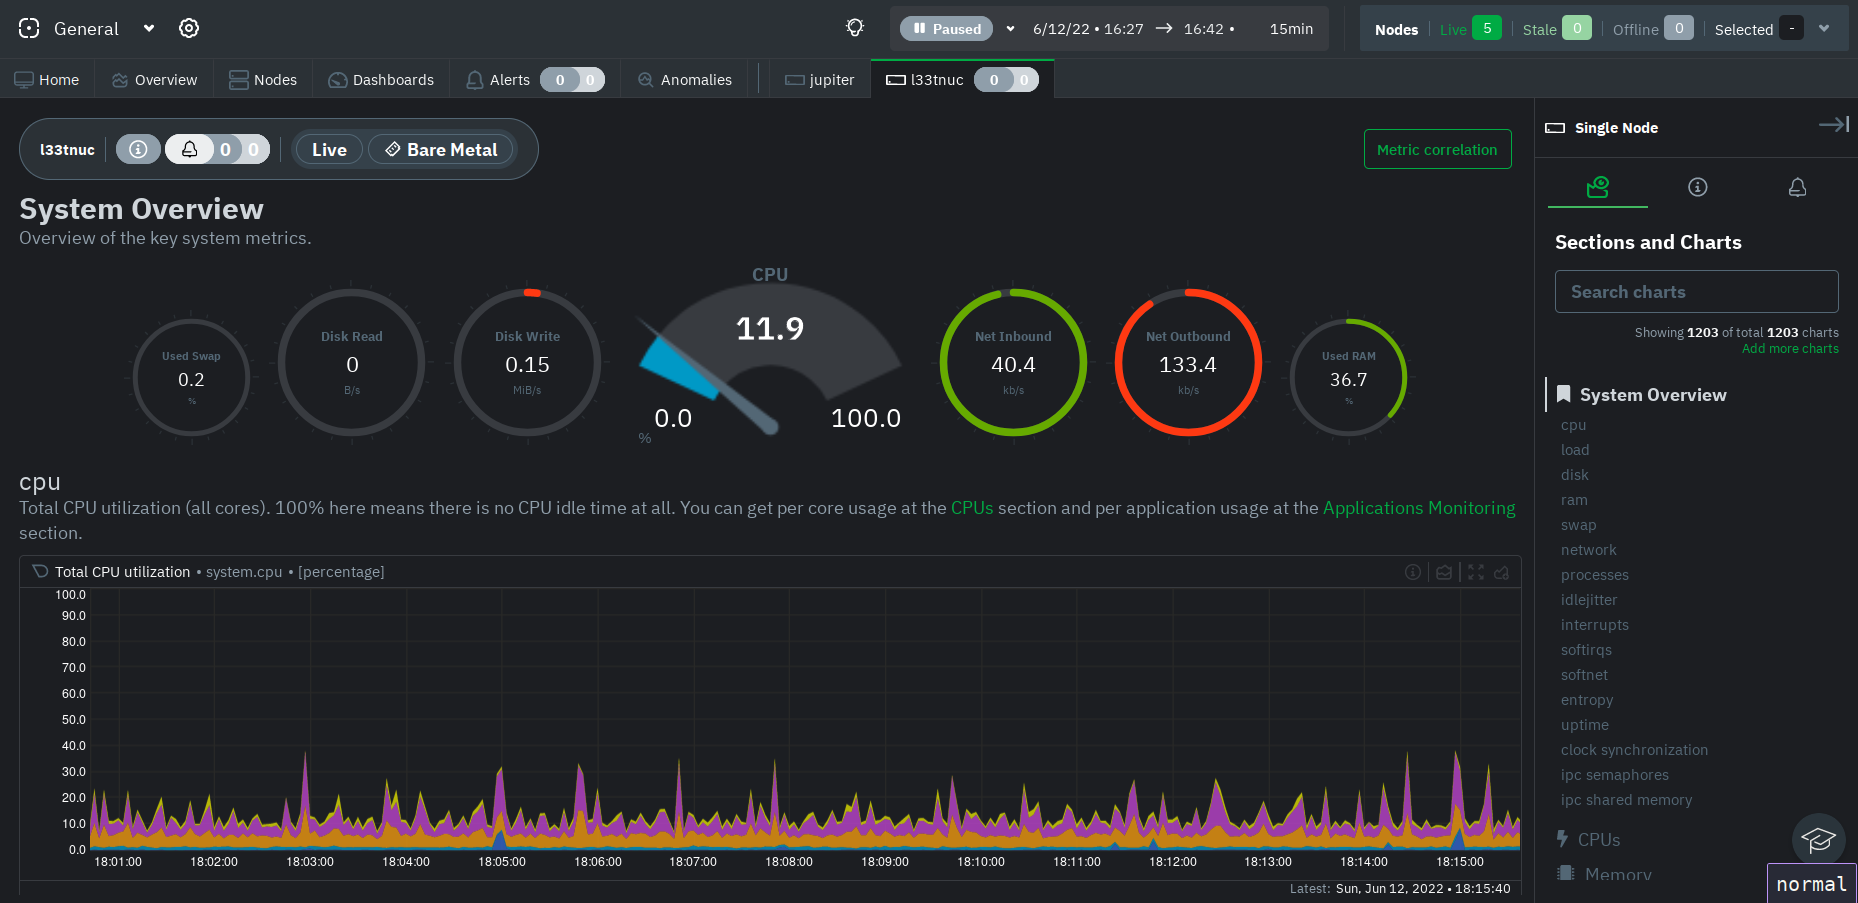
Right then and there, I decided I would install this on each Linux node I have running in my Homelab. You don't have to use Netdata cloud (though I don't see why you wouldn't): You can also monitor each node indivudally at http://node-ip:19999. According to Netdata's documentation, they are privacy-aware and no metric data is stored in Netdata cloud.
There's still a whole lot to uncover here. I already received a couple of RAM usage notifications via email this morning, so I want to see how I can fine-tune the alerting system. The Netdata documentation is quite detailed, so I don't imagine I'll have any problem finding what I need.
One final note: There isn't an agent that runs native on Windows, but it looks like one can get around that by using the Prometheus windows_exporter (supported) or WSL (unsupported).
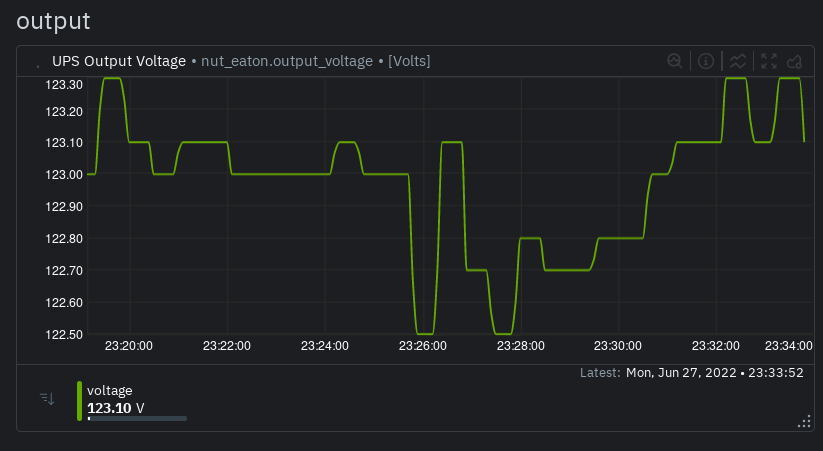
Update: I recently got a pair of UPSs that were being decommissioned by my employer. They're basically like-new! Anyway, I plugged them into my PowerEdge R630 server, which runs Proxmox (Debian), and setup NUT to monitor them. I had them configured for USB-passthrough to a VM running HomeAssistant and figured I'd monitor them through that. However, as soon as NUT was configured, the Netdata agent picked up the UPSs straight away! I didn't even know about it until we had a short power outage recently and, much to my surprise, I got an email notifcation from Netdata stating that my UPSs were running on battery power! The warning state cleared when power returned. So cool!
Have you had any experience with Netdata? Can you recommend a comparable solution? Let me know in the comments!
]]>