Gold Goes Full Niagara in $400 Wipeout. Is It Over & What Next?Gold, you had one job.
When the world gets scary, gold OANDA:XAUUSD typically goes up. Wars, inflation, geopolitical mess: gold is supposed to be the adult in the room, the asset that holds its nerve while everything else panics.
On Wednesday and Thursday, gold forgot its job entirely, shed ne

The best trades require research, then commitment.
Get started for free$0 forever, no credit card needed

Scott "Kidd" PoteetPolaris Dawn astronaut

Where the world does markets
Join 100 million traders and investors taking the future into their own hands.

XAU/USD | Gold Breaks $5000 – Liquidity Fill Before Next Drop?By analyzing the #Gold chart on the 4-hour timeframe, we can see that after the previous update, price failed to hold above the key $5050 level and entered a strong bearish expansion.Gold experienced a sharp sell-off and even dropped to the $4835 level, clearly breaking below the major $5000 psychol

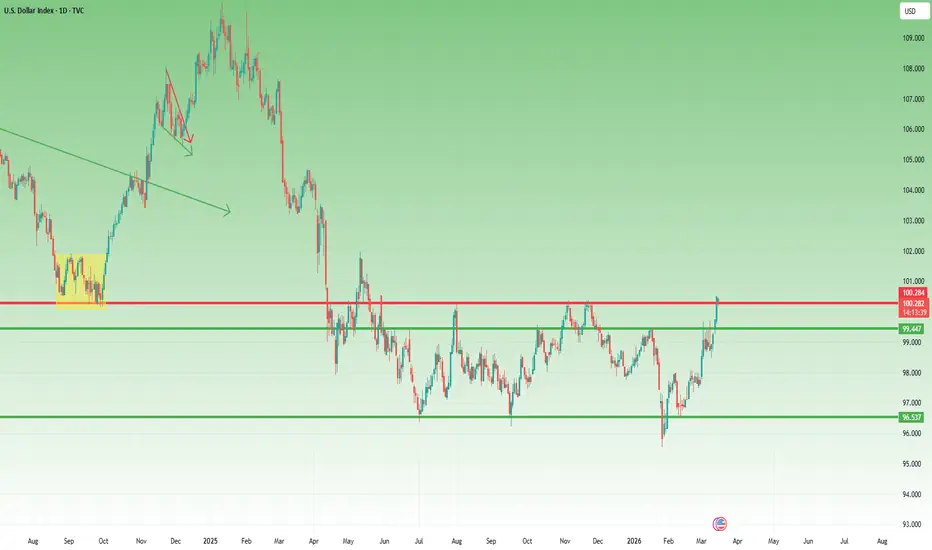
DXY Tests the 100 Resistance After a Strong Rally- What's next?After the false break at the end of January, the US Dollar Index began a steady recovery that has now developed into a rally of more than 5%. Over the past six weeks, the move has been relatively consistent, gradually pushing the Dollar higher and bringing the index to an important technical area.
Micron on the Brink as AI Momentum Pressures a Break Above 460Micron is setting up in a very strong position here, with both the fundamental and technical backdrop leaning in the same direction. The AI memory theme remains the core driver, and that narrative is being reinforced by HBM4 production, capacity expansion, and elevated expectations into the March 18

GER40 — Global Outlook | MTF 1M → 1W → 1DGER40 — Global Outlook | MTF 1M → 1W → 1D
Higher-timeframe resistance | Global short scenario toward monthly discount
Overview
GER40 is trading inside a higher-timeframe resistance zone and is entering a corrective phase on the higher timeframes. Price has reached the monthly order block ins

Gold Sliding Toward 5000 — Correction or Start of a Bigger Drop?Gold continues to trade under pressure on the H2 timeframe, with price gradually losing bullish momentum after the recent macro-driven volatility.
Despite periods of geopolitical tension and market uncertainty, gold has struggled to regain strong upside traction.
This raises an important question

Natural Gas Stock Forecast | Oil | Dollar | Silver | Gold0:00 Weekly Commodities Market Overview
0:26 Natural Gas (NG) Technical Analysis
3:54 Crude Oil (WTI) Technical Analysis NYMEX:CL1!
5:26 US Dollar Index (DXY) Analysis
7:38 Gold (XAUUSD) Price Analysis COMEX:GC1!
9:46 Silver (XAGUSD) Technical Analysis COMEX:SI1!
11:52 Weekly Commodities Wrap

Meta bets on independence in AI chipsMeta bets on independence in AI chips and strengthens its technological strategy
[/b ]By Ion Jauregui – Analyst at ActivTrades
The race for artificial intelligence continues to accelerate and Meta Platforms has decided to take a strategic step to reduce its dependence on large hardware providers.

TheGrove | USDCAD Buy | Idea Trading AnalysisUSDCAD is falling towards a support level which is a pullback support and could bounce from this level to our take profit.
We expect a decline in the channel after testing the current level which suggests that the price will continue to rise, to Support line..
Hello Traders, here is the full analys

13.03.26 Daily ForecastPairs on Watch -
FX:USDJPY : I am looking at a short on this today as price is sat at highs where we could see it turn around for sells. There is a value area above price could be getting pulled to, so if it does break out long I am open to this idea as well. I also include a little overview of

See all editors' picks ideas
Market Microstructure AnalyticsThe Hidden Toll on Every Trade
Every time you buy or sell a financial instrument, you pay a cost that never appears on your brokerage statement. It is not a commission. It is not a fee. It is the spread between the price at which someone is willing to sell to you and the price at which someone is
Pine Script® indicator

Fair Value Gap Profile + Rolling POC [BigBeluga]🔵 OVERVIEW
FVG Profile builds a price-level profile based on detected Fair Value Gaps (FVGs) over a fixed lookback period.
Instead of measuring traded volume alone, this tool aggregates bullish and bearish FVG occurrences into horizontal bins, allowing traders to see where price inefficienci
Pine Script® indicator

PineScript integration with Notepad++ (UDL)THIS IS NOT AN INDICATOR!
This is PineScript integration with Notepad++ text editor (NPP). It supports PineScript v6 as of January 2026. Provides autocompletion, function list and syntax highlighting for *.pine files.
Why would anyone need this?
Pine Editor doesn't provide function list yet
Pi
Pine Script® indicator

Machine Learning Pivot Points (KNN) [SS]Hey everyone,
Been working on this one for a very long time.
1. What It Is: The Geometric DNA of a Pivot
Machine Learning Pivot Points (KNN) is a predictive structural tool that moves away from traditional lag based oscillators. Instead of waiting for a moving average crossover, this system t
Pine Script® indicator

Market Structure Volume Profiles [Kioseff Trading]Hello traders and friends!
Introducing: "Market Structure Volume Profiles".
This script combines market structure with volume profiling and CVD to show how volume develops inside each structural changes of the market.
Instead of building one continuous profile across a session, this script create
Pine Script® indicator

Liquidity Thermal Map [BigBeluga]🔵 OVERVIEW
Liquidity Thermal Map visualizes where the highest traded volume has accumulated across price levels over a fixed lookback period.
Instead of plotting classic volume profiles with bars, the indicator builds a horizontal thermal heatmap directly on the chart, highlighting areas of
Pine Script® indicator

VIX Curve Pro - Real-Time Term Structure with StatisticsThis indicator displays the VIX term structure as a spatial curve directly on the chart, allowing you to instantly identify whether the volatility market is in contango or backwardation.
It shows the relationship between different VIX maturities (9D, 30D, 3M, 6M, 1Y) as a single curve.
It also sh
Pine Script® indicator

Stop Loss Cascades (Breakouts) [Kioseff Trading]Hello friends and traders!
🔹Introduction
This indicator " Stop-Loss Clustering (Breakouts) " attempts to model trader stop-loss placement logic and identify price areas where a large amount of stop losses might cluster.
The idea is, if stop losses are indeed highly concentrated in a specific are
Pine Script® indicator

Swing Profile [BigBeluga]🔵 OVERVIEW
Swing Profile is a dynamic swing-based volume profiling tool that builds a complete volume profile for each completed market swing.
Instead of using fixed sessions or time ranges, the indicator anchors its profile strictly between confirmed swing highs and swing lows, allowing tra
Pine Script® indicator

[MAD] Gann o MaticusGannomat — Full Automated Gann Grids & Astro Cycles
Automatic Gann quadrant boxes with geometric arc projections. Cycle boundaries from standard timeframes or real planetary astronomy.
Thanks BarefootJoey, master of Astrolib
What Does This Indicator Do?
Gannomat draws a Gann quadrant box
Pine Script® indicator

See all indicators and strategies
Community trends
Micron Technology - Still respecting the major resistance!☠️Micron Technology ( NASDAQ:MU ) is still respecting resistance:
🔎Analysis summary:
Micron Technology has been creating an expected rally of more than +600%. But looking at higher timeframe structure, this stock is now at a massive resistance area. While there is no bearish momentum yet at a

STRATEGY starting the next bearish wave to $60.Strategy (MSTR) continues to be on a non-stop downtrend since the mid July 2025 High and generally a Bear Cycle since its November 21 2024 All Time High (ATH).
As we've pointed out in previous analyses, the current correction resembles so far the 2021 - 2022 Bear Cycle. Right now we are on a simila

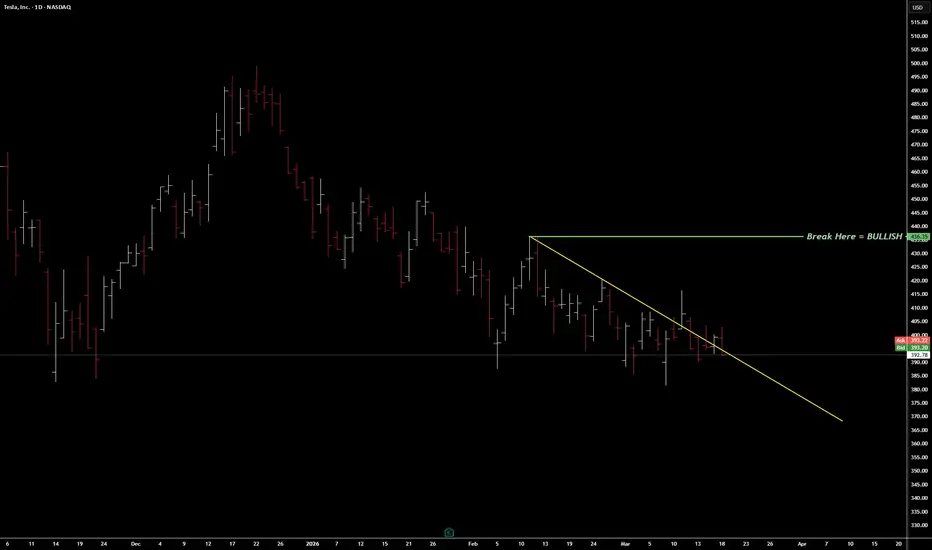
TESLA: Trendline Break, Retest, and First Higher Bottom SetupTesla is beginning to display the early characteristics of a structural trend reversal . Price has broken above the primary descending trendline and completed a precise retest, holding the level with conviction — a behaviour typically seen when control begins shifting from sellers to buyers.
The s
$IONQ: Sovereign Capital Meets a Technical BottomThe quantum computing race just got a historic injection of capital, and NYSE:IONQ is standing right at the center of it.
Fundamentally, the landscape shifted this week. The UK government just announced a massive £2 billion initiative to roll out quantum computers at scale by the early 2030s. Mor

META CRACK!If the Magnificent 7 can't carry the market, what stocks will?
They are all showing signs of early market weakness.
The days of "Buy The Dip" are coming to an end.
Are you prepared for how the market will trade? If you are 42 years of age or younger, the answer is NO! You were too young to have e

NVDA Sitting on Support — Next Move MattersThis is one of those spots where traders get chopped up.
It looks weak…
but it’s not as simple as “just short it.”
1H Context (Bigger Picture)
On the 1H, NVDA has clearly shifted into a downtrend:
* Lower highs are forming consistently
* The rejection near 188 stands out
* Price is now pressing int

Short Breakout TSLA Idea [Day Trade]If TSLA can break below the descending triangle in 5mins timeframe, then it will go down towards touching the trend-line from the 15m timeframe.
Day Trade Plan:
Short Entry - 397.50
Target - 395.50
Stop Loss - 398.50

Believing $AMZN can only go up is just wishful thinking.People keep saying it’s a bad idea to short NASDAQ:AMZN , but believing Amazon can only go up is just wishful thinking.
The chart is showing bearish probabilities, and historically, price tends to respect that.

COIN: Bullish Crypto-stocks supports a bullish BitcoinI mention frequently the altcoins market and how a strong bullish bias on some and many of the smaller projects supports additional growth on Bitcoin. This extrapolation is now true also for the Crypto-related stocks, such as COIN (Coinbase Global, Inc.).
I've been looking at Coinbase focused on a

NRGV (USA) - Energy Storage Momentum ReboundingEnergy Vault Holdings has put in a massive performance over the last twelve months, sitting on a gain of about 260% and that is after a significant pullback. They specialize in long-duration energy storage solutions , which is a critical piece of the puzzle for the renewable energy transition .

See all stocks ideas
Today
DLTHDuluth Holdings Inc.
Actual
0.23
USD
Estimate
0.15
USD
Today
CSIQCanadian Solar Inc.
Actual
−1.66
USD
Estimate
−0.47
USD
Today
PTHSPelthos Therapeutics Inc.
Actual
−6.87
USD
Estimate
−3.70
USD
Today
DRIODarioHealth Corp.
Actual
−0.76
USD
Estimate
−3.24
USD
Today
ACNAccenture plc
Actual
2.93
USD
Estimate
2.84
USD
Today
CALCaleres, Inc.
Actual
−0.36
USD
Estimate
−0.40
USD
Today
TITNTitan Machinery Inc.
Actual
−1.43
USD
Estimate
−1.00
USD
Today
MOVMovado Group Inc.
Actual
0.57
USD
Estimate
0.52
USD
See more events
Community trends
BTCUSDT: Trend Support Retest Could Drive Price Back to 74.5KHello everyone, here is my breakdown of the current BTCUSDT setup.
Market Analysis
BTC broke out of a descending triangle and formed a bullish trend with higher lows along an ascending trend line. Price reached the 74,500 resistance, where a rejection occurred.
Currently, BTC is pulling back tow

Bitcoin - Fake-out and now moving lower?Bitcoin is currently trading around $71,000 after a strong recovery from the February lows. However, price is now showing signs of weakness as it approaches a key resistance trendline. The recent rejection suggests that the market may be transitioning from a bullish correction into a more cautious o

Bitcoin - Strong bear flag will send the price down (Sell now!)On the chart we can see a strong downtrend that started in October 2025, and the price has been moving in the descending parallel channel. As long as the price is in this channel, we are in a downtrend, and as long as the price prints bearish flags, we have to be cautious. From a clean technical poi

ETHUSD Bearish Breakdown After Consolidation
Ethereum (ETHUSD) shows a clear shift from bullish momentum into bearish structure. After a strong impulsive move upward, price entered a consolidation phase inside a marked supply zone (orange box), where multiple rejections confirmed seller dominance.
The breakdown from this range was sharp and

Bitcoin, rejection at "final barrier" —Your Top Altcoins ChoiceVolatility is high up today and Bitcoin is producing a retrace. Can this be because of the FOMC?
The chart action on the daily timeframe calls for attention, it calls for caution. Another incredible opportunity can develop but it might be short-lived.
Whenever Bitcoin trades below $70,000, that's

BITCOIN Only half a Bear Cycle left!Bitcoin (BTCUSD) is on a strong short-term rise ahead of today's Fed Rate Decision, getting the buy side of the market excited. And they should be. Not because of this short-term counter trend rally, which is normal within long-term correction but because based on the Net Unrealized Profit/Loss (NUP

ETHUSDT - A hunt for liquidity ahead of a potential rise to 3000BINANCE:ETHUSDT is stagnating after hitting a new high of 2,385; the altcoin looks quite promising, but the market may undergo a correction before any potential rise
Bitcoin is slowing down after hitting a new intermediate high. The global downtrend is creating pressure. There is a possibility

BTC – Fed Decision Meets the TRIO RetestBTC is approaching a high-confluence TRIO retest zone.
We have:
🔴 A bearish trendline acting as dynamic resistance
🟠 A supply zone above price
🔵 An overbought area approaching
This triple confluence makes the current zone extremely important, where sellers could step in again.
All eyes are no

BTC/USDT | To the 77,000 level (READ THE CAPTION)BTCUSDT finally managed to break free of the range it had been stuck in for weeks, reaching 76,000, and now is being traded at 74,250.
Currently, Bitcoin is stuck inside the Wick, above the Consequent Encroachment.
I expect BTC to retest the Wick High, and if it goes through it stabilize above it,

Bitcoin Continues To Confirm a Larger MoveBitcoin Continues To Confirm a Larger Move
From our previous analysis Bitcoin completed a textbook Bullish Flag Pattern on the 4H chart.
After the bullish movement started BTC spent some time and tested the first target twice indicating that it was bullish but the volume was also too low and the

See all crypto ideas
GOLD (XAU/USD) : Major Central Bank Policy Ahead! (18.03.2026)Description : Setup Overview OANDA:XAUUSD
✅ XAUUSD recently moved within a descending channel , showing sustained bearish pressure over the past sessions. However, price has now reached a major support zone, where buyers are beginning to defend the area.
✅ The market is currently consolidating

XAU/USD | Gold Breaks $5000 – Liquidity Fill Before Next Drop?By analyzing the #Gold chart on the 4-hour timeframe, we can see that after the previous update, price failed to hold above the key $5050 level and entered a strong bearish expansion.Gold experienced a sharp sell-off and even dropped to the $4835 level, clearly breaking below the major $5000 psychol
Gold At Major Demand – Bounce or Breakdown?Gold is in a clear bearish trend, with strong downside momentum breaking into the 4,860–4,840 demand zone (order block + FVG). Price is reacting from this area, which may act as a base for a short-term recovery.
Two scenarios are in play:
Bullish reaction: if the demand zone holds, price could bou

XAUUSD Under Pressure Below 5,030 Resistance, 4,920 in FocusHello traders! Here’s my technical outlook based on the current XAUUSD (1H) chart structure. Gold moved from a range into a sharp drop, then formed a descending channel with lower highs/lows. Price repeatedly respected the 5,030 seller zone as resistance. Currently, price is trading near the 4,970 b

GOLD: When Gold Ignores War: The Market Isn’t Acting NormalGOLD: When Gold Ignores War: The Market Isn’t Acting Normal
This is an analysis I shared on March 15th and the Gold was showing movement, but it was positioned for this downward movement against all odds.
At a time when the geopolitical situation and the whole world is on fire from Trump's action

Gold 30Min Engaged ( Bullish Entry Detected )⚡Base : Hanzo Trading Alpha Algorithm
The algorithm calculates volatility displacement vs liquidity recovery, identifying where probability meets imbalance.
It trades only where precision, volume, and manipulation intersect —only logic.
✈️ Technical Reasons
/ Direction — LONG / 4828 Reversal Area

Gold Waiting for FED — But Structure Still Favors BearsYesterday was another quiet session for Gold, with price continuing to trade within a relatively tight range.
Compared to the volatility seen in previous days, the market seemed to slow down, suggesting that participants are now waiting for direction — most likely from upcoming FED communication.

Gold key trade Gold is trading under a descending trendline, showing bearish pressure. Price is approaching key resistance near 5083—rejection from this level could push the market down toward the 4860 support zone. Overall bias remains bearish unless a strong breakout above resistance occurs.

GOLD Price Update – Clean & Clear ExplanationGold is currently in a strong bearish trend, breaking multiple support zones within a descending channel. Price has reached a key support area around 4715, where a potential short-term bounce could occur. A retracement toward the broken supply zone and trendline resistance near 4780–4800 is possible

Pressure Mounts – Gold Struggles to Escape the DowntrendAfter a strong rally earlier this year, gold has entered a corrective phase, losing the key psychological level of $5,000 and consistently forming lower highs — a classic sign of a short-term downtrend.
In terms of the latest news, the market is currently driven by three main factors:
- The Fed rem

See all futures ideas
EURUSD Daily CLS Range (News now High Risk) New CLS range created and Im looking for Short Model 1 trade setup. As always after the manipulation above the CLS range and reaction from the key level. We need to see confirmation switch from the manipulation phase - CIOD (change in order flow).
⏳ Stay patient and enter only after candle close.

EURUSD Analysis | Risk-Off + Hawkish Fed Boosts USD!Hey Traders,
In today’s trading session, we are monitoring EURUSD for a selling opportunity around the 1.15250 zone.
EURUSD is currently trading in a downtrend and is undergoing a corrective phase, approaching a key trendline confluence and the 1.15250 support–resistance area. This level could act

USDJPY - Long squeeze before the trend continues FX:USDJPY is testing the key level of 159.19 as part of a counter-trend correction. A long squeeze could trigger an upward rally.
The dollar is testing its highs and poised to continue its rise following yesterday’s news.
The Fed kept rates unchanged, hinting at maintaining the current rate

EURUSD Short: Rejected at 1.1550 Supply, Downside Toward 1.1450Hello traders! Here’s my technical outlook based on the current EURUSD (2H) chart structure. Price initially moved inside a range, showing consolidation before forming a pivot high, where sellers took control. After that, EURUSD entered a descending channel, creating lower highs and lower lows while

EURUSD Under Pressure Below Key Resistance, Target 1.1390Hello traders! Here’s my technical outlook based on the current EURUSD (4H) chart structure. Price previously moved within an ascending structure before reversing at a key resistance trend line, signaling a shift to bearish momentum. After the drop, the market formed a consolidation range and later

GBPUSD Sellers Eye Control Near HighsGBP/USD shows a strong bullish recovery after forming an inverse head and shoulders pattern, signaling a shift in market structure. Price is trending upward within a rising channel, supported by consistent higher highs and higher lows. However, the pair is now approaching a key resistance zone near

GBPUSD Price Update – Clean & Clear ExplanationGBPUSD showing a recovery after a strong drop. Price moved down sharply, found support, and is now pushing upward Earlier, the market was making lower highs and lower lows, confirming a bearish trend.
Technically Price reached a strong support zone around 1.3250 – 1.3300 and reacted sharply upward

EUR/USD Price Analysis – Key Support and Resistance LevelsThis chart provides a detailed technical analysis of the EUR/USD currency pair. The Key Resistance Level at 1.20380 USD is a crucial point where the price might face rejection. The Minor Resistance at 1.19214 USD and Intermediate Resistance at 1.19000 USD are important levels to watch for potential


19.03.26 Daily ForecastPairs on Watch -
FX:CADJPY : A mini breakdown on a quick loss I took this morning on this pair, and a brief explanation as to why I am still monitoring this pair in the mean time. Last year I would take a loss and hours later price would offer a re-entry that I was not ready for. Stay sharp.

See all forex ideas
Trade directly on Supercharts through our supported, fully-verified, and user-reviewed brokers.


