CRYSOUND POCKET Acoustic Imaging Camera Now Available on Kickstarter.


NEW

Products
Featured Products
Product Lines
Deliver reliable products for acoustic measurement and testing

Sensors
Provides measurement microphones, mouth simulators, ear simulators, and more for accurate acoustic measurements.

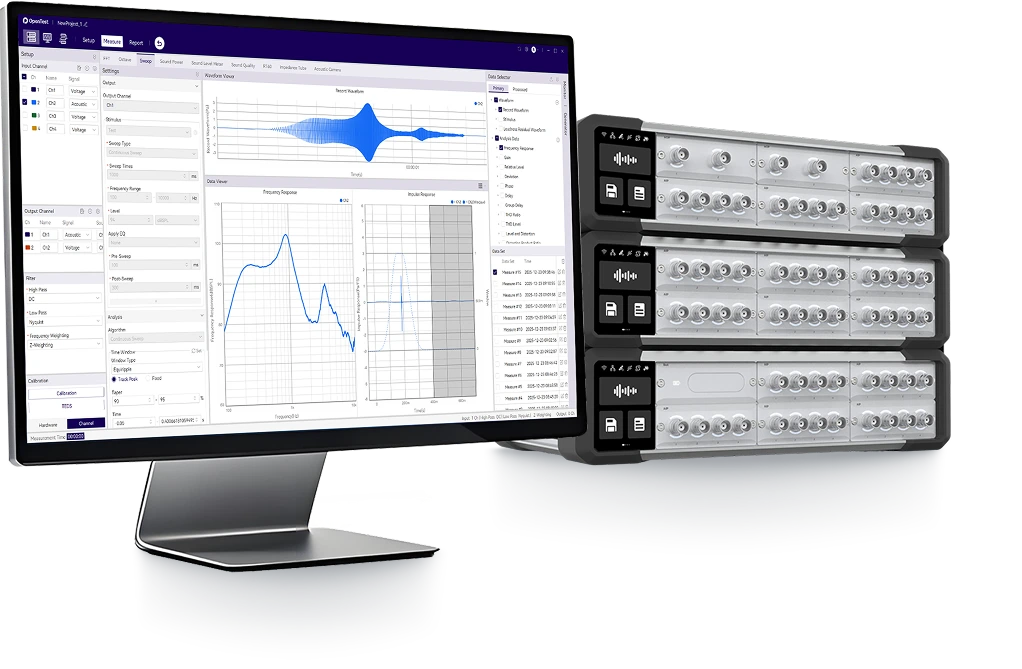
Data Acquisition
Combines hardware and software for high-speed, high-precision signal acquisition, ideal for various acoustic applications.

Acoustic Imaging
Offers acoustic cameras for gas leak detection, partial discharge, and fault diagnostics across handheld, fixed, and UAV platforms.
Noise Measurement
Includes sound level meters, noise sensors, and
monitoring systems for effective noise measurement and analysis.

Electroacoustic Test
Delivers complete electroacoustic testing solutions, including analyzers, testing software, and acoustic test boxes.
Solutions
Provide high-quality solutions for the acoustic field
Monitor all industrial noise and regulate pollution properly, fostering industrial-community harmony.
CRYSOUND provides a shell-type dual-box four-measurement solution for headphone ANC&ENC testing.
In recent years, AR/VR (Augmented Reality/Virtual Reality) technology has
Acoustic imaging technology provides an ultrasonic method for composite airtightness inspection-faster and more reliable.
Blogs
Share insights, cases and trends in acoustic testing

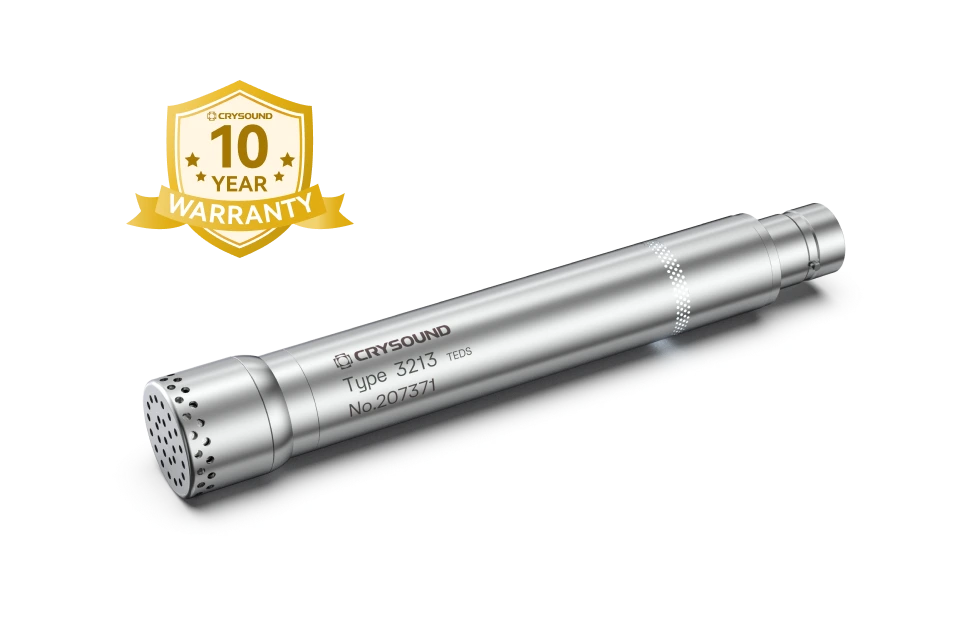
CRY3213 is a 1/2-inch prepolarized free-field microphone engineered for NVH testing in the real world - rain, dust, engine bay heat, Arctic cold. With IP67 protection and a -50°C to +125°C operating range, it delivers lab-grade accuracy without compromise, from powertrain noise to road and wind noise measurements. The Problem With Traditional Microphones Every NVH engineer knows the frustration: you need accurate acoustic data, but the test environment is anything but laboratory-perfect. Rain. Dust. Engine bay heat at 120°C. Scandinavian winter at -40°C. Vibration. Shock. Road spray. Traditional measurement microphones weren't built for this. They're precision instruments designed for controlled environments - fragile, temperature-sensitive, and one drop away from an expensive recalibration. So engineers compromise: they protect the microphone instead of optimizing the measurement, or they accept degraded data from sensors pushed beyond their limits. CRY3213 changes this equation entirely. Figure 1. CRY3213 operating in harsh road test conditions - water, mud, and debris are no obstacle A Game Changer for NVH Testing The CRY3213 is the NVH measurement microphone that delivers laboratory-grade accuracy in the harshest real-world conditions - without compromise, without babysitting, without excuses. This isn't an incremental improvement. It's a new category: the ruggedized precision NVH microphone. FeatureWhat It Means for Your Testing-50°C to +125°C operating rangeTest in Arctic cold or next to a turbo manifold - same accuracy, same reliabilityIP67 dust & water protectionContinue operating in rain, road spray, temporary water immersion, sand and dust - without extra protectionRuggedized, vibration-resistant designSurvives the shocks and vibrations of real-world vehicle testing without signal degradation50 mV/Pa sensitivityHigh output for excellent signal-to-noise ratio, even in quiet cabin measurements3.15 Hz - 20 kHz (±2 dB)Full audible bandwidth plus infrasound - captures everything from tire cavity resonance to HVAC hiss Figure 2. CRY3213 performing in extreme weather road testing Why CRY3213 Is Different Extreme Temperature Performance Most measurement microphones spec a conservative operating range. That's fine for a lab. It's useless for: Cold climate testing in Arjeplog, Sweden (-35°C) or Northern China (-40°C) Under-hood measurements where temperatures routinely exceed 100°C near exhaust manifolds and turbochargers Thermal cycling tests that swing from frozen to furnace in minutes CRY3213 operates at -50°C to +125°C with specified accuracy. No warm-up drift. No thermal shutdown. No recalibration needed between temperature extremes. When your competitors are swapping frozen microphones in the parking lot, your CRY3213 is still collecting data. IP67: Truly Weatherproof IP67 means:- 6 = Total dust ingress protection (dust-tight)- 7 = Protected against temporary immersion in water (up to 1 meter, 30 minutes) For NVH testing, this translates to:- Pass-by noise testing in rain - no test cancellations, no scrambling for covers- Road spray and puddle testing - mount microphones at wheel height without worry- Tropical humidity environments - no condensation-related signal drift- Outdoor long-term monitoring - deploy and forget CRY3213's IP67 is the highest protection class available in a precision NVH microphone. Figure 3. CRY3213 IP67 waterproof immersion testing Ruggedized and Vibration-Resistant Traditional condenser microphones are inherently precise and delicate. The CRY3213 has been systematically reinforced at the structural level for field durability, allowing it not only to measure near the vehicle, but also to be mounted directly on the vehicle for testing. Shock-resistant structural design helps withstand field handling and repeated installation/removal. Power-on LED indication enables quick confirmation of the microphone's operating status. Vibration-isolated design helps suppress mechanical interference transmitted through test benches and vehicle structures. The cable and connector system is designed for frequent connection, disconnection, and field deployment. No-Compromise Acoustic Performance Ruggedized doesn't mean reduced performance. CRY3213 delivers: Sensitivity: 50 mV/Pa (-26 dB re 1V/Pa) - matching premium lab microphones Frequency Response: 3.15 Hz to 20 kHz (±2 dB) - the full NVH bandwidth Dynamic range 17 to 136 dB - handles everything from quiet cabin to high-SPL engine bay measurements Low-frequency extension to 3.15 Hz - critical for tire cavity resonance (180-250 Hz), body boom (30-60 Hz), and powertrain low-order vibrations Prepolarized design - no external polarization voltage needed; plug-and-play with any IEPE/CCP input Application Scenarios Automotive NVH - Where CRY3213 Shines ApplicationChallengeCRY3213 AdvantagePowertrain NoiseEngine bay, 80-120°C, heavy vibrationTemperature range + vibration resistanceRoad Noise TestingOutdoor, all weather, road sprayIP67 + wide temperature rangeWind Noise TestingWind tunnel or outdoor, high airflowRuggedized + dust protectionPass-by Noise (ISO 362)Outdoor, rain or shine, year-roundIP67 enables all-weather testingCold Climate ValidationArctic conditions, -30°C to -50°C-50°C low-end operating rangeEV Motor Whine AnalysisNear e-drive, electromagnetic interferenceHigh sensitivity + vibration isolationSqueak & RattleInterior, door panels, dashboardFull bandwidth down to 3.15 HzProduction Line EOL TestFactory floor, dust, temperature swingsIP67 + rugged design for 24/7 industrial use Beyond the automotive industry, the CRY3213 is also well suited to aerospace, rail transportation, heavy industry, and the energy sector. Typical applications include engine ground run testing, interior and exterior train noise measurements, compressor and turbine noise monitoring, and wind turbine noise assessment under extreme weather conditions. Figure 4. CRY3213 installed in engine bay for powertrain noise testing Technical Specifications ParameterSpecificationType1/2" Free-field, PrepolarizedIEC StandardIEC 61094 WS2FSensitivity (±2 dB)50 mV/Pa, -26 dB re 1V/PaFrequency Response (±2 dB)3.15 Hz - 20 kHzDynamic Range (re. 20 µPa)17 dB(A) - 136 dBPower SupplyIEPE (2-20 mA)ConnectorBNCOperating Temperature-50°C to +125°CStorage Temperature-25°C to +70°COperating Humidity0-90% RH, non-condensingIP RatingIP67 (dust-tight, waterproof)Dimensions (with grid)Ø14.5 mm × 92 mmPolarization0 V (prepolarized)Weight36 g Frequently Asked Questions Q: Can I use CRY3213 with my existing NVH data acquisition system?A: Yes. CRY3213 is a prepolarized (0V) IEPE/CCP microphone, compatible with any standard constant-current input - including systems from SonoDAQ, CRY6151B, Siemens (SCADAS), HBK (LAN-XI), Dewesoft, National Instruments, HEAD acoustics, and others. Q: How does it handle rapid temperature changes during thermal cycling tests?A: CRY3213 is designed for continuous operation across its full -50°C to +125°C range, including rapid transitions. The thermal compensation ensures sensitivity stability without requiring recalibration between temperature extremes. Q: Is it suitable for permanent outdoor installation?A: Yes. With IP67 protection, CRY3213 is suitable for long-term outdoor deployment. Q: What's the advantage over ordinary microphones for NVH?A: Compared with conventional microphones, the CRY3213 NVH microphone not only delivers more accurate measurements, but is also better suited for real-world testing conditions. With IP67 protection, an operating temperature range of -50°C to +125°C, and excellent resistance to vibration and shock, it can operate reliably in rain, dust, high heat, and extreme cold, making it ideal for vehicle road tests, under-hood measurements, and long-term outdoor monitoring. Q: 10-year warranty - what does it cover?A: CRYSOUND's 10-year warranty covers manufacturing defects and sensitivity drift beyond specification. It's one of the longest warranties in the measurement microphone industry, reflecting our confidence in CRY3213's long-term reliability. Ready to Upgrade Your NVH Testing? Stop compromising between precision and durability. CRY3213 delivers both. Request a Quote → Download Datasheet (PDF) → Compare All CRYSOUND Microphones →

CRYSOUND's CRY2830 Series sound level meters support 24/7 data center noise monitoring, helping operators maintain noise compliance records and reduce the risk of fines. As AI workloads surge and hyperscale facilities continue to expand, data center noise complaints are rising rapidly. At the same time, environmental noise regulations are becoming more stringent. In Europe, more than 109 million people - about 20% of the population - are exposed to environmental noise above 55 dB(A). Driven by compliance requirements, the acoustic analysis services market is also growing quickly, with a projected CAGR of 6.4% through 2035. This is no longer just a matter of being a good neighbor. It is now a hard compliance requirement. Without continuous monitoring, operators are essentially flying blind. Figure 1. Site overview related to data center noise monitoring and property boundary compliance. Why Data Center Noise Is Becoming a Regulatory Priority Data center noise is not just annoying - it is a public health issue. The World Health Organization has noted that chronic noise exposure above 53 dB Lden is associated with significantly higher risks of hypertension, stroke, and heart attack. Regulations in multiple regions are tightening at a visible pace: LocationRegulationKey RequirementAurora, IL, USANew Data Center Ordinance (2026)24/7 automatic noise monitoring at the property line; daytime limit of 55 dB(A), nighttime limit of 45 dB(A)Prince William County, VA, USANoise Ordinance Update (2025)Noise limits for data centers; fines of $250-$500 per violationEuropean UnionEnvironmental Noise DirectiveNoise mapping, action plans, and a 55 dB(A) Lden threshold The trend is clear: what used to rely on self-discipline is quickly becoming a legal obligation. Figure 2. Environmental context relevant to data center noise compliance and surrounding sensitive areas. The Real Cost of Non-Compliance A fine of $250 to $500 per violation may not look serious for billion-dollar operators, but the actual cost goes far beyond the amount of the penalty itself: Project delays and permit rejection: Projects that cannot prove noise compliance at the planning stage may be rejected or delayed indefinitely. High retrofit costs: Emergency installation of acoustic enclosures after community complaints is extremely expensive, while early sound level assessment during design and operation can prevent that cost. Damage to reputation and community relations: Noise complaints erode community goodwill faster than almost any other issue. Operational restrictions: Some ordinances may force operators to reduce cooling capacity at night, directly affecting uptime and SLA commitments. Using the CRY2830 Series to Take Control Continuous noise monitoring is not only about compliance - it is about proactive control. For the demanding requirements of 24/7 outdoor monitoring in data centers, ordinary handheld instruments are not enough. The CRYSOUND CRY2830 Series sound level meters, when used with the dedicated outdoor protection kit, provide a practical high-accuracy solution for long-term compliance monitoring. Meets international standards for defensible reporting The foundation of compliance is reliable and legally defensible data. The CRY2833 sound level meter meets IEC 61672-1:2013 Class 1 requirements, helping ensure that reports submitted to regulators are credible, traceable, and technically sound. Outdoor protection for long-term boundary monitoring A sound level meter used at the property boundary must operate continuously in outdoor conditions. When paired with the NA41 outdoor protection kit, the system reaches IP65 protection, helping resist dust and water splashes. Its windscreen can still reduce wind noise by more than 30 dB at 10 m/s, which is especially important for capturing real equipment noise in harsh weather conditions. Figure 3. CRY2833 and CRY2834 with windscreen for outdoor data center noise monitoring. Captures low-frequency hum with octave analysis One of the most common complaints around data centers is the low-frequency hum generated by cooling equipment in the 63-250 Hz range. Standard A-weighted measurement can underestimate this problem. The CRY2830 Series supports both 1/1 octave and 1/3 octave analysis, making it easier to identify and evaluate these hidden low-frequency noise sources. Continuous logging and alarm-ready monitoring The system includes a built-in 32 GB microSD card for continuous data logging, with data automatically saved in standard CSV format. This makes it easier to build long-term compliance records and export measurement data for review. Flexible connectivity and system integration The CRY2830 Series also offers multiple interfaces, including Bluetooth, WiFi, RS232, and USB, making it easier to integrate sound level data into an existing BMS or cloud dashboard for remote access and long-term management. Figure 4. CRY2833 and CRY2834 interface options for data logging and system integration. Best Practices for Deployment Start with a baseline survey: Before installing permanent monitoring equipment, carry out a full noise survey to establish background noise levels and identify dominant noise sources. Use strategic placement with outdoor protection: Deploy the CRY2833 with the NA41 outdoor protection kit at property boundary points closest to sensitive receivers such as residential areas. Monitor low-frequency noise and use smart triggers: Enable 1/3 octave analysis to flag low-frequency issues and set threshold-based triggers for automatic recording when needed. Generate compliance-ready records: Export standard CSV measurement data regularly so that you have a defensible record available for any future noise complaint or regulatory review. Conclusion The data center industry is reaching a turning point. Regulations are tightening, and the cost of non-compliance already far exceeds the investment required for a professional sound monitoring system. 24/7 sound level monitoring is not a regulatory burden - it is an operational advantage. It gives operators better data, better decisions, stronger community relations, and written proof that they are doing the right thing. To learn more, explore the CRY2830 Series and contact CRYSOUND for a customized data center noise compliance solution.

By Bowen · Application Engineer at CRYSOUND Compressed air leaks rarely announce themselves as a major failure. More often, they sit in the background: a hiss at a fitting, a loss point on an overhead run, a manifold that never seems quite stable, a line that stays pressurized when it does not need to. Small individually. Expensive in aggregate. That is why leaks are easy to underestimate. They do not always stop production, but they do keep drawing power and eroding usable system capacity day after day. The U.S. Department of Energy and ENERGY STAR both note that leaks can account for roughly 20% to 30% of compressed air system output in a typical plant, and ENERGY STAR adds that poorly maintained systems may lose 20% to 50% of their compressed air to leaks. A compressed air leak cost calculator can help quantify that burden. Once losses reach that range, the issue is no longer housekeeping. It is an operating-cost problem and a maintenance-priority problem. Why air leaks cost more than they look Air leaks cost more than they look because they consume both electricity and capacity. The obvious loss is energy: compressors are producing air the plant never uses. The less obvious loss is system headroom. When enough air escapes through avoidable leaks, the plant may start seeing pressure instability, slower recovery after peak demand, or equipment that feels short of air even though compressor capacity on paper should be adequate. That is why leaks often surface as symptoms before they are treated as root causes. Teams may notice unstable downstream pressure, poor actuator response, longer recovery time, or compressors that seem to be working harder than expected. The first reaction is often to adjust pressure setpoints, add capacity, or tune controls. Sometimes the simpler truth is that too much air is leaving the system before it ever reaches productive use. Compressed air leak cost: the yearly operating cost associated with compressed air that your system generates, but your plant never uses because it escapes through avoidable leaks. ENERGY STAR draws a useful contrast here. In a plant with an active leak program, losses may be kept below 10%. In a poorly maintained system, the leak share can be far higher. That gap turns leaks from background noise into a measurable operating expense. Where compressed air leaks usually hide in real plants In most plants, compressed air does not disappear through one spectacular failure. It leaks away through ordinary connection points that are easy to ignore because each one looks minor on its own. Typical leak locations include: quick-connect fittings and couplings hoses and hose-end connections threaded joints FRL assemblies and valve manifolds drains, traps, and condensate components aging seals in cylinders or actuators idle machines that stay pressurized when they do not need to be overhead distribution lines that are physically hard to inspect Some of these are simple bench-level fixes. Others are difficult mainly because of access and visibility. Overhead piping, dense manifolds, crowded mechanical spaces, and background noise all make it harder to localize the exact point of loss quickly. That is one reason leak programs stall even when everybody agrees the system probably has leaks. Why teams know leaks exist but still struggle to fix them Most plants do not lack awareness. They lack a repeatable path from suspicion to action. There are several reasons for that: the leak burden is spread across many assets rather than one dramatic failure background plant noise makes traditional listening unreliable overhead or crowded geometry slows inspection maintenance teams are asked to prioritize problems that look more urgent leadership may not see a clear financial case for dedicating time to a leak campaign Leak programs often fail at the handoff between engineering intuition and operational prioritization. The maintenance team may know leaks are present. The plant may even hear them. But if nobody can frame the cost clearly enough to justify time, and nobody can localize the leaks efficiently enough to repair them, the issue stays on the backlog. A calculator helps with the first half of that problem. It does not solve the leak. It tells the plant whether the leak problem is large enough to deserve immediate attention. Use our free calculator to estimate the business impact This article includes a lightweight compressed air leak cost calculator for that decision point. It is meant to answer one practical planning question: If our leak burden is in a realistic range, what could it be costing us per year? It supports two simple input paths: Estimate from compressor data if you know installed power, electricity cost, and runtime assumptions Use annual electricity cost if you already know the approximate yearly electricity spend for your compressed air system Compressed Air ROI How much are air leaks costing your plant? Estimate the annual cost of compressed air leaks in less than a minute. Switch between a compressor-data estimate and a direct electricity-cost shortcut. Typical planning assumption 20% Estimated leak loss rate Use the leak-loss slider to model your plant. The calculator updates live so you can stress-test different assumptions before planning repairs. Estimate from compressor data Use annual electricity cost Input assumptions Use the path that best matches what you already know about your compressed air system. Currency Affects result formatting only USD ($) EUR (€) GBP (£) CNY (¥) Total installed compressor power HP kW Electricity cost per kWh Repair budget (optional) Operating days per week Operating hours per day Annual non-production days Currency Match your annual electricity cost input USD ($) EUR (€) GBP (£) CNY (¥) Annual compressed air electricity cost Repair budget (optional) Estimated annual cost of air leaks $0 Adjust the inputs to see how compressed air leaks can turn into recurring annual spend. Annual air-system electricity cost $0 Average monthly leak cost $0 Average daily leak cost $0 Estimated payback period - Planning estimate only. This calculator helps you frame the possible business impact of compressed air leaks. It does not replace a plant energy audit or a quantified leak survey. Want to find the leaks behind this cost? Acoustic imaging helps maintenance teams see compressed air leaks faster on manifolds, fittings, and overhead lines. See acoustic leak detection solutions Assumption note: leak-loss percentage is user-defined so teams can model conservative or aggressive scenarios. The key input is the estimated leak-loss rate. That percentage is intentionally scenario-based because plants start from very different conditions. A well-managed system may justify a lower case. A site with legacy piping, recurring fitting changes, idle assets left pressurized, and no regular survey routine may justify a higher one. Use the output for planning, not for forensic accounting. Its job is to convert a suspected problem into an estimated annual exposure that can support budgeting, prioritization, and a decision on whether a leak survey should move up the queue. Why finding the leak matters more than estimating it A cost estimate is only useful if it changes field behavior. Once a plant sees that leaks may be costing thousands or tens of thousands of dollars per year, the real operational question becomes: Can we find the leaks fast enough to repair them without turning the program into a slow manual hunt? This is where many leak initiatives bog down. Estimating cost is relatively easy compared with localizing leaks across real plant geometry. A few leaks near eye level may be obvious. A larger system with overhead runs, crowded manifolds, complex drops, and tight mechanical spaces is harder. Knowing that leaks exist is not the same as being able to repair them efficiently. Execution quality depends on localization speed. If finding leaks is painfully slow, even a strong energy-saving case can lose momentum. If localization is fast and repeatable, the plant can move much more confidently from estimate to inspection to repair. How acoustic imaging helps maintenance teams localize leaks faster DOE and ENERGY STAR guidance often point maintenance teams toward ultrasonic leak detection because escaping compressed air produces high-frequency sound that is easier to detect ultrasonically than by ear in a noisy environment. That is the right starting point. In the field, though, the hard part is often not detecting that sound. It is locating the exact source quickly on a live plant floor. Acoustic imaging helps by turning that signal into a visual map. Instead of relying only on point-by-point audio cues, the inspector can see where sound energy is concentrated on top of the live scene. On dense manifolds, fittings, hose assemblies, overhead lines, and hard-to-reach drops, that visual layer can make leak localization faster and easier to document. That is especially useful when: the suspected leak zone contains many possible connection points the leak is above eye level or across a congested mechanical area the team needs to document findings for a maintenance backlog multiple leaks must be ranked and repaired efficiently If you want a fundamentals refresher on the method itself, CRYSOUND already explains the basics in What Is an Acoustic Camera? and How Acoustic Imaging Works. Some acoustic imaging workflows also support leak-severity assessment, which matters when a plant is trying to prioritize repairs instead of treating every leak as equal. For plants doing regular compressed-air inspections, CRYSOUND's handheld lineup fits that workflow directly: the CRY8124 Advanced Acoustic Imaging Camera provides a higher-resolution handheld option with 200 microphones and a 2-100 kHz frequency range, while the CRY2623 128-Mic Industrial Acoustic Imaging Camera offers 128 microphones, a 2-48 kHz frequency range, and support for gas/vacuum leak detection and leak rating in a rugged industrial format. Plants do not buy inspection tools because leak math is interesting. They buy them because once the cost is visible, they need a practical way to find and fix the leaks behind the number. A practical workflow: estimate → inspect → repair → verify Once the plant accepts that leaks are carrying real cost, the next steps do not need to be complicated. Estimate the exposure. Use the calculator to test low, mid, and high leak-loss scenarios and decide whether the annual burden justifies focused action. Inspect the likely problem zones. Start with compressors, dryers, headers, manifolds, drops, hoses, valve packs, and idle equipment that stays pressurized. Repair the most valuable leaks first. Rank issues by probable severity, accessibility, safety, and operational impact rather than trying to fix everything at once. Verify and repeat. Re-inspect repaired areas, document recurring patterns, and turn leak detection into a maintenance routine instead of a one-off campaign. This workflow is deliberately practical. A plant does not need perfect certainty to start. It needs enough confidence that the waste is real, enough visibility to localize leaks efficiently, and enough follow-through to keep repairs from becoming a one-time campaign. FAQ How accurate is this compressed air leak cost calculator? It is a planning estimator, not an audit-grade model. Its job is to frame annual exposure quickly by using realistic operating assumptions and a user-defined leak-loss percentage. What leak-loss percentage should I start with? If you do not know your current leak level, 20% is a practical starting case. DOE and ENERGY STAR both identify that range as common enough to deserve attention, and you can compare it against lower and higher scenarios. Why not just estimate the savings and skip leak detection? Because the estimate does not tell you where the leaks are. Plants still need an inspection method that turns a cost problem into a repair list. When does acoustic imaging make the biggest difference? It is most useful when the leak is hard to localize quickly by ear or with manual point-by-point search, especially on overhead lines, dense manifolds, crowded mechanical spaces, and multiple-connection assemblies. Estimate the cost, locate the leaks, and turn the result into repairs. If your annual loss is already large enough to justify action, talk with CRYSOUND about acoustic leak detection solutions. Sources U.S. Department of Energy, Improve Compressed Air System Performance: A Sourcebook for Industry - https://www.energy.gov/eere/amo/improve-compressed-air-system-performance-sourcebook-industry ENERGY STAR, Compressed Air System Leaks - https://www.energystar.gov/industrial_plants/earn_recognition/small_manufacturing/guide/compressed_air_system_leaks U.S. Department of Energy, AIRMaster+ - https://www.energy.gov/eere/amo/articles/airmaster

As the core component of measurement chains, the long-term stability of measuring microphones directly impacts the comparability and traceability of measurement data. The 10-year limited warranty (hereinafter referred to as the 10-year warranty) is not merely a service commitment, but a comprehensive capability demonstrated through manufacturing consistency control, reliability verification systems, and traceable evidence chains. This article will outline the engineering implementation approach to explain the rationale behind CRYSOUND's 10-year warranty, and evaluate the impact of this warranty strategy on user lifecycle costs (including maintenance, logistics, downtime, and management costs) based on the Total Cost of Ownership (TCO) framework. Economic Value of 10-year Warranty: Budgeting Life Cycle Risk Cost For both laboratories and production lines, the "cost" of microphones constitutes only a fraction of total expenses. The bulk of costs stems from project downtime, retesting and rework, temporary replacements, cross-regional repairs, and administrative complexities. When the warranty period covers a larger portion of the equipment's service life, users can plan risks and resources more clearly within lifecycle budgets. This is the true value of a Ten-Year Warranty. Engineering Foundation of 10-year Warranty: Reliability Design, Manufacturing and Verification System Manufacturing Process Capability and Consistency Control: Raw Material Validation and 102 Critical Processes Long-term stability primarily stems from consistency. CRYSOUND begins with raw material validation, preemptively identifying and eliminating risks such as corrosion resistance and insulation stability during the incoming material stage. Subsequently, each measuring microphone must undergo 102 stringent processes, with real-time monitoring during precision machining to ensure consistency in critical dimensions and fit. Selection of Critical Materials and Assembly Process Control: Physical Basis of Long-term Stability Key components are assembled by experienced technical experts, utilizing materials with high insulation and low temperature sensitivity to enhance environmental stability. As the core acoustic structure, the third-generation titanium diaphragm technology emphasizes performance objectives such as wide frequency response, high sensitivity, corrosion resistance, and magnetic insensitivity, employing structural and material design to mitigate long-term drift risks. Typical Failure Mechanism and Verification Coverage Matrix The long-term stability of microphones is typically compromised not by a single factor, but by cumulative effects of humidity, temperature, mechanical shocks, and contamination, leading to performance drift or noise degradation. Below is a comparison table illustrating how CRYSOUND maps these typical risks to manufacturing control points and factory verification: Typical risk/failure modeEngineering control pointCorresponding Verification / ScreeningMoisture causes noise to rise sensitivity fluctuationClean Assembly,Insulation Design and Process ControlHigh humidity prolonged test, insulation-related verification (sensitivity pre/post difference / base noise variation / insulation stability)Temperature change-induced driftMaterials and structural stability, assembly consistencyLong-term temperature cycling (sensitivity/frequency response changes, noise trends, structural and connection stability)Structural deflection caused by drop/vibrationStructural strength and assembly processDrop test, bidirectional vibration test (function output stability, key index difference before and after, structural integrity)Pollution/Particulate Matter Causes Noise DegradationUltrasonic cleaning, cleanroom commissioningComprehensive factory noise/performance testing (including noise floor, sensitivity, frequency response consistency, etc.)Corrosion/salt spray leads to reduced appearance and connection reliabilityCorrosion-resistant Material Screening, Surface Treatment and Connector Protection DesignSalt spray exposure/retention + Appearance and connection reliability verification Clean Manufacturing and Pollution Control: Noise and Long-term Stability Fine particles, oil contaminants, and impurities can amplify into noise elevation or performance fluctuations during prolonged use. To mitigate this, each measuring microphone undergoes ultrasonic cleaning and precision calibration in a cleanroom environment, thereby reducing the risk of contamination and foreign object introduction, ensuring low-noise and moisture-resistant performance at the source. Factory Reliability Verification Scheme: Environmental/Mechanical/Electrical Stress Verification A decade-long warranty hinges on systematic coverage of typical service environments and operational conditions. CRYSOUND's factory reliability verification adopts a fundamental approach of "representative environmental and mechanical stress coverage + critical risk coverage," categorizing verification items into three types: environmental stress (humidity, temperature cycling, salt spray), mechanical stress (drop/impact/vibration), and electrical reliability (insulation and leakage risks). This system screens and validates material, assembly, and connection weaknesses through stress coverage of humidity, temperature cycling, salt spray, and drop/vibration conditions before delivery, thereby reducing on-site failure risks. The high-humidity long-term validation examines how humidity affects microphone performance. Under controlled high-humidity conditions, the device undergoes continuous exposure to simulate prolonged moisture exposure, covering risks like insulation degradation, noise performance changes, and stability fluctuations. This is followed by retesting and electrical status verification to confirm the product's stability and consistency under thermal-humidity stress. High and Low Temperature Cycling Validation addresses structural and assembly robustness risks under temperature variation conditions. By conducting prolonged cycles between extreme temperature extremes, it accelerates exposure to potential issues including material thermal expansion differences, stress release, and joint stability. The engineering objective of this validation is to assess performance drift risks and connection/assembly stability under long-term temperature disturbances, thereby reducing the probability of post-delivery anomalies triggered by thermal stress. Salt spray testing addresses material and joint reliability risks in coastal, high-salt, or corrosive environments. By exposing components to controlled salt spray conditions, it evaluates the corrosion resistance of metal parts, joints, and protective designs. The process also includes visual inspection of joints and functional/electrical verification, effectively mitigating corrosion-induced reliability degradation and long-term stability risks. Note: Salt spray validation is used to evaluate the robustness of protection and connection under typical exposure conditions. For long-term operation in harsh environments such as strong corrosion or high salt spray conditions that exceed the product's usage specifications, additional protection measures must be implemented, with the warranty terms as the ultimate reference. Mechanical stress verification (Drop/vibration/Shock) addresses mechanical disturbance risks during transportation, installation, disassembly, and field operation. It involves simulating repeated 1-meter drop handling and accidental impacts through specified cycles, replicating transportation vibrations and prolonged mechanical disturbances via continuous vibration tests, and assessing transient stresses under higher intensity through impact validation. The core objective of mechanical verification is to screen structural integrity, assembly stability, and connection reliability, thereby reducing post-delivery risks of intermittent anomalies and performance variations caused by micro-loosening, connector stress, or assembly misalignment. As a baseline control for electrical reliability, insulation verification addresses risks of leakage, breakdown, or instability caused by moisture, pollution, and material aging. It verifies the insulation performance of critical electrical paths and, when necessary, conducts post-stress environmental reviews to ensure the product maintains stable electrical safety and signal reliability throughout its lifecycle. All aforementioned validation items are implemented in accordance with the company's internal factory inspection specifications, accompanied by procedures for anomaly isolation, re-inspection, and disposal. Products identified with anomalies during the validation process will not proceed to the delivery phase. CRYSOUND 10-year warranty key points Main pointsExplanationScope of applicationApplicable to 3000 series: microphones, preamplifiers, kits, dummy mouthpieces, dummy earpieces, and complete sets (traceable via nameplate/serial number).Warranty Duration DifferencesThe main equipment typically has a lifespan of ten years; accessories/consumables (such as wind shields, cables, connectors, seals, etc.) have a lifespan of six months and should be separately included in the maintenance budget.Start methodPriority is determined by the outbound/delivery date; if no voucher is available, by the end user's purchase date; if still unavailable, by the last date traceable by the factory date or serial number.Warranty contentConfirm material or process defects: Free repair (necessary parts + labor) or replacement with the same model/performance equivalent to the original (possibly certified refurbishment/remanufacturing).Typical non-protectionMisuse/abuse, drop and compression, liquid immersion, corrosive gases/salt spray, overvoltage/reverse connection/ESD/surge, unauthorized disassembly/repair, etc.Calibration apertureCalibration drift within the specified range is a common phenomenon in metrology and does not constitute a manufacturing defect; calibration/recalibration is typically a paid service (unless the drift is confirmed to be caused by a manufacturing defect).Logistics and Cross-borderDefault rule: Users within the warranty scope are responsible for round-trip shipping costs. Cross-border transactions may incur tariffs, customs clearance fees, or taxes, which are typically borne by the user unless otherwise agreed in the contract. Visit https://www.crysound.com/warranty for more information How A Ten-Year Warranty Affects TCO: Cost Structure and Budget Strategy TCO scope and boundary conditions The TCO (Total Cost of Ownership) discussed herein refers to the "total cost" of equipment throughout its lifecycle, encompassing not only the purchase price but also measurement and maintenance, logistics turnover, downtime, and management costs. It is crucial to clarify that warranty coverage addresses "failure risks caused by material/process defects," while calibration/recalibration focuses on "measurement traceability and drift management." Unless testing confirms drift stems from manufacturing defects, calibration/recalibration and measurement certificate updates are typically not covered by free warranty. Users should budget for these as annual predictable costs. Meanwhile, logistics and cross-border costs related to repairs/services should be factored into the TCO calculation upfront. By default, users are responsible for round-trip shipping within the warranty period. Cross-border transactions may incur tariffs, customs clearance fees, or taxes, which are typically borne by the user unless otherwise stipulated in the contract. TCO cost decomposition model and accounting subject A simple model can help you understand the lifecycle cost of a microphone. TCO = Procurement cost + Calibration/recalibration cost + Logistics/cross-border cost + Consumables and accessories replacement + Unplanned downtime/re-testing/rework + Management cost (ledger/compliance/traceability) The Impact of 10-year Warranty on Risk-related Costs: Emergency Expenditure Reduction and Management Cost Optimization Cost reduction for unplanned maintenance/replacement: Material/process defects triggering repairs or replacements are covered by the warranty mechanism, reducing the likelihood of unexpected expenses and emergency procurement. Reduced downtime and retest/rework costs: With enhanced equipment stability and manageable risks during the warranty period, projects experience fewer instances of temporary failures, abnormal fluctuations, or the need for downtime, retesting, or rework. Reduced diagnostic and communication costs: Serial number traceability, historical data, and certificate records can lower localization costs, minimize unnecessary back-and-forth and redundant testing, and enhance processing efficiency. Projected operating costs: annual budget proposal Calibration/Recalibration (annual budgeting recommended): Minor drift in measuring instruments is normal. It is recommended to calibrate at least once every 12 months or as required by the system; verification or recalibration should be performed after high humidity, high temperature, strong vibration, or frequent disassembly and assembly. Supplies/Consumables (replenishment budget recommended): Windproof covers, cables, seals, etc. should be procured according to consumables regulations and replacement cycles to avoid downtime and temporary procurement costs caused by 'small components'. Logistics/International (budget should be allocated separately by scenario): By default, round-trip shipping costs, international customs duties, and clearance fees should be included in advance, especially for multi-location projects and cross-border scenarios. 10-year TCO estimation template Use the table below to quickly build your TCO estimate for procurement or asset inventory: Cost elementInput/AssumptionNotes (How to be affected by the 10-year warranty)Equipment procurementQuantity, Unit Price (RMB per unit)Procurement price is not the whole picture, but it determines the asset baseline Annual calibration/recalibrationFrequency (times/year), per-visit cost (yuan)Typically paid; recommended at least once every 12 monthsAttachments/SuppliesReplacement cycle and unit pricePlan according to the 6-month/consumable ruleLogistics/InternationalRound-trip freight, customs duties and clearanceThe default user assumes responsibility; cross-border scenarios require a separate listingDowntime costCost per outage, annual occurrencesReliability Improvement and Quality Assurance to Reduce the Probability of Unplanned OutagesRetest and reworkSingle rework cost, annual occurrencePerformance and Stability Reduction,Rework and Controversy Cost Accompanying Management of 10-year Warranty: Usage, Calibration and Asset Ledger Asset ledger and traceability information management: serial number-certificate-data association Enter the serial number and model (photograph for archiving), and bind the calibration certificate with factory data. Record critical operating conditions: temperature and humidity, presence of strong vibrations, and frequency of disassembly and assembly. When an exception occurs, prioritize reproducing the standard steps and retaining records (screenshots, waveforms, or comparison data). Usage and Handling Guidelines: Reducing Non-Guarantee Risks Avoid drops, compression, liquid immersion, and corrosive environments; power supply and connections shall be performed in accordance with the instructions. Unauthorized disassembly and repair are strictly prohibited. Ensure the nameplate/serial number is clearly identifiable. Use the original packaging or equivalent protective measures during repair/reinspection, and install protective covers/dust caps on precision interfaces. Repair Information List: Shorten the Location and Processing Cycle Model and serial number photos; purchase/delivery certificates. Fault description (scenario, frequency, environmental conditions, power supply and connection method). Reproducible test records (frequency response, sensitivity, noise, distortion, or system screenshots/waveforms). Conclusion: Ten-year warranty engineering logic and user value The ten-year warranty is built upon a verifiable, traceable, and operational engineering closed loop: reducing consistency risks through manufacturing process capability control, covering typical failure scenarios via environmental and mechanical stress validation, and supporting warranty determination and service efficiency with serial numbers and data records. For users, its value lies not only in fault handling itself but also in reducing the uncertainty of unplanned downtime and emergency replacements, making the lifecycle cost of measurement systems more predictable and easier to incorporate into annual budget management.


