The post The Secret Ingredient in the Alphabet Soup of Cybersecurity appeared first on thatDot.
]]>
This is the first in a series of blogs exploring how the Quine Streaming Graph analytics engine is the secret ingredient in the Alphabet Soup of cybersecurity, enabling faster, more accurate detection of complex threats without compromising on the type or volume of data analyzed, the fidelity of alerts or response time.
The Dilemma of Data in Cybersecurity
As we all know, the letter combinations in cybersecurity continue to grow, sometimes falling out of view, floating just under the surface, and others rising to the top. These letter combinations include network protection (NDR, NTA, ID/PS), endpoint (XDR, FIM, EPP, EDR, HIPS), or cloud (CWPP, CSPM, and CNAPP). Despite their diversity, these solutions all face a shared challenge: the amount of data they need to analyze and how to go about it.
Including the correct information in the analysis process is a delicate balance – like that right balance of herbs and spices in our favorite meal. It is no simple task to determine which data to analyze and how to do it efficiently without the risk of false positives/negatives. The current approach is to look at it in subsets and cohorts, but never holistically. In some cases, this decision is warranted; the data is irrelevant – that ingredient simply does not go into our meal. However, this process frequently results in context being left on the proverbial cutting board, and the data so watered down it is useless.
A New Paradigm: Data Analysis Without Compromise
Imagine the following what ifs: what if we didn’t have to exclude relevant data? what if you did not need to leave relevant data on the cutting board? what if we could analyze all data for any time – past, present, or future?
With thatDot’s Quine Streaming Graph, you can continuously analyze real-time and historical data at scale to identify complex patterns and enable your solution to trigger an action within milliseconds.
This enables product owners to reenvision current features and approaches—moving from periodic batch processing to real-time analytics. For cybersecurity vendors, this changes the game. Instead of relying on batch processing or overlooking key data for speed, you can achieve instant notifications to trigger mitigation and containment routines.
What’s Next?
There are various ways in which we intend to explore adding thatDot to various cybersecurity solutions to see what we can cook up. Each of these is either not done adequately or only viable with lots of development time, custom code, and homegrown analysis pipelines, such as:
- Identifying attack paths
- Triggering immediate response
- Continuous enrichment of event data
- Identify even the most latent of patterns
- Real-time as well as “point-in-time” visibility
- Context-Aware Threat Intelligence
- Real-time MITRE TTP Awareness
These are problems that can be solved in other ways; however, how long does it take to develop each successive detection pipeline? Other than time to market, what else are you giving up? It may be avoiding asking too complex a question or inspecting a tiny sliver of time? Or just settling for pseudo and “near” real-time analysis? Let’s explore Quine, drop some of those qualifiers, and make something great!
Learn More
Check out these resources:
- Are You Ready for Low and Slow Auth Attacks Blog Post
- Quine for cybersecurity and fraud use cases
- Download Quine
The post The Secret Ingredient in the Alphabet Soup of Cybersecurity appeared first on thatDot.
]]>The post Stream Processing World Meets Streaming Graph at Current 2024 appeared first on thatDot.
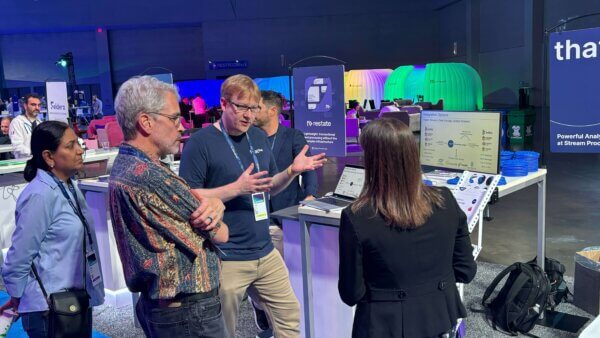
]]>The thatDot team had a great time last week at Confluent’s big conference, Current 2024. Our apologies to anyone that may have been hit. Attendees and exhibitors alike loved the thatDot Frisbees. We spoke with multiple attendees, learned about the challenges the stream processing community have when trying to do their jobs with KSQLDB or Flink in their data pipelines. We helped them understand how thatDot would fit into their architecture and how our approach to stream processing – thatDot Streaming Graph – can scale to meet their demands while solving deeper problems that challenge the key-value/relational models of other stream processors.
Will Flink fail at practical stream processing like Streams and KSQLDB did?
Some attendees mentioned that over the years Confluent has introduced two other technologies intended to provide stream processing in Kafka pipelines. The first technology introduced for event stream processing was Kafka Streams, but people were not satisfied with its capabilities. Then KSQLDB was the way to go. But that didn’t work quite as advertised, either.
Now Flink is the new technology touted to solve the problems of previous stream processing engines. Yet, Flink practitioners know that the complexity inherent in Flink operations necessitates a high level of expertise to run it. Out-of-memory errors due to making time windows too wide, or trying to join too many things across data streams were common problems people reported. We heard a repeated question from attendees about how long it will likely be until Confluent starts looking for the next stream processing technology.
As an industry, we keep doing the same thing over and over again and expecting a different result–the definition of insanity. By continuing to use the same relational key/value type of mindset to process data with every stream processor, we continue to run into the same problems.
Advantages of stream processors and graph data models
For years, people have understood the power of graph data to connect the dots and see the big contextual picture. But graph databases have the same problem as any other database, the data is no longer real-time streaming. It’s at rest. That inherently makes data analysis too slow for some of the most important and urgent actions a stream processor is needed for, like catching cybersecurity intrusions or stopping a fraudulent transaction.
Ryan wright always says, “Answers now are always better than answers later.” Graph analysis that can work with modern data volumes at stream processor speed is a paradigm shift. You get the answers to deep questions fast. Instead of finding out months or even days later that you were breached, or your company was ripped off, you can stop problems before they cost you.
Advantages of thatDot Streaming Graph
Some of the advantages the attendees of Confluent told us they found most compelling about thatDot Streaming Graph included:
- Simplicity at scale – Flink has to manage current state and do complex logic for fault tolerance such as checkpoints/save points. Streaming graph doesn’t require any of that. Dynamic graph technologies don’t require state management, and high availability in our stream processor is more automatic. thatDot is far simpler to use, even at high scale.
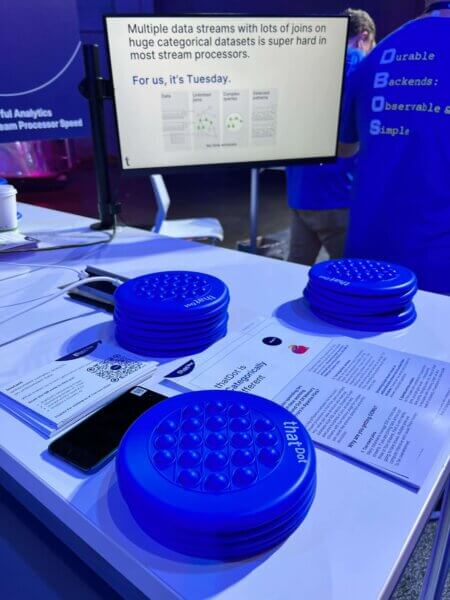
- Unlimited joins – For a relational key/value data model like Flink uses, multiple joins are difficult and memory intensive. For thatDot’s graph data model, unlimited joins in stream processing are the normal way we do things.
- Categorical analysis – Most analytic tools can only analyze numbers. This means if you want to analyze people, places, events, locations, etc., you have to convert that data into wide, sparse numeric data, rest it in a database, analyze it, then turn it back into categorical data to get a final, understandable if a bit muddy answer. Having to rest the data before analysis slows response time hugely, and even then, your answer is likely to be unclear and inaccurate. thatDot analyzes categorical data directly, right in the stream processor.
- Time unbound analysis – An event stream processor taking unbounded data streams and chopping them into little time-bounded chunks in order to analyze them has always been a workaround in our opinion. thatDot analyzes the whole data stream as it flows by, with no time window limitations. Even data stored in a file or in a database can be joined with current data. Important points from six months ago can be joined with data from six milliseconds ago to complete a picture and answer an analytical question.
Ryan’s talk on “Streaming Entity Resolution for Kafka”
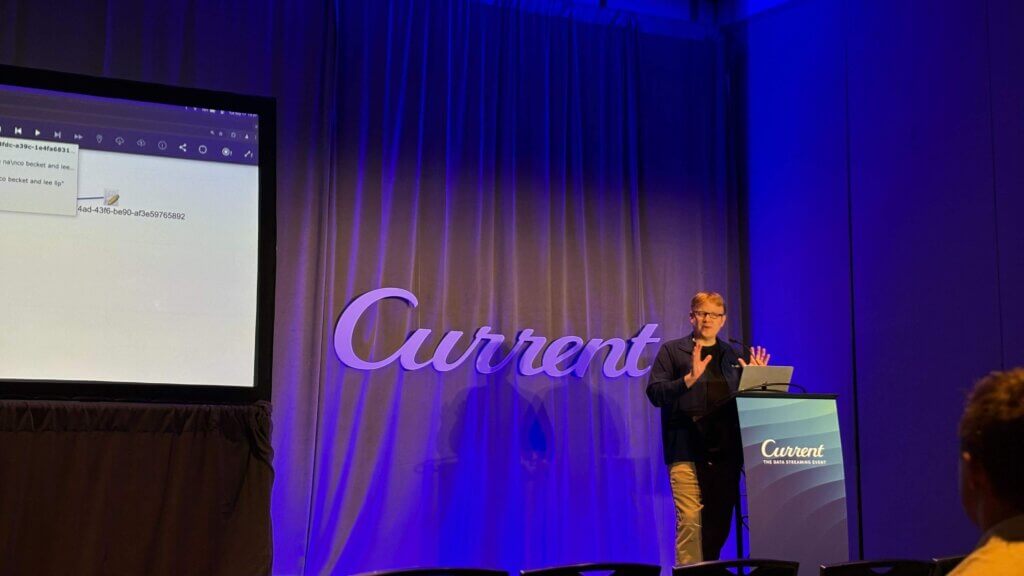
Ryan Wright, our founder and CTO, did a very cool presentation at Current on entity resolution in stream processing which caught a lot of attention, especially from data engineers and anyone working toward real-time master data management. That’s live on the Current site now. Be sure to check it out: https://current.confluent.io/2024-sessions/streaming-entity-resolution-for-kafka-with-quine
To learn more, check out the thatDot Streaming Graph product page.
Or, try the Streaming Graph or Novelty free trial for yourself.
Get the handouts we gave to Current attendees.
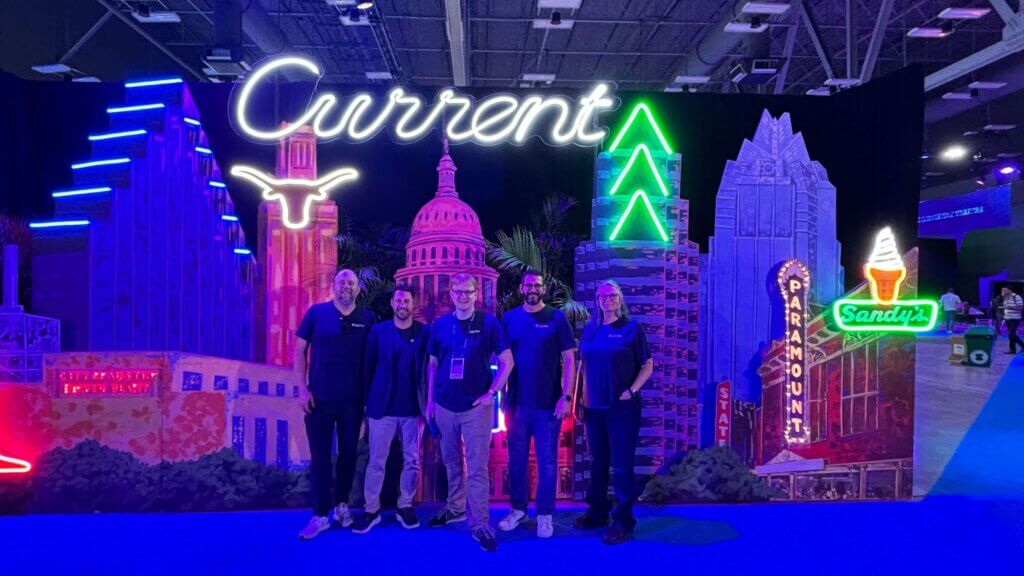
And be sure to catch the thatDot team at Current 2025!
The post Stream Processing World Meets Streaming Graph at Current 2024 appeared first on thatDot.
]]>The post Streaming Graph Get Started appeared first on thatDot.
]]>It’s been said that graphs are everywhere. Graph-based data models provide a flexible and intuitive way to represent complex relationships and interconnectedness in data. They are particularly well-suited for scenarios where relationships and patterns are important, but until recently, they have been confined to a handful of use cases – databases, chip design, information theory, AI – that all have one thing in common: the data in question is stored first and then processed, usually as a batch job.
In other words, the data in these use cases is at rest. However, what about data in motion, data in event-driven use cases that is constantly changing and being transmitted? As event-driven applications and operational intelligence scenarios, such as real-time monitoring, situational intelligence, and fraud detection, continue to expand rapidly, graph data models and the primary query language used for them, Cypher, are proving much more versatile than SQL and the best tools for the task.
Consider the challenge of extracting insights from a complex event stream. The stream may have high volume and velocity, require the correlation of events by context from multiple sources, contain meaningful event patterns, and have a short timeframe to identify, detect, and take action. Addressing these challenges requires efficient data processing, scalable infrastructure, and effective event modeling techniques in graph solutions and Cypher.
Graph databases are useful for batch processing a portion of a complex event stream to provide macro-level insights and metrics to understand events but not take action. The same concepts (patterns and algorithms) used in graph databases when the event stream is at rest can be applied to an event stream while in motion using a streaming graph like Quine, often directly reusing the Cypher written in the database. Here’s how Cypher addresses the challenges found in complex event streams:
- Pattern Matching: Cypher excels at pattern matching, allowing you to detect patterns (sub-graphs) in the event stream. This is particularly useful for identifying sequences of events or detecting specific patterns, allowing you to efficiently filter and process relevant events based on their relationships and properties.
- Event Correlation: You can define relationships between events and other entities, such as users, devices, or locations. This enables you to correlate events based on common attributes or shared relationships, often with high cardinality and a mix of categorical and numerical data, to identify patterns, anomalies, or complex dependencies.
- Time-based Queries: Cypher provides temporal capabilities, allowing you to query and analyze events based on their timestamps or time intervals. You can filter events based on specific time ranges, compare temporal values, and perform time-based aggregations. This enables you to process time-dependent patterns, detect trends, and perform time window-based computations on the event stream.
- Real-time Insights: You can continuously execute Cypher queries on an incoming event stream, allowing for dynamic analysis and near real-time decision-making. This enables you to monitor, detect patterns, and trigger actions based on the evolving stream of events.
Event Pattern Detection
Specifying a pattern (sub-graph) to MATCH can identify specific sequences of events or combinations of events of interest. For example, when observing the efficiency of cache nodes in a CDN network, Cypher can easily identify when a series (10) of cache misses occur and send an alert to the NOC to trigger an investigation.
The Cypher required to detect a MISS event only needs to identify the node types and relationships as a pattern.
MATCH (server1:server)<-[:TARGETED]-(event1 {cache_class:"MISS"})-[:REQUESTED]->(asset)<-[:REQUESTED]-(event2 {cache_class:"MISS"})-[:TARGETED]->(server2:server)
RETURN DISTINCT id(event1) AS event1
Then, additional Cypher processes the event to take action, recording it as a metric or sending an alert if the metric constraint is exceeded. This technique is demonstrated in the CDN Observability recipe. An unexpected challenge
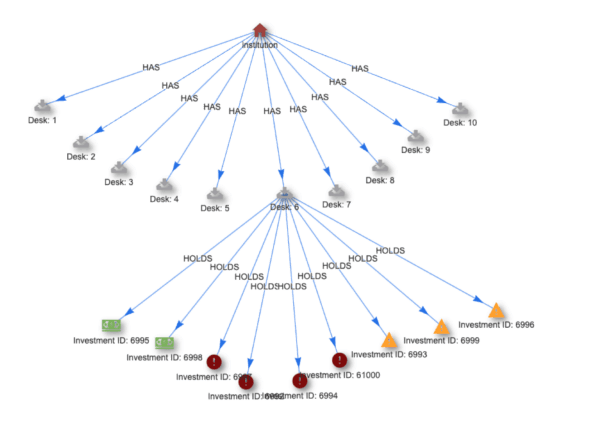
Cypher can respond to changes in the event stream in real time, allowing organizations to reduce the risk associated with a condition’s duration before it is analyzed and addressed. For example, the Financial Risk Calculation recipe models market changes in real-time so that organizations can provide adequate coverage for risk exposure while ensuring their regulatory compliance minimally affects their asset allocation. As basic patterns are matched, results are passed to business logic written in Cypher to generate an adjusted trading value, correlate (roll-up) trading events across the network, and trigger an alert when the trading system is out of compliance. When a pattern match query detects an investment pattern, it triggers an output query to process the StandingQueryResult.
For example, the result returned from an investment pattern in Cypher:
MATCH MATCH (investment:investment)<-[:HOLDS]-(desk:desk)<-[:HAS]-(institution:institution)
RETURN DISTINCT id(investment) AS id
Triggers business logic in Cypher to generate a new property with a value based on the nodes investment.class property.SET investment.adjustedValue = CASE
 WHEN investment.class = '1' THEN investment.value WHEN investment.class = '2a' THEN investment.value * .85 WHEN investment.class = '2b' AND investment.type = 9 THEN investment.value * .75 WHEN investment.class = '2b' AND investment.type = 10 THEN investment.value * .5
END
The investment events are then correlated through a roll-up function for each investment type.
UNWIND [["1","adjustedValue1"], ["2a","adjustedValue2a"], ["2b","adjustedValue2b"]] AS stuff

WITH institution,investment,desk,stuff
WHERE investment.class = stuff[0]

CALL float.add(institution,stuff[1],investment.adjustedValue) YIELD result AS institutionAdjustedValueRollupByClass
CALL float.add(institution,"totalAdjustedValue",investment.adjustedValue) YIELD result AS institutionAdjustedValueRollup

CALL float.add(desk,stuff[1],investment.adjustedValue) YIELD result AS deskAdjustedValueRollupByClass
CALL float.add(desk,"totalAdjustedValue",investment.adjustedValue) YIELD result AS deskAdjustedValueRollup

SET institution.percentAdjustedValue2 = ((institution.adjustedValue2a + institution.adjustedValue2b)/institution.totalAdjustedValue) * 100,
institution.percentAdjustedValue2b = (institution.adjustedValue2b/institution.totalAdjustedValue) * 100
Temporal Analysis
With Cypher, you can express temporal conditions, such as events occurring within a specific time window, events happening before or after certain events, or events falling into a particular time range. This enables temporal analysis of event streams, including trend analysis, time-based aggregations, and windowed computations. For example, the temporal locality recipe looks for emails sent or received by [email protected] within a four to six-minute sliding window. The pattern query matches each individual (sender)-[:SENT_MSG]->(message)-[:RECEIVED_MSG]->(receiver) pattern containing the CTO’s email address.
MATCH (n)-[:SENT_MSG]->(m)-[:RECEIVED_MSG]->(r)
WHERE n.email="[email protected]" OR r.email="[email protected]"
RETURN id(n) as ctoId, id(m) as ctoMsgId, m.time as mTime, id(r) as recId
And then calculates the duration between the emails to generate a sub-graph containing messages that went to or from the CTO within the time window.
MATCH (n)-[:SENT_MSG]->(m)-[:RECEIVED_MSG]->(r), (thisMsg)
WHERE id(n) = $that.data.ctoId
AND id(r) = $that.data.recId
AND id(thisMsg) = $that.data.ctoMsgId
AND id(m) <> id(thisMsg)
AND duration("PT6M") > duration.between(m.time,thisMsg.time) > duration("P
CREATE (m)-[:IN_WINDOW]->(thisMsg)
CREATE (m)<-[:IN_WINDOW]-(thisMsg) WITH n, m, r, "http://localhost:8080/#MATCH" + text.urlencode(' (n)-[:SENT_MSG]->(m)-[:RECEIVED_MSG]->(r) WHERE strId(n)="' + strId(n) + '"AND strId(r)="' + strId(r) + '" AND strId(m)="' + strId(m) + '" RETURN n, r, m') a
RETURN URL
Conclusion
Cypher is a powerful and expressive query language well-suited for processing complex event streams. Quine streaming graph enables Cypher developers to leverage graph techniques early when processing a complex event stream to aggregate and shape events, detect patterns for alerting and early feedback, and perform event normalization before entering the data warehouse. Learn more and Try Quine
If you want to try Quine using your own data, here are some resources to help:
- Learn more about Quine by visiting the Quine open source project.
- Download Quine – JAR file | Docker Image | Github
- Check out the Financial Risk Calculation recipe to see how Cypher is used for real-time rollups.
- Check out demos and other videos at our YouTube channel.
The post Streaming Graph Get Started appeared first on thatDot.
]]>The post Streaming Graph for Real-Time Risk Analysis at Data Connect in Columbus 2024 appeared first on thatDot.
]]>After more than 25 years in the data management and analysis industry, I had a brand new experience. I attended a technical conference. No, that wasn’t the new thing. At many conferences, I’ve been surrounded by data scientists, business analysts, data engineers, mathematicians, developers, startup founders, CTO’s, architects, and PHD students, made network connections, listened to giants in the field, like the Chief of Information Management of the United Nations at this one. But, uniquely, at this one conference, Data Connect, organized by Women in Analytics, 9 out of 10 of those leaders in the field were women, and all the speakers were women or a gender minority.
It was a soul-filling feeling. Sometimes, it can feel isolating to be a woman in a technical field, but for 2 days, I was surrounded by smart, capable women encouraging each other and talking shop. I got a copy of Low Code AI signed by Dr. Gwendolyn Stripling who was one of the coolest people we met there, and Unmasking AI by Joy Buolamwini, both of whom gave brilliant presentations.
Risky real-time risk analysis presentation
For my presentation, I talked about a way to do powerful risk analysis in real-time. Not too surprising, the method used thatDot Streaming Graph. What was surprising is that I went out of my comfort zone for this deeply technical audience; I did a live demo of the risk analysis recipe. Live demos are always a bit nerve-wracking at conferences, and having never done one before with thatDot tech, well … talk about risky.
The presentation defined risk analysis and pointed out the failure of Washington Mutual, the largest bank failure in US history, and Silicon Valley Bank last year, the second largest bank failure in US history. Both, due largely to poor risk management. Those are just two of the over 550 banks that have failed since the turn of the century. Between a relaxation of government oversight and less than ideal risk calculation, we’re lucky our economy is still functioning.
Since the government regulations aren’t my area, I focused on the problems with current risk analysis methods, mainly that they’re batch and often take 24 or more hours to complete. Even longer if you and your bank HQ aren’t in the same time zone. Since many trades or investments have a regulated time during which a bank can decide to accept the risk and approve the trade or not, usually 24 hours, slow batch processing can expose them far too much.
Most financial institutions are shifting to graph analysis for the entity type of categorical analysis needed, but graph databases don’t scale well to the levels large banks require. Event stream processors scale just fine and are real-time by nature, but they have difficulty with the kind of deep graph analysis. So, you need something with powerful graph analytics at event stream processor speeds to get to real-time risk analysis. The risk analysis recipe uses simulated data, but does a good job of showing the speed of analysis and how it could be done.
The presentation was well-received with one person coming up and telling me they thought it was the best presentation of the conference. Wow. Now, that’s a heck of a compliment considering the caliber of presenters.
I’m looking forward to going to Data Connect again next year, and if you want to learn more about data analysis and data management, don’t miss it.
The post Streaming Graph for Real-Time Risk Analysis at Data Connect in Columbus 2024 appeared first on thatDot.
]]>The post The Power of Real-Time Entity Resolution with Ryan Wright appeared first on thatDot.
]]>Ever wondered why duplicate records keep slipping through your data streams? This September, thatDot’s Founder and CEO Ryan Wright will be addressing this critical issue at Current.
Data inconsistencies in Kafka streams, such as misspelled company names, users registering with different email addresses, or multiple bank accounts linked to the same person, can present significant challenges. These issues not only hinder the adoption of streaming data technologies but also impact organizations across the spectrum, from major banks to small startups.
Recent advancements in open-source streaming graph tools, like thatDot’s Streaming Graph powered by Quine Open Source, have made it easier to clean and resolve data in real-time. These tools offer powerful entity resolution at scale, even as data flows in motion and potentially out of order.
Event Details
Title: Streaming Entity Resolution for Kafka with Quine
Dates: September 17, 2024
Time: Tue Sep 17, 1:30 PM – 1:40 PM CDT (10 Min)

Join us on Tuesday, September 17, from 1:30 PM to 1:40 PM CDT in Breakroom 5 for an illuminating lightning talk with Ryan Wright, as we delve into two cutting-edge approaches to real-time entity resolution using the Quine Open Source streaming graph:
- Viewing Your Stream as a Graph: Leveraging event-triggered “standing queries” for real-time entity resolution.
- AI-Powered Entity Resolution: Using historical stream data to enable AI-driven resolution with graph neural networks.
In both scenarios, you’ll witness how a Kafka stream filled with messy data can be transformed into a clean, entity-resolved output.
Don’t miss this opportunity to learn how to enhance your data streams and drive better insights. Stay tuned for more updates on this event.
For more details on the event and speakers, visit Current 2024 Speakers.
The post The Power of Real-Time Entity Resolution with Ryan Wright appeared first on thatDot.
]]>The post Cypher all the things! appeared first on thatDot.
]]>It’s been said that graphs are everywhere. Graph-based data models provide a flexible and intuitive way to represent complex relationships and interconnectedness in data. They are particularly well-suited for scenarios where relationships and patterns are important, but until recently, they have been confined to a handful of use cases – databases, chip design, information theory, AI – that all have one thing in common: the data in question is stored first and then processed, usually as a batch job. In other words, the data in these use cases is at rest.
However, what about data in motion, data in event-driven use cases that is constantly changing and being transmitted? As event-driven applications and operational intelligence scenarios, such as real-time monitoring, situational intelligence, and fraud detection, continue to expand rapidly, graph data models and the primary query language used for them, Cypher, are proving much more versatile than SQL and the best tools for the task.
Consider the challenge of extracting insights from a complex event stream. The stream may have high volume and velocity, require the correlation of events by context from multiple sources, contain meaningful event patterns, and have a short timeframe to identify, detect, and take action. Addressing these challenges requires efficient data processing, scalable infrastructure, and effective event modeling techniques in graph solutions and Cypher.
Graph databases are useful for batch processing a portion of a complex event stream to provide macro-level insights and metrics to understand events but not take action. The same concepts (patterns and algorithms) used in graph databases when the event stream is at rest can be applied to an event stream while in motion using a streaming graph like Quine, often directly reusing the Cypher written in the database.
Here’s how Cypher addresses the challenges found in complex event streams:
- Pattern Matching: Cypher excels at pattern matching, allowing you to detect patterns (sub-graphs) in the event stream. This is particularly useful for identifying sequences of events or detecting specific patterns, allowing you to efficiently filter and process relevant events based on their relationships and properties.
- Event Correlation: You can define relationships between events and other entities, such as users, devices, or locations. This enables you to correlate events based on common attributes or shared relationships, often with high cardinality and a mix of categorical and numerical data, to identify patterns, anomalies, or complex dependencies.
- Time-based Queries: Cypher provides temporal capabilities, allowing you to query and analyze events based on their timestamps or time intervals. You can filter events based on specific time ranges, compare temporal values, and perform time-based aggregations. This enables you to process time-dependent patterns, detect trends, and perform time window-based computations on the event stream.
- Real-time Insights: You can continuously execute Cypher queries on an incoming event stream, allowing for dynamic analysis and near real-time decision-making. This enables you to monitor, detect patterns, and trigger actions based on the evolving stream of events.
Event Pattern Detection
Specifying a pattern (sub-graph) to MATCH can identify specific sequences of events or combinations of events of interest. For example, when observing the efficiency of cache nodes in a CDN network, Cypher can easily identify when a series (10) of cache misses occur and send an alert to the NOC to trigger an investigation.

The Cypher required to detect a MISS event only needs to identify the node types and relationships as a pattern.
MATCH (server1:server)<-[:TARGETED]-(event1 {cache_class:"MISS"})-[:REQUESTED]->(asset)<-[:REQUESTED]-(event2 {cache_class:"MISS"})-[:TARGETED]->(server2:server)
RETURN DISTINCT id(event1) AS event1
Then, additional Cypher processes the event to take action, recording it as a metric or sending an alert if the metric constraint is exceeded. This technique is demonstrated in the CDN Observability recipe.
Graph-Based Event Correlation
Cypher can respond to changes in the event stream in real time, allowing organizations to reduce the risk associated with a condition’s duration before it is analyzed and addressed.
For example, the Financial Risk Calculation recipe models market changes in real-time so that organizations can provide adequate coverage for risk exposure while ensuring their regulatory compliance minimally affects their asset allocation.
As basic patterns are matched, results are passed to business logic written in Cypher to generate an adjusted trading value, correlate (roll-up) trading events across the network, and trigger an alert when the trading system is out of compliance.
When a pattern match query detects an investment pattern, it triggers an output query to process the StandingQueryResult.

For example, the result returned from an investment pattern in Cypher:
MATCH (investment:investment)<-[:HOLDS]-(desk:desk)<-[:HAS]-(institution:institution)
RETURN DISTINCT id(investment) AS id
Triggers business logic in Cypher to generate a new property with a value based on the nodes investment.class property.
SET investment.adjustedValue = CASE
    WHEN investment.class = "1" THEN investment.value
    WHEN investment.class = "2a" THEN investment.value * .85
    WHEN investment.class = "2b" AND investment.type = 9 THEN investment.value * .75
    WHEN investment.class = "2b" AND investment.type = 10 THEN investment.value * .5
END
The investment events are then correlated through a roll-up function for each investment type.
UNWIND [["1","adjustedValue1"], ["2a","adjustedValue2a"], ["2b","adjustedValue2b"]] AS stuff

WITH institution,investment,desk,stuff
WHERE investment.class = stuff[0]

CALL float.add(institution,stuff[1],investment.adjustedValue) YIELD result AS institutionAdjustedValueRollupByClass
CALL float.add(institution,"totalAdjustedValue",investment.adjustedValue) YIELD result AS institutionAdjustedValueRollup

CALL float.add(desk,stuff[1],investment.adjustedValue) YIELD result AS deskAdjustedValueRollupByClass
CALL float.add(desk,"totalAdjustedValue",investment.adjustedValue) YIELD result AS deskAdjustedValueRollup

SET institution.percentAdjustedValue2 = ((institution.adjustedValue2a + institution.adjustedValue2b)/institution.totalAdjustedValue) * 100,
institution.percentAdjustedValue2b = (institution.adjustedValue2b/institution.totalAdjustedValue) * 100
Temporal Analysis
With Cypher, you can express temporal conditions, such as events occurring within a specific time window, events happening before or after certain events, or events falling into a particular time range. This enables temporal analysis of event streams, including trend analysis, time-based aggregations, and windowed computations.
For example, the temporal locality recipe looks for emails sent or received by [email protected] within a four to six-minute sliding window.
The pattern query matches each individual (sender)-[:SENT_MSG]->(message)-[:RECEIVED_MSG]->(receiver) pattern containing the CTO’s email address.

MATCH (n)-[:SENT_MSG]->(m)-[:RECEIVED_MSG]->(r)
WHERE n.email="[email protected]" OR r.email="[email protected]"
RETURN id(n) as ctoId, id(m) as ctoMsgId, m.time as mTime, id(r) as recId
And then calculates the duration between the emails to generate a sub-graph containing messages that went to or from the CTO within the time window.

MATCH (n)-[:SENT_MSG]->(m)-[:RECEIVED_MSG]->(r), (thisMsg)
WHERE id(n) = $that.data.ctoId
AND id(r) = $that.data.recId
AND id(thisMsg) = $that.data.ctoMsgId
AND id(m) <> id(thisMsg)
AND duration("PT6M") > duration.between(m.time,thisMsg.time) > duration("P")
CREATE (m)-[:IN_WINDOW]->(thisMsg)
CREATE (m)<-[:IN_WINDOW]-(thisMsg)
WITH n, m, r, "http://localhost:8080/#MATCH" + text.urlencode(&#039; (n)-[:SENT_MSG]->(m)-[:RECEIVED_MSG]->(r) WHERE strId(n)="&#039; + strId(n) + &#039;"AND strId(r)="&#039; + strId(r) + &#039;" AND strId(m)="&#039; + strId(m) + &#039;" RETURN n, r, m&#039;) a
RETURN URL
Conclusion
Cypher is a powerful and expressive query language well-suited for processing complex event streams. Quine streaming graph enables Cypher developers to leverage graph techniques early when processing a complex event stream to aggregate and shape events, detect patterns for alerting and early feedback, and perform event normalization before entering the data warehouse.
Learn more and Try Quine
If you want to try Quine using your own data, here are some resources to help:
- Learn more about Quine by visiting the Quine open source project.
- Download Quine – JAR file | Docker Image | Github
- Check out the Financial Risk Calculation recipe to see how Cypher is used for real-time rollups.
- Check out demos and other videos at our YouTube channel.
The post Cypher all the things! appeared first on thatDot.
]]>The post thatDot CEO Explains Streaming Graph to Cybersecurity Thought Leader appeared first on thatDot.
]]>thatDot founder and CEO Ryan Wright discussed the power of thatDot Streaming Graph and Novelty to detect the most well-hidden threats with the Bloor Group’s Eric Kavenagh and Mark Lynd, who was ranked #1 global thought leader in cybersecurity by Thinkers360. With high-profile data breaches hitting the headlines every other day now, the way we’re doing this is clearly a losing battle. Low and slow attacks like advanced persistent threats hiding in mountains of data are stealing whatever they want and many cyber professionals are just throwing up their hands and admitting defeat. DARPA funded thatDot technology development specifically to turn the tables on those threats.
This webinar provides what you need to know to change the game to one where the attacker must be perfect to have a chance. Just one step out of line will get them caught. To quote Mark Lynd, “This is the holy grail.” and “It takes us from reactive to proactive cybersecurity.”

Traditional graph data models offer depth but lack the immediacy required to outpace cybercriminals or the scale and processing speed needed to keep up with massive flows of information cyber professionals need to evaluate. With insightful questions from Mark to guide him, Ryan really goes deep on the power of this technology in the cybersecurity space. He provides some potent demonstrations of points like:
- The power of graph for relationship analytics.
- Scaling and speed on direct graph analysis of categorical data providing real time threat detection.
- Moving left so that cybersecurity analysis is done on data pipelines in real time.
- Reducing false positives with context awareness for anomaly detection.
This powerful tech is useful for many things, from digital twins to fraud detection, but is particularly powerful in the threat detection and anomaly detection space for cybersecurity. Watch this exceptional video on the thatDot Youtube channel.
Learn for yourself how to bring graph-driven reasoning into the real-time nature of event-driven processing in the cybersecurity stream.
Watch The Unreasonable Effectiveness of Streaming Graph.
The post thatDot CEO Explains Streaming Graph to Cybersecurity Thought Leader appeared first on thatDot.
]]>The post Streaming Graph Processing on Categorical Data Enables Real-time Risk Calculation appeared first on thatDot.
]]>The failure of Silicon Valley Bank in 2023 exemplifies the severe consequences of not accurately assessing risk in a timely manner. Although nearly every financial institution prioritizes risk minimization, their methods for calculating risk often rely on detailed analysis of categorical data and relationships. Most existing algorithms, however, only handle static, numeric data. This requires transforming the data, typically through methods like one-hot encoding, into numerical formats that are bulky, sparse, and slow to process. After analysis, the data often needs to be converted back to its original categories, adding to the inefficiency. Current state-of-the-art solutions take hours to deliver insights.
If we could perform this analysis earlier in the process, using the original categorical data as it streams in without modification, we could reduce the mean time to insight to seconds, potentially saving financial institutions significant amounts of money. This approach could also enable new capabilities, such as using graph NLP on streaming data to identify novel behaviors and detect anomalies like cyber-attacks before they impact systems. The combination of fast, in-line data processing engines like Flink or KsqlDB with graph algorithms and categorical analysis is exceptionally powerful. Join us to learn about a new open-source streaming intelligence system that revolutionizes risk analysis and other fast categorical data processing.
Event Details:
Title: Streaming Graph Processing on Categorical Data Enables Real-time Risk Calculation
Date: July 12, 2024
Time: 10:45am – 11:20am ET

Why You Should Attend
Attending Paige’s speech at Data Connect 2024 is a must for anyone serious about staying at the forefront of data science and risk management. Paige will unveil groundbreaking techniques for real-time risk analysis, demonstrating how to cut mean time to insight from hours to seconds. This shift can save financial institutions substantial costs and enhance their ability to detect anomalies, including cyber-attacks, before they cause harm. Paige will explore the synergy of in-line data processing engines like Flink or KsqlDB with advanced graph algorithms and categorical analysis. By attending, you’ll gain invaluable insights into innovative data processing methods that can revolutionize your organization’s approach to risk and data management. Don’t miss this opportunity to learn from a leading expert and enhance your strategic capabilities in the evolving data landscape.
The post Streaming Graph Processing on Categorical Data Enables Real-time Risk Calculation appeared first on thatDot.
]]>The post Akka to Pekko Migration for thatDot and Quine appeared first on thatDot.
]]>You don’t know what you’ve got till it’s gone. Musicians have sung this lament about relationships and the beauty of nature. It turns out to be true about open source software licenses as well.
On September 7, 2022, Lightbend announced that they were changing the license for Akka from the open source Apache License 2.0 to the commercial Business Source License 1.1. This had major implications for Akka users. Operators of closed source services built using Akka were faced with a primarily financial dilemma about the cost of licensing compared to the cost of re-implementation.
Authors of open source software depending on Akka had to re-evaluate their ability to remain open source themselves. At thatDot, we found ourselves facing both of these challenges.
thatDot publishes a streaming graph, Quine, under an open source license. We also host SAAS services like Novelty for AWS that are closed source products built on top of Quine. To continue using new versions of Akka, we would have to re-evaluate Quine’s licensing model, and incur the cost of purchasing licenses from Lightbend for our SAAS services.
Our immediate solution, like that adopted by many others, was to simply continue using the last version of Akka available under an open source license, version 2.6. This was a time-limited workaround though, since version 2.6 would eventually stop receiving security fixes.
It also prevented us from using libraries that themselves required later versions of Akka for their own security fixes, or additional functionality. We needed an open source alternative.
What we did
Pekko is an open source fork of Akka hosted by the Apache Software Foundation. It provided us with a path forward that kept a core component connected to an active community without requiring extensive re-writing of our own code. It also gained support from important connector libraries built on top of Akka that released Pekko backed versions.
Our migration required two main activities. The first was the modification of our own code that used Akka directly. The second was the replacement of all dependencies with the Pekko versions. The latter proved to be the more difficult one.
Modifying our direct dependency on Akka was refreshingly straightforward. We had to replace all imports of akka packages with imports of org.apache.pekko packages, and the akka section of our config files with a pekko section. The bulk of this was accomplished with search and replace using regular expressions.
The remaining pieces were found using simple (case-insensitive) searches for “akka”, and manually reviewing and editing the code or comments. For example, comments describing use of an Akka feature were modified, while those referring to discussions in Akka community forums to justify a decision were left unchanged.
While this was slightly tedious, it wasn’t hard to work through.
An unexpected challenge
The real challenge was replacing libraries to remove all indirect dependencies on Akka. Replacing dependencies also required us to unwind the delicate set of indirect dependencies we had pinned to work around vulnerabilities.
Migrating dependencies from Akka to Pekko can be done in 3 ways:
- Swapping in a drop-in replacement
- Forking the library and replacing its usage of Akka with Pekko
- Re-implementing the feature, possibly on a similar library with a Pekko version
In most cases, the community had Pekko equivalents that just worked after changing our build definition and import statements. In others, a Pekko version was not available, so we needed to use an alternative. These required us to make non-trivial changes to our code to re-implement the functionality.
The community adoption of Pekko made our migration feasible. We only had to drop two libraries that didn’t have Pekko versions, and only lost one feature, Pulsar support. The Pulsar library we were using, pulsar4s has since added a Pekko version.
Benefits
Migrating to Pekko:
- Allowed us to continue offering Quine with the same license.
- Reduced the maintenance burden of overriding and testing indirect dependencies to avoid security problems.
- Avoided extra cost to running our SAAS products.
- Opened up our ability to continue leveraging new libraries and releases from the community.
The post Akka to Pekko Migration for thatDot and Quine appeared first on thatDot.
]]>The post Release Announcement for thatDot Streaming Graph 1.6.1 with ClickHouse Persistor appeared first on thatDot.
]]>A new version of thatDot Streaming Graph has just been released with the brand new ability to persist data directly in ClickHouse! The new ability to have multiple namespaces is another huge advantage in multi-tenant situations.
With new v1.6.1 enhancements, you can:
▪ Persist data in Clickhouse.
▪ No longer see hot spares in ingest monitor payloads.
▪ Manage different teams or customers with namespace management, with a single thatDot Streaming Graph instance that has independent graph interpreters.
▪ Integrate with Kafka more robustly with added support for arbitrary Kafka properties on WriteToKafka Standing Query output via kafkaProperties field.
▪ Use multiple value standing queries more easily with the ability to trigger an event on arbitrarily-keyed property changes by using a RETURN properties(n) rather than having to list all properties manually.
▪ Get simpler, more standard names for the NumberIteratorIngest fields startAtOffset and maximumPerSecond. If you were previously using the names startAt or throttlePerSecond, you will need to update your recipes and API calls.
▪ Improve favicon support on all platforms.
▪ Execute simple text queries in the single-line query bar on the Explore UI with SHIFT-ENTER.
Fixes:
Some error messages normally encountered during Cypher query compilation were lost when the previous version was migrated to Scala 2.13. Reintroduce those error messages.
Be sure to check out thatDot Streaming Graph for more information and if you already use it, update your local copy of thatDot Streaming Graph to v1.6.1 using your preferred method
Post Title
Download – Streaming Graph for Data Pipelines.
The post Release Announcement for thatDot Streaming Graph 1.6.1 with ClickHouse Persistor appeared first on thatDot.
]]>