Junjie Li · Congyang Ou · Haokui Zhang · Guoting Wei · Shengqin Jiang · Ying Li · Chunhua Shen


Given a PAN–LRMS image pair, SALAD-Pan fine-tunes a pre-trained diffusion model to generate a HRMS.
- [02/01/2026] Code will be released soon !
git clone https://github.com/JJLibra/SALAD-Pan.git
cd SALAD-Pan

conda create -n saladpan python=3.10 -y
conda activate saladpan

# This project depends on a modified local version of `diffusers` under `./diffusers`.
cd diffusers
pip install -e .

cd ..
pip install -r requirements.txt
And initialize an 🤗Accelerate environment with:
accelerate configOr for a default accelerate configuration without answering questions about your environment
accelerate config defaultWe provide two-stage checkpoints:
- Stage I (Band-VAE):
checkpoints/vae.safetensors(download: Hugging Face) - Stage II (Latent Diffusion): runs on top of Stable Diffusion in the Band-VAE latent space.
- Stable Diffusion base: download from Hugging Face (e.g., Stable Diffusion v1-5)
- Adapters:
checkpoints/adapters.pth(download: Hugging Face)
We train the model in two stages.
- Stage I (VAE pretraining)
accelerate launch train_vae.py --config configs/train_vae.yaml- Stage II (Diffusion + Adapter training)
accelerate launch train_diffusion.py --config configs/train_diffusion.yamlNote: Tuning usually takes 40k~50k steps, about 1~2 days using eight RTX 4090 GPUs in fp16.
Reduce batch_size if your GPU memory is limited.
Once the training is done, run inference:
Coming soon.Installing xformers is highly recommended for more efficiency and speed on GPUs.
To enable xformers, set enable_xformers_memory_efficient_attention=True.
🚨We strongly recommend that you visit this website for a better reading experience.
Table 1. Quantitative results on the WorldView-3 (WV3) dataset. Best results are in bold.
| Models | Pub/Year | Q8 ↑ | SAM ↓ | ERGAS ↓ | SCC ↑ | Dλ ↓ | Ds ↓ | HQNR ↑ |
|---|---|---|---|---|---|---|---|---|
| PaNNet | ICCV’17 | 0.891±0.045 | 3.613±0.787 | 2.664±0.347 | 0.943±0.018 | 0.017±0.008 | 0.047±0.014 | 0.937±0.015 |
| FusionNet | TGRS’20 | 0.904±0.092 | 3.324±0.411 | 2.465±0.603 | 0.958±0.023 | 0.024±0.011 | 0.036±0.016 | 0.940±0.019 |
| LAGConv | AAAI’22 | 0.910±0.114 | 3.104±1.119 | 2.300±0.911 | 0.980±0.043 | 0.036±0.009 | 0.032±0.016 | 0.934±0.011 |
| BiMPAN | ACMM’23 | 0.915±0.087 | 2.984±0.601 | 2.257±0.552 | 0.984±0.005 | 0.017±0.019 | 0.035±0.015 | 0.949±0.026 |
| ARConv | CVPR’25 | 0.916±0.083 | 2.858±0.590 | 2.117±0.528 | 0.989±0.014 | 0.014±0.006 | 0.030±0.007 | 0.958±0.010 |
| WFANET | AAAI’25 | 0.917±0.088 | 2.855±0.618 | 2.095±0.422 | 0.989±0.011 | 0.012±0.007 | 0.031±0.009 | 0.957±0.010 |
| PanDiff | TGRS’23 | 0.898±0.090 | 3.297±0.235 | 2.467±0.166 | 0.980±0.019 | 0.027±0.108 | 0.054±0.047 | 0.920±0.077 |
| SSDiff | NeurIPS’24 | 0.915±0.086 | 2.843±0.529 | 2.106±0.416 | 0.986±0.004 | 0.013±0.005 | 0.031±0.003 | 0.956±0.016 |
| SGDiff | CVPR’25 | 0.921±0.082 | 2.771±0.511 | 2.044±0.449 | 0.987±0.009 | 0.012±0.005 | 0.027±0.003 | 0.960±0.006 |
| SALAD‑Pan | Ours | 0.924±0.064 | 2.689±0.135 | 1.839±0.211 | 0.989±0.007 | 0.010±0.008 | 0.021±0.004 | 0.965±0.007 |
Table 2. Quantitative results on the QuickBird (QB) dataset. Best results are in bold.
| Models | Pub/Year | Q4 ↑ | SAM ↓ | ERGAS ↓ | SCC ↑ | Dλ ↓ | Ds ↓ | HQNR ↑ |
|---|---|---|---|---|---|---|---|---|
| PaNNet | ICCV’17 | 0.885±0.118 | 5.791±0.995 | 5.863±0.413 | 0.948±0.021 | 0.059±0.017 | 0.061±0.010 | 0.883±0.025 |
| FusionNet | TGRS’20 | 0.925±0.087 | 4.923±0.812 | 4.159±0.351 | 0.956±0.018 | 0.059±0.019 | 0.052±0.009 | 0.892±0.022 |
| LAGConv | AAAI’22 | 0.916±0.130 | 4.370±0.720 | 3.740±0.290 | 0.959±0.047 | 0.085±0.024 | 0.068±0.014 | 0.853±0.018 |
| BiMPAN | ACMM’23 | 0.931±0.091 | 4.586±0.821 | 3.840±0.319 | 0.980±0.008 | 0.026±0.020 | 0.040±0.013 | 0.935±0.030 |
| ARConv | CVPR’25 | 0.936±0.088 | 4.453±0.499 | 3.649±0.401 | 0.987±0.009 | 0.019±0.014 | 0.034±0.017 | 0.948±0.042 |
| WFANET | AAAI’25 | 0.935±0.092 | 4.490±0.582 | 3.604±0.337 | 0.986±0.008 | 0.019±0.016 | 0.033±0.019 | 0.948±0.037 |
| PanDiff | TGRS’23 | 0.934±0.095 | 4.575±0.255 | 3.742±0.353 | 0.980±0.007 | 0.058±0.015 | 0.064±0.020 | 0.881±0.075 |
| SSDiff | NeurIPS’24 | 0.934±0.094 | 4.464±0.747 | 3.632±0.275 | 0.982±0.008 | 0.031±0.011 | 0.036±0.013 | 0.934±0.021 |
| SGDiff | CVPR’25 | 0.938±0.087 | 4.353±0.741 | 3.578±0.290 | 0.983±0.007 | 0.023±0.013 | 0.043±0.012 | 0.934±0.011 |
| SALAD‑Pan | Ours | 0.939±0.088 | 4.198±0.526 | 3.251±0.288 | 0.984±0.009 | 0.017±0.011 | 0.026±0.009 | 0.957±0.010 |
Table 3. Quantitative results on the GaoFen-2 (GF2) dataset. Best results are in bold.
| Models | Pub/Year | Q4 ↑ | SAM ↓ | ERGAS ↓ | SCC ↑ | Dλ ↓ | Ds ↓ | HQNR ↑ |
|---|---|---|---|---|---|---|---|---|
| PaNNet | ICCV’17 | 0.967±0.013 | 0.997±0.022 | 0.919±0.039 | 0.973±0.011 | 0.017±0.012 | 0.047±0.012 | 0.937±0.023 |
| FusionNet | TGRS’20 | 0.964±0.014 | 0.974±0.035 | 0.988±0.072 | 0.971±0.012 | 0.040±0.013 | 0.101±0.014 | 0.863±0.018 |
| LAGConv | AAAI’22 | 0.970±0.011 | 1.080±0.023 | 0.910±0.045 | 0.977±0.006 | 0.033±0.013 | 0.079±0.013 | 0.891±0.021 |
| BiMPAN | ACMM’23 | 0.965±0.020 | 0.902±0.066 | 0.881±0.058 | 0.972±0.018 | 0.032±0.015 | 0.051±0.014 | 0.918±0.019 |
| ARConv | CVPR’25 | 0.982±0.013 | 0.710±0.149 | 0.645±0.127 | 0.994±0.005 | 0.007±0.005 | 0.029±0.019 | 0.963±0.018 |
| WFANET | AAAI’25 | 0.981±0.007 | 0.751±0.082 | 0.657±0.074 | 0.994±0.002 | 0.003±0.003 | 0.032±0.021 | 0.964±0.020 |
| PanDiff | TGRS’23 | 0.979±0.011 | 0.888±0.037 | 0.746±0.031 | 0.988±0.003 | 0.027±0.011 | 0.073±0.013 | 0.903±0.025 |
| SSDiff | NeurIPS’24 | 0.983±0.007 | 0.670±0.124 | 0.604±0.108 | 0.991±0.006 | 0.016±0.009 | 0.027±0.027 | 0.957±0.010 |
| SGDiff | CVPR’25 | 0.980±0.011 | 0.708±0.119 | 0.668±0.094 | 0.989±0.005 | 0.020±0.013 | 0.024±0.022 | 0.959±0.011 |
| SALAD‑Pan | Ours | 0.982±0.010 | 0.667±0.051 | 0.592±0.088 | 0.991±0.003 | 0.005±0.002 | 0.022±0.014 | 0.973±0.010 |
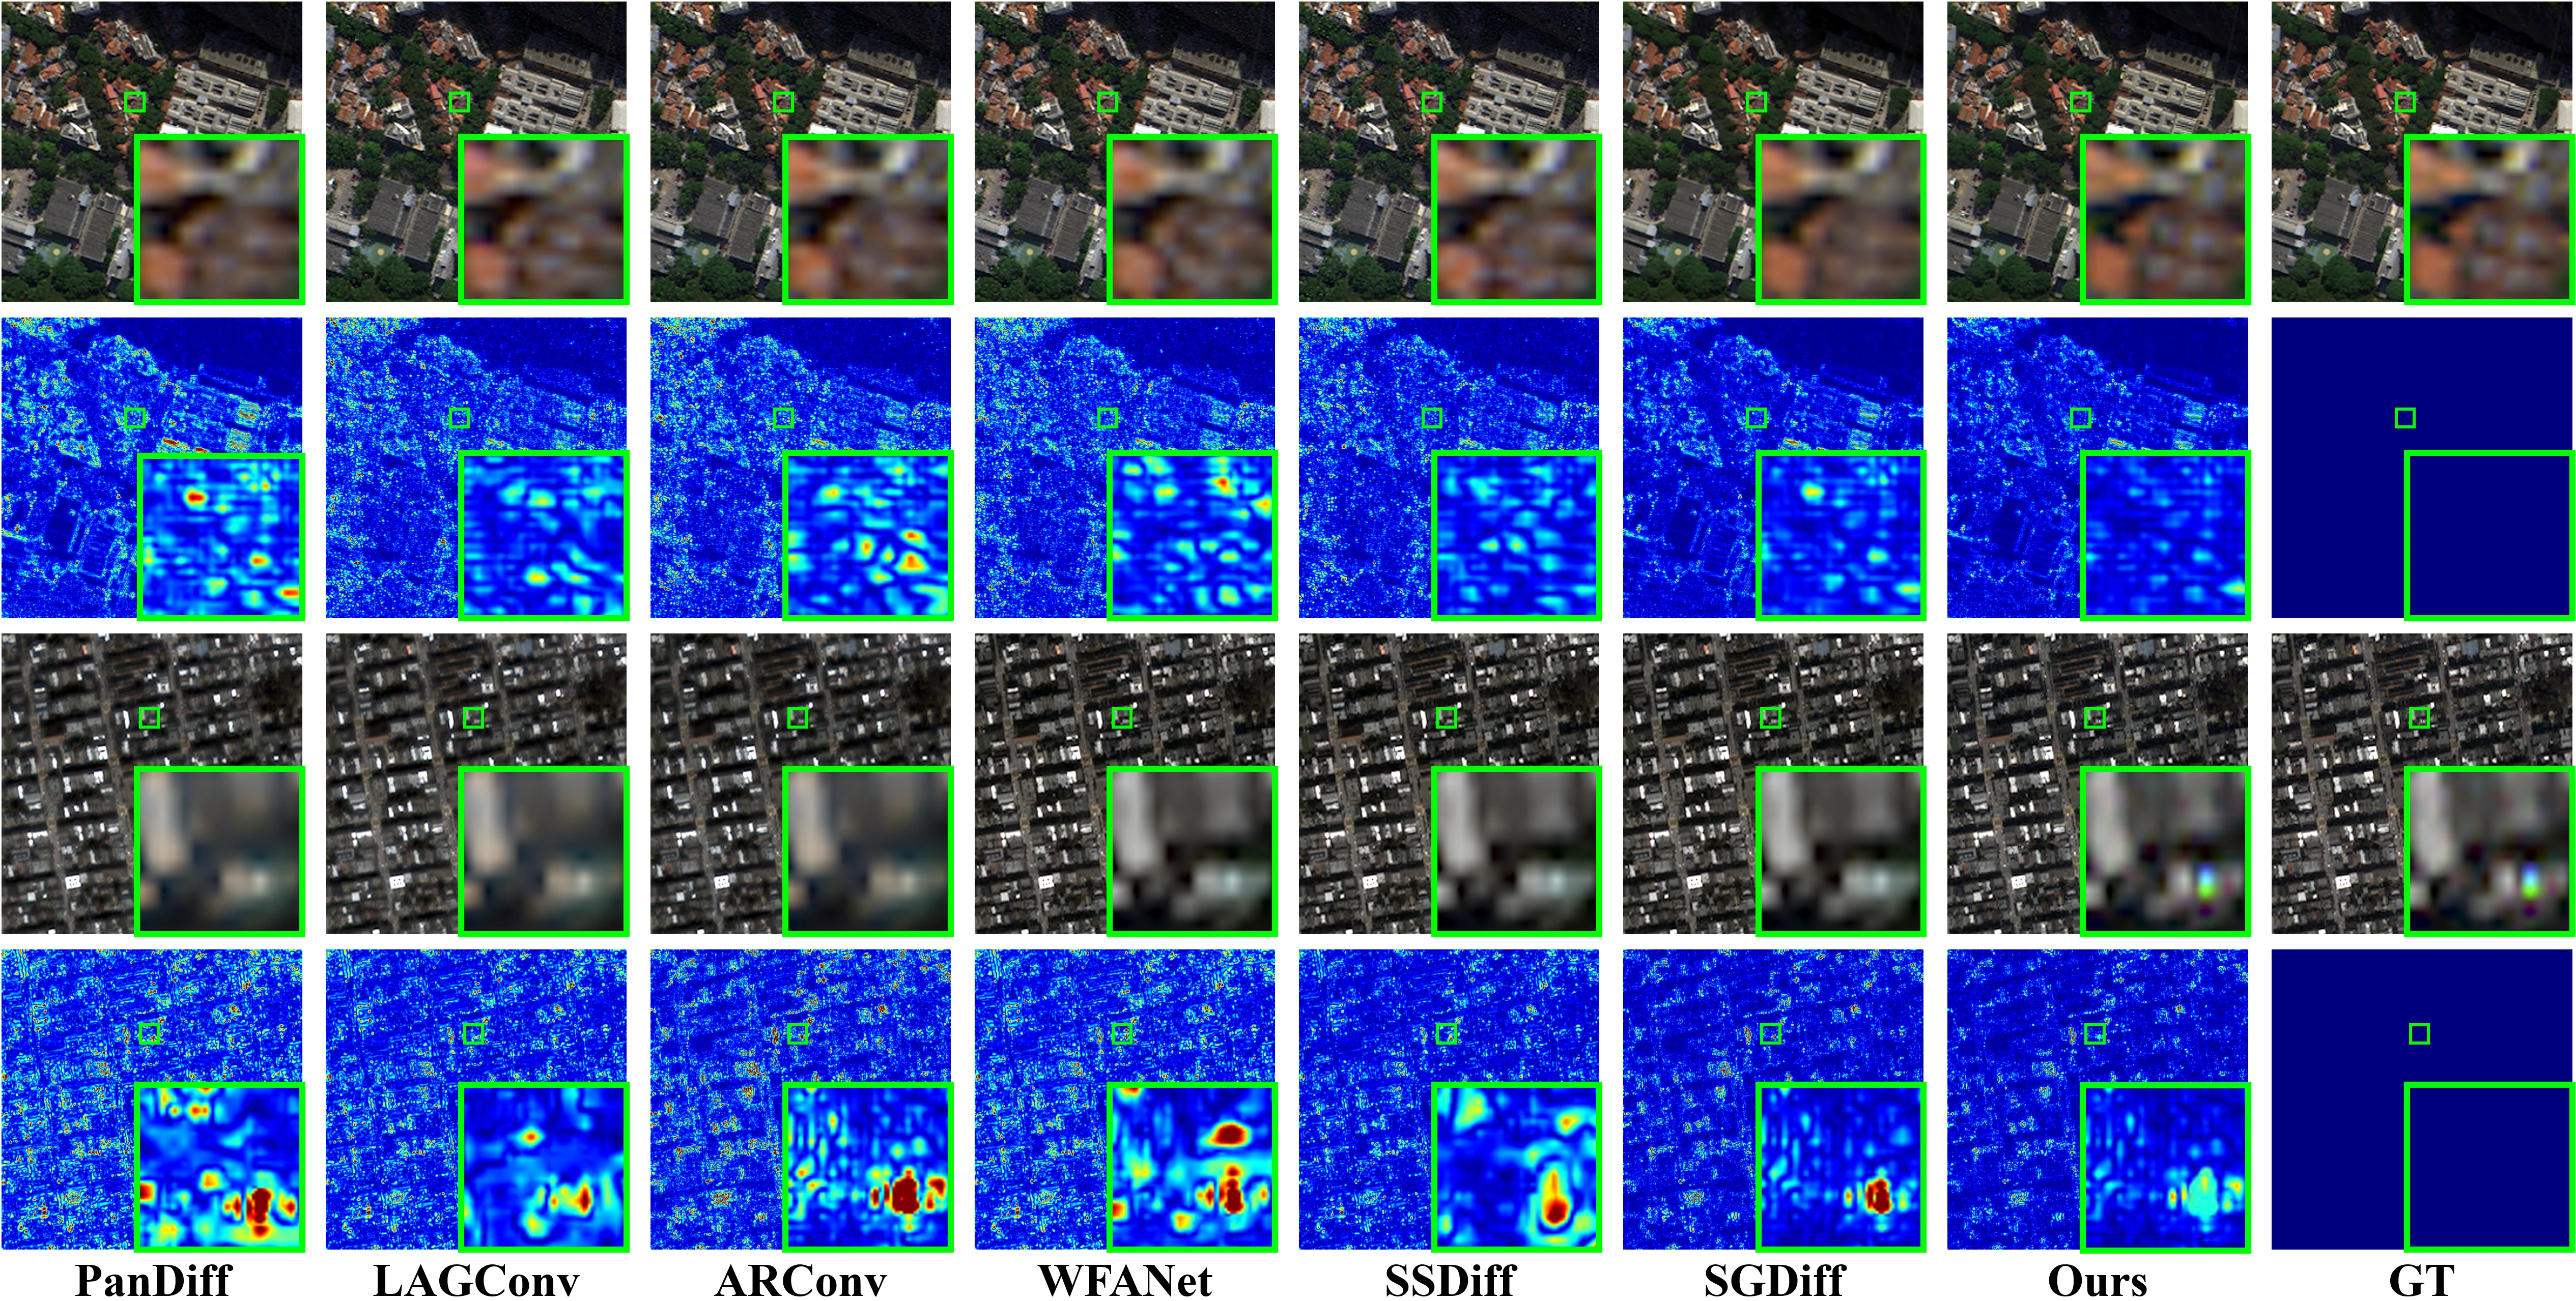
Visual comparison on WorldView-3 (WV-3) and QuickBird (QB) dataset at reduced resolution.
| Diffusion-based Methods | SAM ↓ | ERGAS ↓ | NFE | Latency (s) ↓ |
|---|---|---|---|---|
| PanDiff | 4.575±0.255 | 3.742±0.353 | 1000 | 356.63±1.98 |
| SSDiff | 4.464±0.747 | 3.632±0.275 | 10 | 10.10±0.21 |
| SGDiff | 4.353±0.741 | 3.578±0.290 | 50 | 6.64±0.09 |
| SALAD-Pan | 4.198±0.526 | 3.251±0.288 | 20 | 3.36±0.07 |
Latency is reported as mean ± std over 10 runs (warmup=3), batch size=1, evaluated on the QB dataset under the reduced-resolution (RR) protocol, on an RTX 4090 GPU.
If you make use of our work, please cite our paper.
@article{li2026saladpan,
  title={SALAD-Pan: Sensor-Agnostic Latent Adaptive Diffusion for Pan-Sharpening},
  author={Junjie Li and Congyang Ou and Haokui Zhang and Guoting Wei and Shengqin Jiang and Ying Li and Chunhua Shen},
  journal={arXiv preprint arXiv:2602.04473},
  year={2026}
}- Built with 🤗 Diffusers. Thanks for open-sourcing !
- The interactive demo is powered by 🤗 Gradio. Thanks for open-sourcing !