-
Project object
-
Project software
-
Project resources
-
Project methodology
-
Definition and implementation of the datawarehouse
-
Initial exploration and cleansing of data
-
Statistical study
-
Data visualization
-
Linear regresion algorithm
-
Conclusion
-
Project editors
-
Thanks
The purpose of this project is to analyze what features must an Airbnb accommodation have and what ammenities must offer it to be one of the most demanded in Madrid.
The tools used to carry out this project are the following:
- Draw.io ~> To model the database by constructing the Entity-Relationship Diagram
- PostgreeSQL ~> As database engine
- DBeaver ~> A generic client to access all kinds of databases, in this case postgreSQL
- Python ~> An interpreted, object-oriented, high-level programming language
- RStudio ~> An integrated development environment for R, a programming language for statistical computing and graphics
- Tableau~> A visual analytics platform.
- Git ~> To share this project
You can see the initial information used for this analysis in the following Airbnb dataset: airbnb-listings.csv
We also used the information about the content of the previous Airbnb's dataset in the Data Dictionary you will find here: http://insideairbnb.com/explore/
-
First of all, we analysed the initial Airbnb's dataset and created an Entity-Relationship Diagram of our datawarehouse and we coded a SQL script to create it.
-
Then, an initial exploration and cleaning of the data provided in the initial dataset was done.
-
Next, a statistical study was done in order to normalize data, detect outliers and ensure the quality of the data.
-
After that, a dashboard was created to visualize the relevant KPIs and to show the conclusions in order to respond the topic we wanted to evaluate.
-
The next step was to code a linear regression algorithm will in order to predict the price of a property based on the most influential characteristics to the success of the accommodation
-
Finally, an answer to our question was deduced from the analysis we had carried out.
The following image shows the E-R diagram of our datawarehouse:

You will see the E-R Diagram file here: Diagrama E-R.drawio
You will see the SQL script to our datawarehouse in this link: script_project.sql
After reading the initial dataset and loading necessary libraries, we created a function that tells us how many repeated values are there in each column of the dataframe in order to assess the quality of the data.
We also assigned the correct class to each column by using as.Date to interpret the date columns.
Then we checked that all the listings are uniquely identified by their ID and Geolocation data, so we painted these points on the map and get this image:
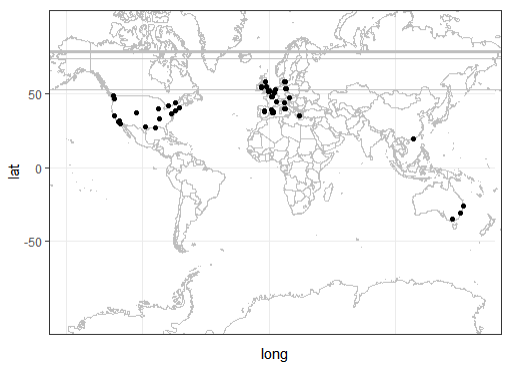
This data is the result of looking for "Madrid" in the source page. Although most of the houses are based in Madrid (around 90% of the total number), some of them seem to be distributed around the world. Maybe this keyword came up in different textfiedls for spurious reasons., so we found necessary to filter the relevant data by Longitude and Latitude and get this image:
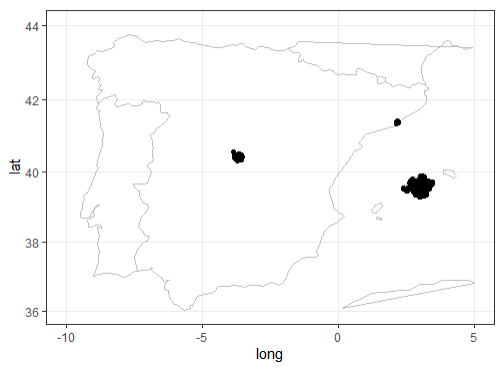
The following imagen shows the result of making zoom into Madrid:
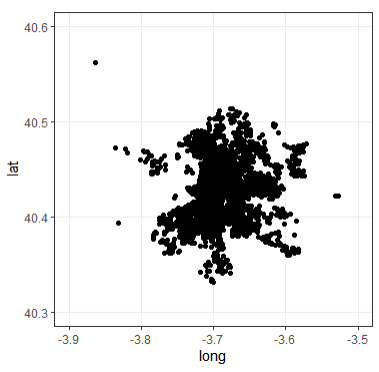
Once we cleared out the data points outside Madrid's area, it was weird to keep multiple values for Country, Country.Code, State and City.
For instance, when checked the listings with a country different to Spain, we found out that most of the information about the apartment in "Cuba" talks about La Habana. The geolocation might be wrong, so we cant probably trust this data point. The same happens to the listing from Italy, it seems to be an italian girl looking for an apartment. Something similar happens when we checked the apartments that don't mention Madrid as the State and have a Zipcode that doesn't start with 28. Some apartments have addresses located in Barcelona, Malaga or Valencia, 4 of them don't have any information about their city, Street State or Zipcode. These could be mistakes in the Geolocation data. They only add up to 11 data points, so we removed them. Finally, we removed 5 extra outliers that seem to be located outside the area of Madrid city.
After this, we standardized the columns, cleaning some of the character fields and transforming the lists into separated columns. We also identified which character columns could be interpreted as factors (categorical qualitative variables).
- Neighbourhood: There seems to be a difference between Neighbourhood and Neighbouhood.Cleansed. Let's visualize that:
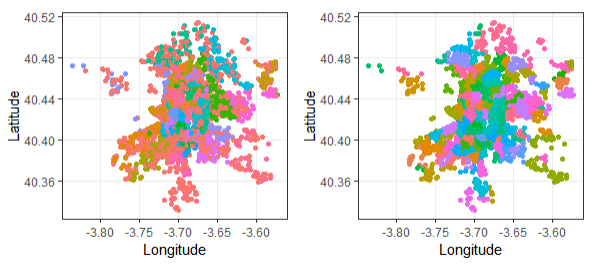
It seems that Neighbourhood.Cleansed correlates better with the Geolocalitation data for each house. According to the Data Dictionary, this field was double checked using Latitude and Longitude data. Neighbourhood also has more empty values. That`s why used Neighbourhood.Cleansed from then.
-
Empty price: Since price is one of the key metrics we need to predict, we can't possibly use the apartments that don't have this value (these are only 9 data points).
-
ZipCode: We edited this column and removed incorrect Zipcodes
-
Street: Some streets are in English, others in Spanish... we already had the zip code in a different field. And all the data belongs to Madrid. So we aligned these fields and isolated the Street name.
-
Ammenities and Features: These columns contain a string that summarizes different properties of the house or the host. We turned each property into a different column with a boolean value (T/F) by creating a function. This added more than 50 logical columns to our dataframe. Most were almost empty and therefore, not very useful, so we removed them.
Finally, after observing and cleaning the initial dataframe, we removed the followinf columns:
-
Scrape.ID, Last.Scraped, City, State, Country, Country.Code: All houses share the same value, so these are almost metadata, nor very useful as variables.
-
Calendar.last.Scraped: there are only 2 different dates, separated by a day (the date is the same as the Last.Scraped date)
-
Experiences.Offered, Host.Acceptance.Rate, Jurisdiction.Names, Has.Availability: all values are "none".
-
Square.Feet: this is an interesting value to predict price. But it is mostly empty in Madrid listings (probably bc it is in feet).
-
License: mostly empty
-
Listing.Url, Host.Url: probably redundant with the listing and host ID
-
Thumbnail.Url, Medium.Url, Picture.Url, XL.Picture.Url, Host.Thumbnail.Url, Host.Picture.Url: we won't be doing image analysis this time.
-
Host.Total.Listings.Count, Calculated.host.listings.count: These fields are very similar to Host.Listings.Count. Calculated is very inferior only in 12% of the cases. Total is identical.
-
Host.Neighbourhood: very similar to Host.Location, but Neighbourhood has more empty values and it lacks definition in the Data dictionary.
-
Market, Smart.Location: seem a bit redundant with other location data. They are not described in the dictionary, and they were removed from the latest scrapes.
-
Geolocation: redundant with longitud + latitude.
-
Features/amenities: There are many interesting features in these fields. But some of them are only included in less than 10% of the listings. We believe these might be less relevant for our analysis.
You can see the code in the following file: airbnb_ready.csv
We started this second data cleaning stage by observing if there were columns with null values that were not useful. We noticed that:
- More than a half of values in Notes column were nulls. Also we took into account that the character of the column is just complementary, as you can see in the dataset description [dataset_dictionary](link al dataset dictionary), so this column was excluded.
- The Street columns appeared to be just another column with Neighbourhoods, but with a lot of null values. Given that we already had Neighbourhood.Cleansed & Neighbourhood.Group.Cleansed, the Street column was omitted.
- The columns Summary, Space, Description, Neighborhood.Overview, Transit, Access, Interaction, House.Rules and Host.About were all text columns that could not be converted to categorical variables. We could hace used them by counting the length of each description and seing if lengthy texts had an impact on listing's popularity and price. However, having other columns with more useful information, we decided to remove these from our dataset.
Our conclusion after analysing boolean variables was:
- There were no null values in bool columns. However, some of them did not seem to be useful. For example, Internet and Wireless Internet were very similar, so we dropped Wireless Internet as a subtype of Internet.:

- There were only a small part of listings that had detectors. It could be an important feature:

- Almost all hosts have profile pictures, so it appeared to be a redundant feature:

- Hangers didn't seem to be a relevant feature:

- Safety card didn't seem to be a relevant feature:

Observing columns with numerical variables we realized that:
-
Nulls in Host.Response.Rate column seemed to have little activity in general, so these nulls values were imputed with zeros.
-
There were only 3 null values in Host.Listings.Count column. The host information for these observations was missing altogether. The host probably deleted their account, or their identity wasn't verified, so we decided to drop these 3 observations.
-
Maximum and Minimum Nights were an important indicator of host's approach to short-term and long-term renting. There were some clear outliers in Minimum.Nights column. Although 99% of data was under 25 nights, excluding these outliers might not be a good idea at this point because they may indicate listings that target exclusively long-term rental.

Most hosts were not willing to limit maximum booking time. However, the maximum of 1000.000 days, or 2740 years seemed to be a bit extreme. Setting the upper outliers to the upper limit of 2265 days, or roughly 6 years should be enough to indicate the long-term approach of the host:

-
There were 3 columns for price, two of them with a lot of null values. Assuming that the weekly price and monthly price were indicated only if there is a special discount we converted these columns to boolean values to see if there was a discount or not.
-
The proportion of Entire home type was less in groups that have no cleaning fee or no deposit than in the general dataset. The Private Room and Shared Room types were more likely to have null values for Cleaning fee and Deposit fee. Given that some Airbnb listing come without these fees, the nulls could be explained by zero fees.


- When checking the quality of listings' Availability columns, we noticed that there were no significant outliers or null values and these columns would be more informative if converted to percentage of nights available per every period. Thus they could be compared more easily:


You can see the code in the following file: eda_with_python.ipynb


You can see the complete visualization file here: DashboardTableau
The objective of this part of the project was to make a linear regression algorithm that predicts the price of a property depending on the characteristics we chose.
The price has the following distribution:
Price's distribution had some serious outliers, but given the nature of the dataset, a lot of these could be real observations. That's why we decided to have a look at the percentiles:
After droping columns that were not likely to be of interest for a linear regression model predicting price or these ones which had too many nulls as per previous EDA in python, we imputed the null values in the float dtype columns that weren't imputed before visualization in order to avoid distorting the analysis.
There weren't any null values left in Bathrooms column, but having 0 values for number of bathrooms was weird, so we checked if it was related with Room.Type and Price and might actually mean 0.5 bathrooms (a small bathroom without shower or tub):
These 0 values didn't seem to depend on the Room.Type and in terms of price were similar to 0.5 bathroom listings, so we imputed them with 0.5.
There were no null values left and 0 Bedrooms could mean a studio:
In case of reviews, null values most likely corresponded to properties with no reviews so far. Speaking about Review.Score, it was difficult to impute missing reviews without distorting the data, so we just dropped these observations. Madrid Based Values in Madrid.Based column were not exactly null, so the label was just adjusted to 'No Data', 'False' and 'True.
While checking the association of different features of this dataset with the price, there were about 90 features, so explored them by thematic groups.
In the following group we could seee that longitude and Latitude didn't have very significant correlation with the Price, but they could be informative. Neighbourhood.Cleansed and Neighbourhood.Group.Cleansed were rather similar and one should be dropped in order to avoid using highly correlated independent variables:
The correlation of Review Scores with Price was not very high but they still could be informative for the model:
Type of property and its general characteristics except Listing.Description.Length were tightly associated with the price:
The following features seemed to be important:
Except for the Internet and Buzzer.wireless.intercom, amenities columns also seemed to be relevant:
Except for Breakfast, Washer, Family.kid.friendly, Dryer, Hair.dryer and Iron, the following amenities could be important:
Except for Laptop.friendly.workspace, Fire.extinguisher, Smoke.detector, Carbon.monoxide.detector and X24.hour.check.in, these amenities also seemed to be important:
Features with interesting correlation with the price seemed to be Host.Listings.Count, Host.Identity.Verified, Host.Tenure, Host.Is.Superhost, Host.Response.Time, Days.from.Cal.Update, N.of.Host.Verifications:
After the previous estadistic analysis, we determined that the features to include in our regresion algorithm to predict the price were the following:

After creating the linear regresion model, With R-squared of 0.64 and 30 as residual standard error, the performance was far from optimal, so we checked the residual errors:
The residual errors tended to get bigger with higher values. One possible cause of poor performance of the model could be the skewness of the data that we had observed earlier.
In order to amend the skeweness of the data, we made the following logarithmic and square root transformations:
- Log of Price instead of Price
- Log of Number of Reviews instead of Number of Reviews
- log(x+1) for Security Deposit and Cleaning Fee because they have 0 values after imputation
- Square root for medium-performing Reviews.Score variables
- Drop features with feeble correlation
After these changes, the Rsquared for both train and test subsets were around 0.77-0.78, which we consider acceptable values. The fact that they were similar showed that this model wasn't overfitting.
You will find the linear regresion file here: R_linear_regression.qmd
● Initial assumptions: which have been shown to be valid, which have not and why?
From the beginning we assumed that location, property type and bedroom type would influence the price, which has turned out to be correct. On the other hand, we thought that there would be more amenities and features that would also have an influence on the price, and we have not been able to find a relationship that demonstrates it.
We also assumed that the success of an accommodation was directly related to the price, although that may not be the case.
● Taking into account what has been learned, what would be done in the same way and what would be done in another way?
Instead of assuming that success is based on price, we would analyze the success of an accommodation considering availability and also ratings of each listing based on the number of people who rated it.
We would also focus on analyzing a specific feature instead of analyzing them all in general.
-
Almudena Martin Castro - Autor del proyecto - Linkedin - Github
-
Maria Victoria García Gómez - Autor del proyecto - Linkedin - Github
-
Elisabet Soriano - Autor del proyecto - Linkedin
-
Ana González Esteban - Autor del proyecto - Linkedin - Github
- KeepCoding - Centro de formación - Web de KeepCoding
- Glovo - Patrocinador - Web de Glovo