This repo contains, among other things, an open source data visualization tool built around timeseries datasets from the National Transit Database. The tool lets the user explore any public transportation spending in the USA since 1991.
The tool is up in a Beta at http://transit.observer
Give it a try and leave some feedback

THIS REPO also contains some twitter bots (but on mastodon)
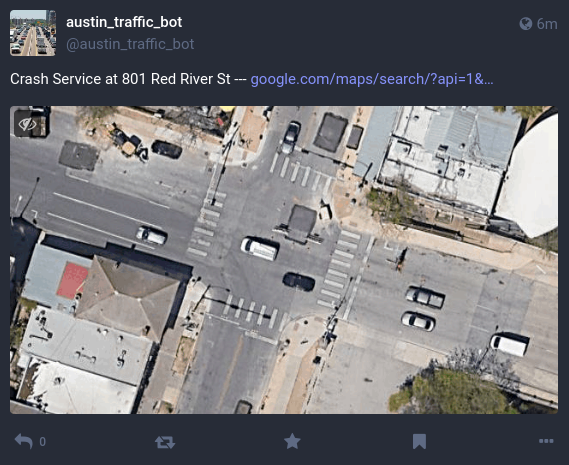
This is a robot which takes real time traffic reports from the City of Austin Open Data Portal (https://data.austintexas.gov/Transportation-and-Mobility/Real-Time-Traffic-Incident-Reports/dx9v-zd7x) And posts them with a picture of the intersection, and a link to the intersection on google maps.
Built using Django // A Linode // Crontab // A Bash script
https://mastodon.social/@austin_traffic_bot
OK UPDATE 4/20:
This repo also now contains a lot of ETL code for NTD expenses timeseries, and performance timeseries as well. I'll eventually use this repo to build and API / site for visualizing transit data
to build webpack into production ready bundle.js file, run
npx webpack --config webpack.config.js --mode production