Clone the project
Install the latest Python 3
Install the libraries that this project requires by running the command in a command prompt:
pip install -r requirements.txt
Open command prompt in the directory where this project is located.
Run the following command in the command prompt to open the UI
python3 reports.py
or
python reports.py
The following UI will open:
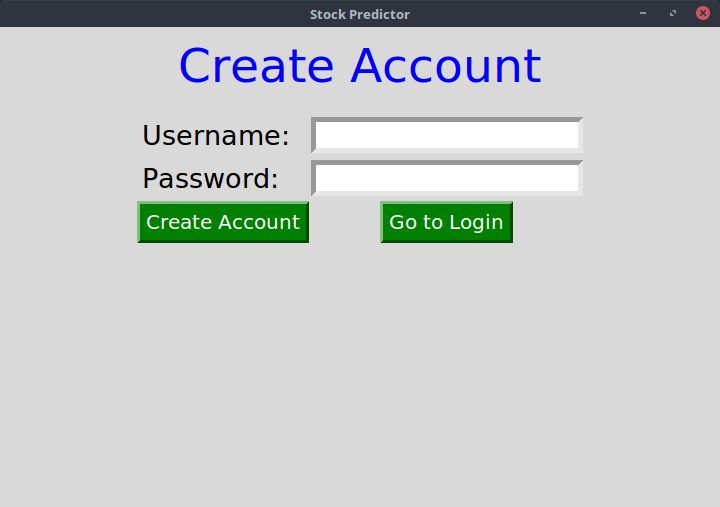
Sign up then Login to proceed
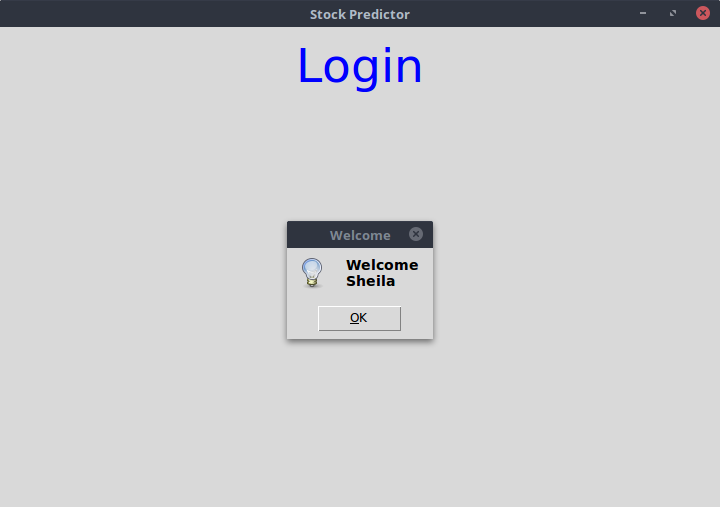
Press ok on the prompt that appears
Exit the screen with the text Login to proceed to the mani UI
Press the Stream Tweets button to straem current tweets and the Stream Stock Data button to stream current stock data
NB: Internet Access is required to stream data
NB: The button will be gray to indicate processing, the UI will not be responsive, it will be responsive when the button turns back to gray
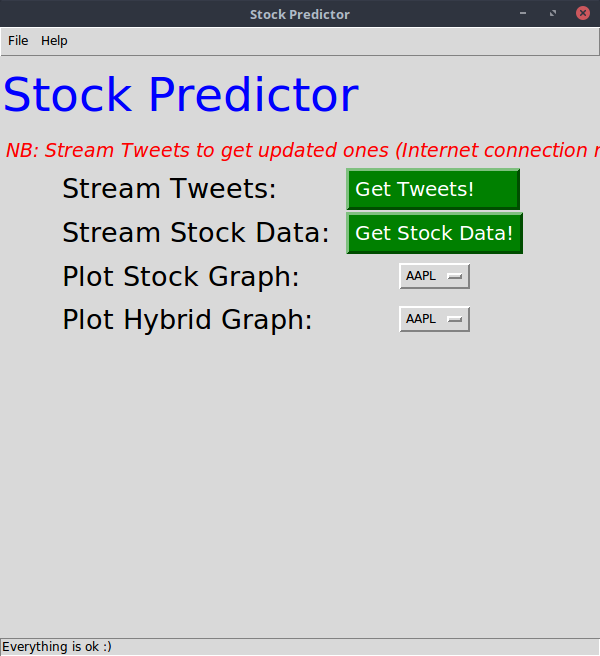
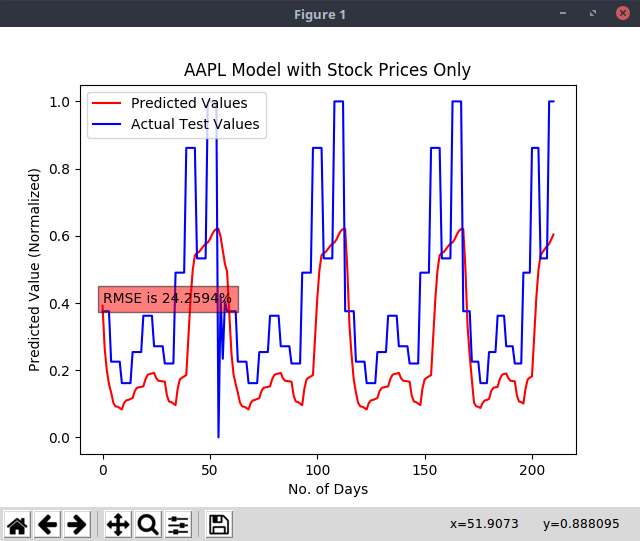
Click on a stock from the Plot Stock Graph Dropdown to plot it's stock Graph.
NB: The UI will not be responsive because of processing, it will be responsive when the graph appears signalling end of processing
Save the graph that appears on the window that popups by clicking the save button, choose the location you want.
Exit the graph window to avoid errors while plotting another graph
Click on a stock from the Plot Hybrid Graph Dropdown to plot it's hybrid Graph.
NB: The UI will not be responsive because of processing, it will be responsive when the graph appears signalling end of processing
Save the graph that appears on the window that popups by clicking the save button, choose the location you want.
Exit the graph window to avoid errors while plotting another graph
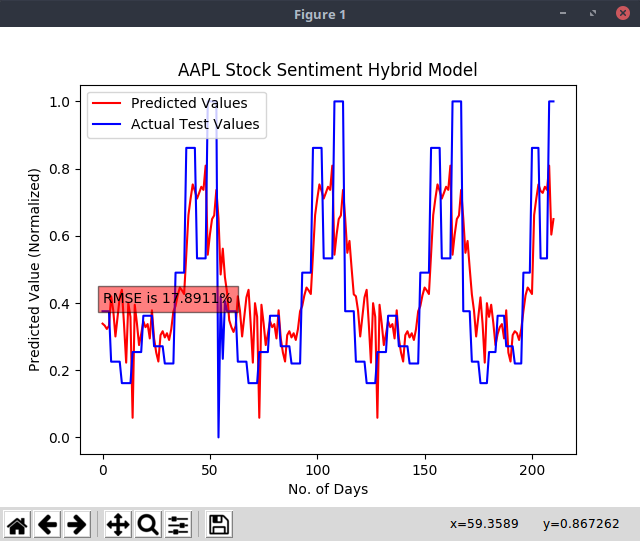
Open the 2 graphs side by side to compare the Root Mean Squared Error(RMSE) displayed, this will help you know which model is accurate
NB: The lower the accuracy, the more accurate the model
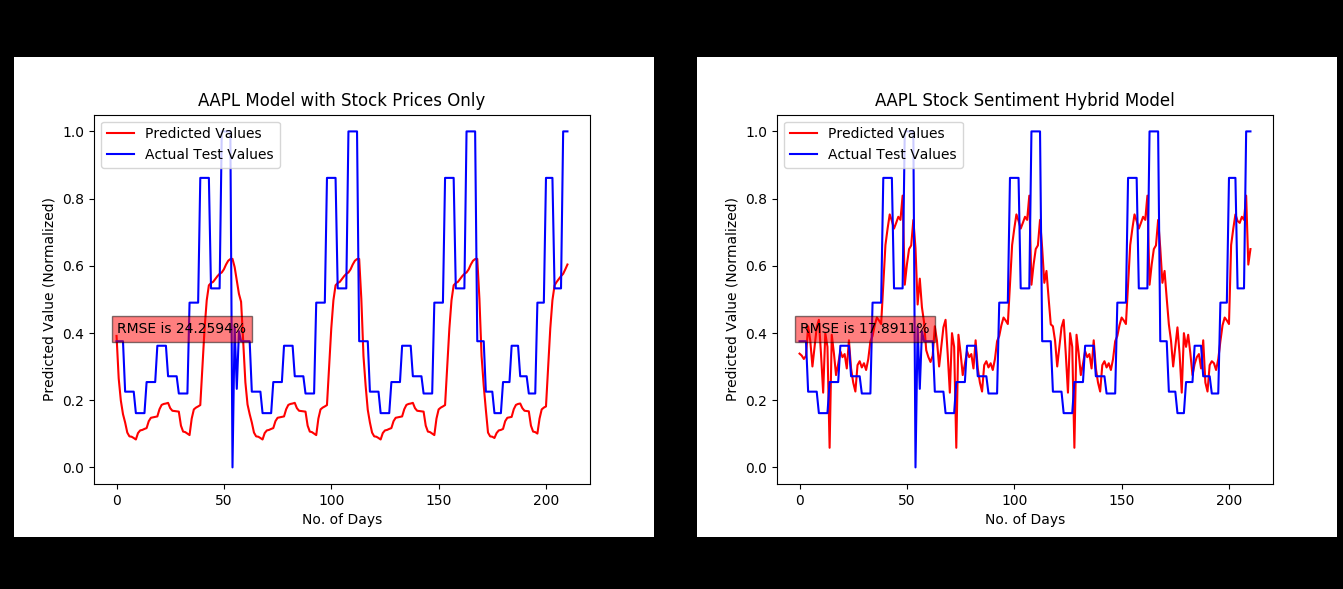
In this case, the hybrid model performed better than the model with stock data only.