NEW Official TradingView AI Tool Is Now Available (FREE)Exciting! I’ve put together a quick video showing some of how the new TradingView AI tool works.
Yes it is real. No it is not a virus or a scam :)
Yes it is a beta. Yes it is very very cool.
You can read more about it and download it from here: tvremix.xyz
Currently this is a Chrome Extension t

The best trades require research, then commitment.
Get started for free$0 forever, no credit card needed

Scott "Kidd" PoteetPolaris Dawn astronaut

Where the world does markets
Join 100 million traders and investors taking the future into their own hands.

Markets Exit Q1 on a High Note Amid War Jitters. What About Q2?S&P 500 🔻 4.6%, Nasdaq 🔻 7.1%, Dow Jones 🔻 3.6%
It's January. Economic growth is accelerating, the Federal Reserve looks ready to cut rates further, the AI boom still has runway. The mood is genuinely good.
Then, on February 28, the United States and Israel launched strikes on Iran, and the moo

Bitcoin RoadmapToday, I want to share with you a mid-term outlook on Bitcoin ( BINANCE:BTCUSDT ) by analyzing it in a higher time frame—specifically, a 6-hour time frame—which could trigger a bullish move for Bitcoin, so stay with me.
In general, financial market movements over the past month have been heavily i

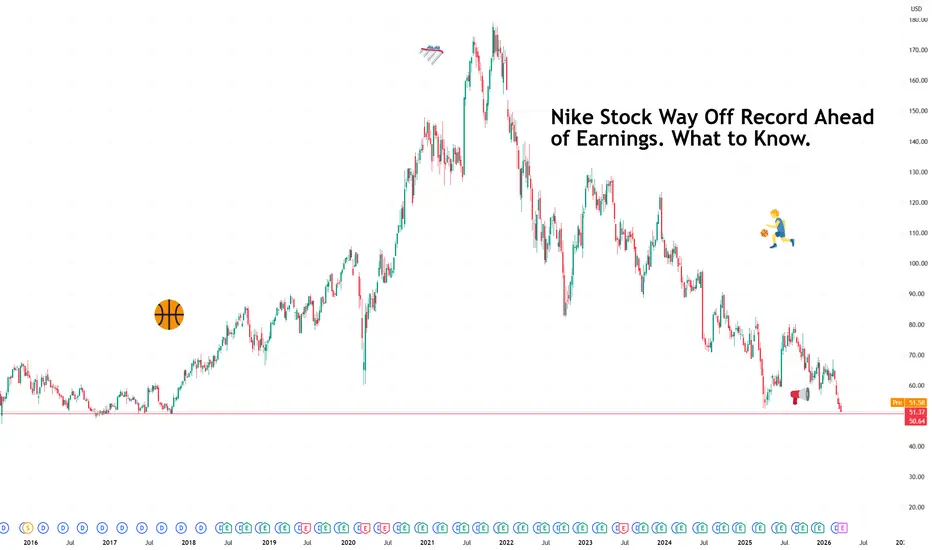
Nike Stock Way Off Record Ahead of Earnings. What to Know.There is a particular kind of corporate humbling that comes not from collapse but from irrelevance creeping in at the edges.
Nike NYSE:NKE is still the world's largest sportswear brand, still moving tens of billions in revenue, still on the feet of more athletes than any other company on earth.
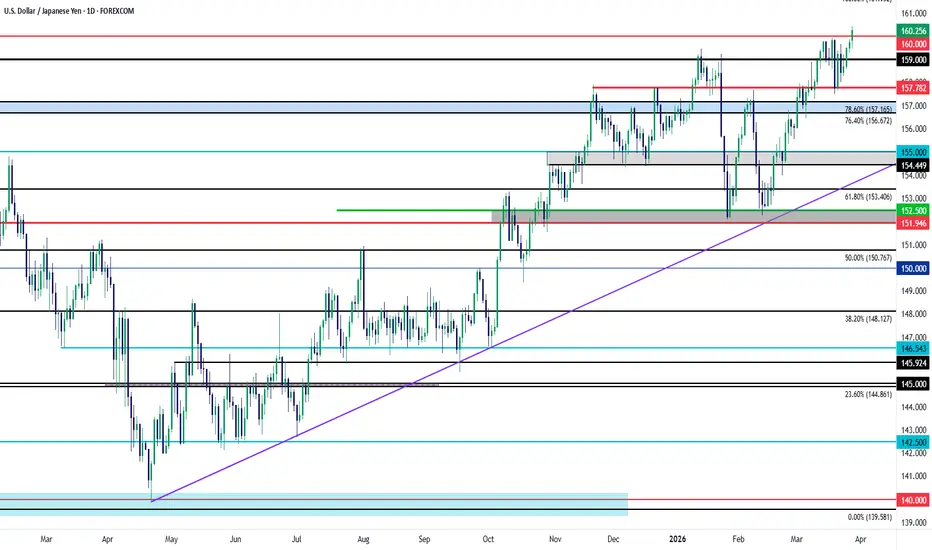
USD/JPY: The 160.00 TestFor the first time since July of 2024 USD/JPY has pushed above the 160.00 handle.
The move hit around 1am Tokyo time so we could still see a response from Japanese policymakers around the Sunday open, and interestingly, last week began with another threat of intervention that brought pullback to US
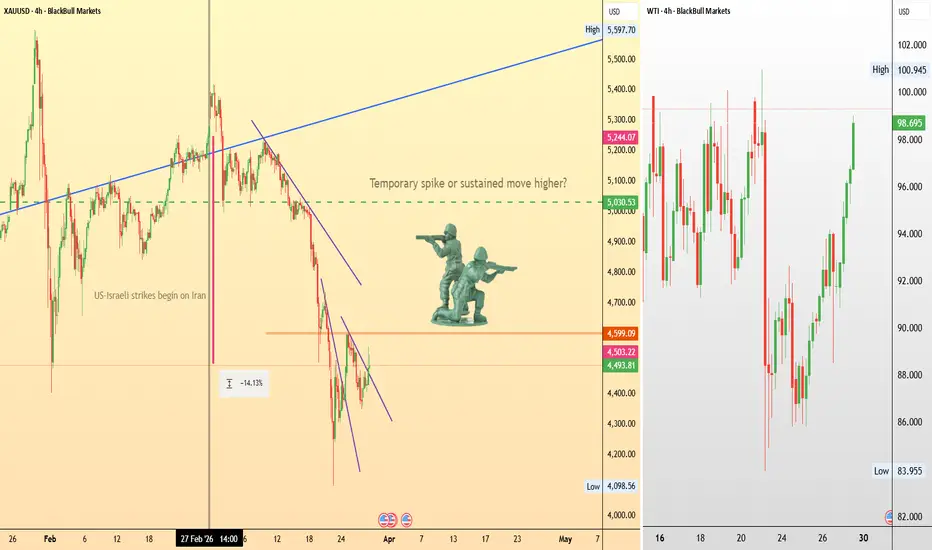
Will a ground invasion finally move gold?From a technical perspective, gold is currently in a clear short-term downtrend following the initial geopolitical spike. Gold appears to be waiting for a stronger catalyst.
Are ground troops what gold needs to start moving upward?
Iran has claimed it could mobilise more than 1 million troops to
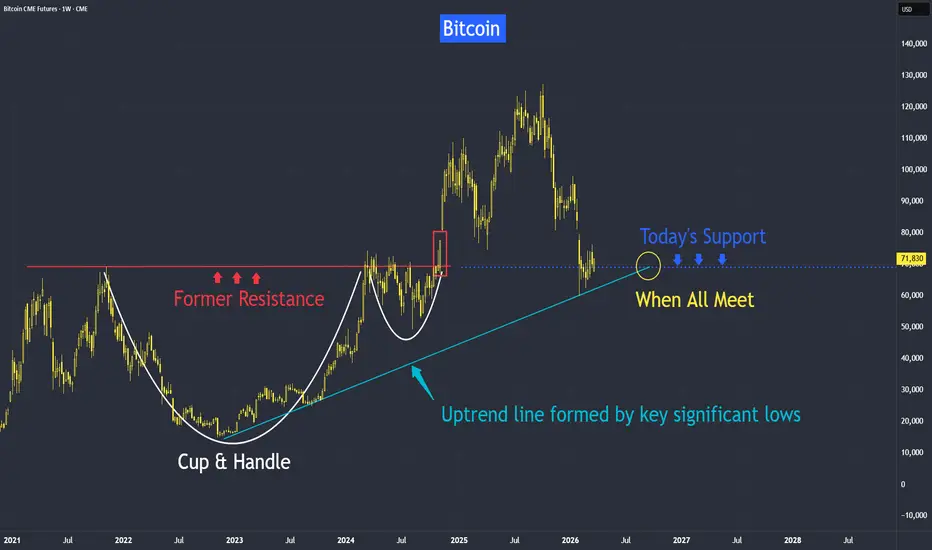
Bitcoin Key Support Level at 70,000It has fallen from last year's highs, but technical support could be near, and also supported by several fundamental factors.
Let me first touch on two key fundamentals before covering the technical aspects.
1) Regulator creating a friendlier environment - with new SEC rules and upcoming legislati
Silver Analysis: Which Direction Is Next?Before anything else, it’s important to note that silver, unlike gold, tends to have sharp and aggressive corrective moves. This makes it a bit more challenging to trade, so proper risk management and caution are essential when dealing with it.
From the point where we placed the red arrow on the ch

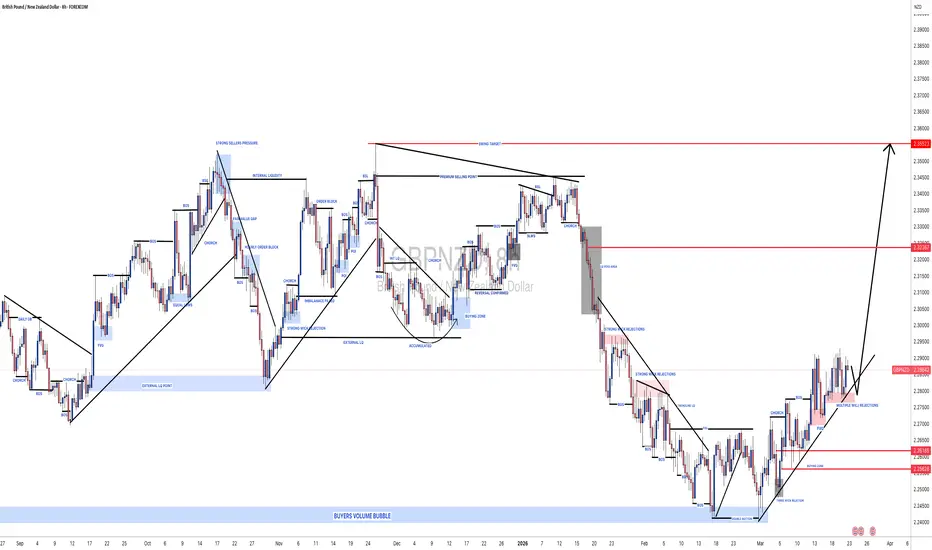
#GBPNZD: Two Targets, Once Strong Bullish Entry! ✴️ The GBP/NZD pair demonstrated a favourable reversal upon reaching our designated buying zone at 2.256, currently trading at 2.287. This indicates potential for continued upward momentum. We anticipate the price may advance towards the 2.32 level where a liquidity void is expected to be addressed.
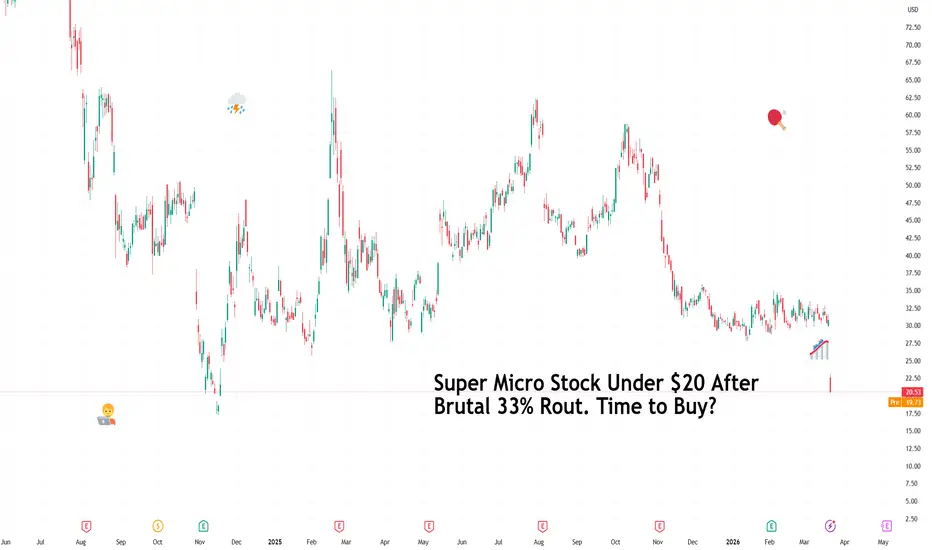
Super Micro Stock Under $20 After Brutal 33% Rout. Time to Buy?If only there was a way to track where things went wrong.
The board of directors at Super Micro NASDAQ:SMCI got together one day in the boardroom and decided it’s a good idea to bring back the same executive who had already resigned once over an accounting scandal.
They voted to hire him as a
See all editors' picks ideas
Volume Bubbles [QuantAlgo]🟢 Overview
The Volume Bubbles indicator is a multi-layered volume cluster detection system that identifies statistically significant volume events directly on your price chart, classifying them by magnitude (Small, Medium, Big) and direction (Buy, Sell, Mixed). By combining adaptive percentile t
Pine Script® indicator

Monte Carlo CT [SS]This is the Monte Carlo CT indicator.
CT stands for "central tendencies" and is the real distinguishing characteristic of this indicator against other Monte Carlo based indicators.
In statistics, Central Tendency is a single value that attempts to describe a set of data by identifying the central
Pine Script® indicator

HTF Volume Spike & Imbalance Projection [LuxAlgo]The HTF Volume Spike & Imbalance Projection indicator provides a comprehensive multi-timeframe analysis tool that projects higher timeframe (HTF) candle structures, volume spikes, and volume profiles directly onto the current chart. This script aims to bridge the gap between different time horizon
Pine Script® indicator

Swing Structure Forecast [BOSWaves]Swing Structure Forecast - Statistical Swing Projection System with Volatility-Adaptive Support and Resistance Detection
Overview
Swing Structure Forecast is a statistically-driven swing analysis system that maps directional price structure through confirmed pivot identification, where supp
Pine Script® indicator

TASC 2026.04 A Synthetic Oscillator█ Overview
This script implements a Synthetic Oscillator as presented by John F. Ehlers in the April 2026 TASC Traders' Tips article "Avoiding Whipsaw Trades". The indicator aims to provide a smooth, low-lag oscillator for timely trading signals by dynamically mapping a sine wave to price data
Pine Script® indicator

Volume Spread Analysis IQ [TradingIQ]Hello Traders!
🔹Volume Spread Analysis IQ
This indicator was most voted on for our indicator competition - so here it is! Hope you guys like it :D
Volume Spread Analysis IQ is a chart-reading tool built to help traders judge effort, result, and background context in a way that is visual and
Pine Script® indicator

Market Microstructure AnalyticsThe Hidden Toll on Every Trade
Every time you buy or sell a financial instrument, you pay a cost that never appears on your brokerage statement. It is not a commission. It is not a fee. It is the spread between the price at which someone is willing to sell to you and the price at which someone is
Pine Script® indicator

Fair Value Gap Profile + Rolling POC [BigBeluga]🔵 OVERVIEW
FVG Profile builds a price-level profile based on detected Fair Value Gaps (FVGs) over a fixed lookback period.
Instead of measuring traded volume alone, this tool aggregates bullish and bearish FVG occurrences into horizontal bins, allowing traders to see where price inefficienci
Pine Script® indicator

PineScript integration with Notepad++ (UDL)THIS IS NOT AN INDICATOR!
This is PineScript integration with Notepad++ text editor (NPP). It supports PineScript v6 as of January 2026. Provides autocompletion, function list and syntax highlighting for *.pine files.
Why would anyone need this?
Pine Editor doesn't provide function list yet
Pi
Pine Script® indicator

Machine Learning Pivot Points (KNN) [SS]Hey everyone,
Been working on this one for a very long time.
1. What It Is: The Geometric DNA of a Pivot
Machine Learning Pivot Points (KNN) is a predictive structural tool that moves away from traditional lag based oscillators. Instead of waiting for a moving average crossover, this system t
Pine Script® indicator

See all indicators and strategies
Community trends
Await confirmationThe price has been moving since February between two weekly SMAs: the 200 SMA (blue line) has been acting as support, while the 10 SMA (grey line) has been pushing the price down every time it touches it for the past four weeks.
At the moment, the price is resting on the medium‑term support indicat

$NKE - Early Signs of Positioning After a Heavy Sell Off ?
One of the names that’s been catching my attention lately is $NKE. After being one of the most beaten-down blue chips over the past few years, I’m starting to see what could be early signs of positioning. Nothing aggressive yet, but I did notice some unusual options activity going into the close re

Ferrari - Ready for the Next Ride?RACE has been in a correction phase lately,
but price is now approaching a very strong support zone.
This area is not random.
It’s the intersection of:
• Rising trendline
• 300 round number
• Demand zone
A clear confluence.
As long as this zone holds,
the bulls remain in control.
And we wil


NVIDIA On the brink of a strong correction towards $110.NVIDIA Corporation (NVDA) hit last month its 1W MA50 (blue trend-line) but despite marginally breaking below it, the price managed to close the 1M candle above it, thus so far supporting the market.
This is a critical Support trend-line as every time NVIDIA broke and closed below it within its 11-y

Microsoft, good timing to return to buying?Microsoft stock, one of the stars of US tech, has lost more than 35% in the stock market since last summer. The software sector has undergone an unfavorable rotation in the face of the artificial intelligence narrative, and leading companies such as Microsoft, Adobe and SAP have sharply corrected in

BILI — Multi-Year Base Nearing ResolutionTwo Patterns, One Breakout
BILI is building one of the cleanest multi-year base structures in the China tech space right now. Two powerful patterns are converging on the same breakout level.
1. Rounding Bottom (2022–2026)
Price carved a textbook cup formation spanning nearly four years. It bo

Tesla, Inc (TSLA): Price Approaching Resistance ZonesAs of April 2, 2026, Tesla (TSLA) stock is trading around $370-$381, experiencing slight volatility after recent gains, with market attention focused on upcoming q1 delivery numbers and potential SpaceX IPO news. analysts identify $391.35 as a critical resistance level. a close above this could sign

SMCI Bullish DivergenceAfter a strong earnings announcement yesterday and very positive forward guidance, we are officially placing SMCI on a Buy rating.
Over the past few weeks, the stock has been forming a bullish divergence, with Wave C complete and price trending lower while both MACD and RSI are making higher highs,

RIOT | DailyNASDAQ:RIOT — Quantum Model Projection
Primary Degree Correction Nearing Completion
As highlighted in the previous analysis (Feb 19), the anticipated final decline in Minor Wave C within Intermediate Wave (Y) has developed—now appearing to be in its late stage—potentially concluding the entire co

See all stocks ideas
Apr 6
TOONKartoon Studios, Inc.
Actual
—
Estimate
—
Apr 6
COCPCocrystal Pharma, Inc.
Actual
—
Estimate
−0.18
USD
Apr 6
RMCORoyalty Management Holding Corporation
Actual
—
Estimate
0.03
USD
Apr 6
JAGXJaguar Health, Inc.
Actual
—
Estimate
−4.26
USD
Apr 6
OSTXOS Therapies Incorporated
Actual
—
Estimate
−0.14
USD
Apr 6
NNOXNANO-X IMAGING LTD
Actual
—
Estimate
−0.19
USD
Apr 6
GNLNGreenlane Holdings, Inc.
Actual
—
Estimate
—
Apr 6
RDIReading International Inc
Actual
—
Estimate
−0.20
USD
See more events
Community trends
Bitcoin Bear Phase Active ABC Rally to $93K Then Drop to $51K+BTC has decisively transitioned into a bearish market structure following a confirmed breakdown of the primary ascending trendline that previously sustained the macro bull rally. The loss of this dynamic support, combined with sustained price acceptance below it, signals a clear shift in order flow

BITCOIN 2-month Support just turned into Resistance.Bitcoin (BTCUSD) is following a very cohesive pattern throughout the current Bear Cycle, highly symmetrical and easily distinguishable into Phases. Right now it has flipped again its 1D MA50 (blue trend-line) into a Resistance, turning bearish for the short-term as well.
But this is not its most im

Bitcoin - 58k soon, then rally 88k! (Best opportunity, must see)Bitcoin has been pretty boring in past weeks, but this should change very soon. I am still expecting a last drop to 58k, but then a huge pump to 88k! Why? First of all, I think Bitcoin has been consolidating in this bearish flag for many weeks, and bearish flags are in general negative patterns for

BITCOIN - The hunt for liquidity ahead of a drop to 65000BINANCE:BTCUSDT.P is struggling to fulfill its role as a hedge asset. Consolidation continues amid a global bearish trend. The local market is seeking liquidity ahead of a decline.
The global structure is strongly bearish. Consolidation is forming ahead of an anticipated distribution phase. Locall

Hedera (HBAR): Trend Reversal In Play – Short Opportunity HereNot going to keep it long here. HBAR is having a trend reversal currently, which is giving us an opportunity for a short position right here.
So far the sell-side pressure seems strong so our major target can be hit easily here — but just in case, setting a particular TP at $0.08381.
Swallow Acade

Will ETH/USDT Break the Trendlines and Retest Previous Lows?The price is currently being supported by two rising trendlines.
If the bears take control and push the price to break down clearly below BOTH of these lines, the local support structure will collapse.
Once this final defense is broken, strong bearish momentum will be triggered, and the price wil

Trendline Still In ControlGood morning everyone🧘🏽♂️
A very quick update today, as the trendline I mentioned in the previous post is playing out perfectly so far.
“...we’re watching the local descending trendline, with the first touch on March 17. Price is currently testing it, but for further upside continuation we need a

MANA Bullish Reversal Setup-Inverse H&S on 4H–Breakout Incoming?Description:
#MANA is showing a strong bullish reversal structure on the 4H timeframe, forming a clean Inverse Head & Shoulders pattern. The left shoulder and head are already completed, and price is currently developing the right shoulder, indicating a potential trend shift. There are no significa

#BTC#BTC was again rejected from the support area and has moved slightly sideways. The price looks weak and could break the support now. We have news coming along the way, which may lead to a volatile end to the week. Let's wait and see for the breakout to happen.

risks deeper dropdown in historical support levelMomentum has slowed significantly from the volatile swings observed on the left side of the chart. The price is currently oscillating in a tightening range, which typically indicates a compression of energy before a directional move. There is a lack of strong follow-through on bullish candles, sugge

See all crypto ideas
XAU/USD | First BUY, then SELL (READ THE CAPTION CAREFULLY)By analyzing the #Gold chart on the 4H timeframe, we can see that price continued to follow the projected bullish scenario and extended its strong recovery once again. As expected, Gold pushed higher and finally reached the $4800 level, hitting the major target discussed in the previous analysis.
H

Gold - Will this downtrend continue?Gold is currently trading under clear pressure after a strong move down from the highs. The recent price action shows a temporary bounce, but overall structure remains bearish. The market is now reacting to key imbalance zones, and the next moves will largely depend on how price behaves around these

Bullish Momentum in Crude Oil – Uptrend Continuation
Crude oil is maintaining a strong uptrend structure, forming higher highs and higher lows, which reflects sustained buying pressure. Price is respecting key support zones and showing bullish continuation signals, indicating further upside potential. Buyers remain in control, and momentum favors con

XAU/USD: The Perfect Trap? Retest Confirmed, Target $4,300Gold is following a relentless bearish script. If you’ve been watching the "Break & Retest" cycles, this current setup is as textbook as it gets.
The Pattern: History Repeating 🔁
The bears are in total control of the 2H timeframe. We’ve seen this play out twice now:
The First Breakdown: The initia

Hellena | GOLD (4H): LONG to 5000 area.Colleagues, judging by the structure, Wave IV appears to be complete, and we should now expect an upward Wave 1 of intermediate order; however, it is somewhat unclear how the correction in Wave 2 will play out.
Perhaps the price will reach the 4900 area, then drop for a correction to 2500, and only

XAUUSD Long: Gold Recovery in Play - Targeting Key ResistanceHello traders! Here’s my technical outlook based on the current XAUUSD (1H) chart structure. Gold moved inside a descending channel, confirming bearish pressure, then broke down and formed a short consolidation. After that, price shifted into an ascending channel, signaling recovery.
Currently, pri

#SILVER(XAGUSD): Intraday Buying Trade Setup! ✴️ Silver is currently exhibiting bullish characteristics, supported by a significant increase in trading volume. Historical price action under similar market conditions has demonstrated a strong upward impulse, leading to higher highs in shorter timeframes.
✴️ Given the current market parallels,

XAUUSDHello Traders! 👋
What are your thoughts on Gold?
Gold is currently trading within a well-defined descending channel. After reaching the lower boundary (channel support), we observed a bullish correction that led the price toward a key structural level.
The price successfully rallied to the 4800 zo

Sell the Retracement With ConfirmationXAUUSD — Corrective Bounce Into Supply | Sell the Retracement With Confirmation
Context
In the previous analysis, the bearish wedge idea was directionally correct, but the pattern did not complete immediately. Price extended higher first, then formed the actual distribution near resistance an

Gold Consolidates at Key Zone — 4700 Break Opens 4800Yesterday, Gold did what it has been doing best lately — an aggressive move during the Asian session, followed by a normal recovery after the sell-off, and then the price went into a range, and is now sitting almost still at a key confluence zone.
The strong sell-off from 4800 continues to suggest

See all futures ideas
GBPUSD Daily CLS Model 1 Nested in Weekly CLS Model 2Hi traders, this is more complex we got Model 1 on Daily CLS range nested in the Model 2 in Weekly CLS range. Basically more confluence. Im already in this Long from this key level. As always SL should be below manipulation. This time I have set it bellow the Low as its also model 2 on weekly and

EURUSD Short: Rejection at 1.1580 Signals Downside Toward 1.1500Hello traders! Here’s my technical outlook based on the current EURUSD (4H) chart structure. EURUSD previously traded inside a descending channel, forming lower highs and confirming sustained bearish pressure. After a breakdown, price moved into a consolidation phase, showing temporary balance befor

GBP/JPY - Triangle Compression Near Key Level (03.04.2026)🚨 Market Situation : FX:GBPJPY
GBPJPY is currently forming a tight symmetrical triangle, with price compressing between rising support and descending resistance.
After a strong recovery from the lows, the pair is now preparing for a potential breakout move as volatility continues to shrink.
💡

03.04.26 Daily ForecastPairs on Watch -
FX:AUDJPY : A very simple bull flag is what I am waiting for on this pair, I was long earlier on in the week and took the manual breakeven however the higher timeframe still remains. If we get a bit more development on this structure I will filter to the 15M and look for a risk

EURUSD Rejection from Trendline Keeps Bears in ControlHello traders! Here’s my technical outlook based on the current EURUSD (4H) chart structure. EURUSD initially formed a range after a prior uptrend, then broke below an ascending support line, signaling a shift in momentum. Following the breakdown, price continued to trade under a descending trend li

USDJPYhello traders,
USDJPY reach a strong resistance, if it break up, we will see 162-163,
most probably it will go down today till the next UP
what do you think?

NZDUSD - A short squeeze amid a global downtrend FX:NZDUSD is forming a short squeeze as part of a counter-trend correction and is poised to decline within the broader bearish trend
Despite the correction, the dollar remains in an uptrend. If the index bounces off support, this will intensify the currency pair’s decline...
NZDUSD is forming

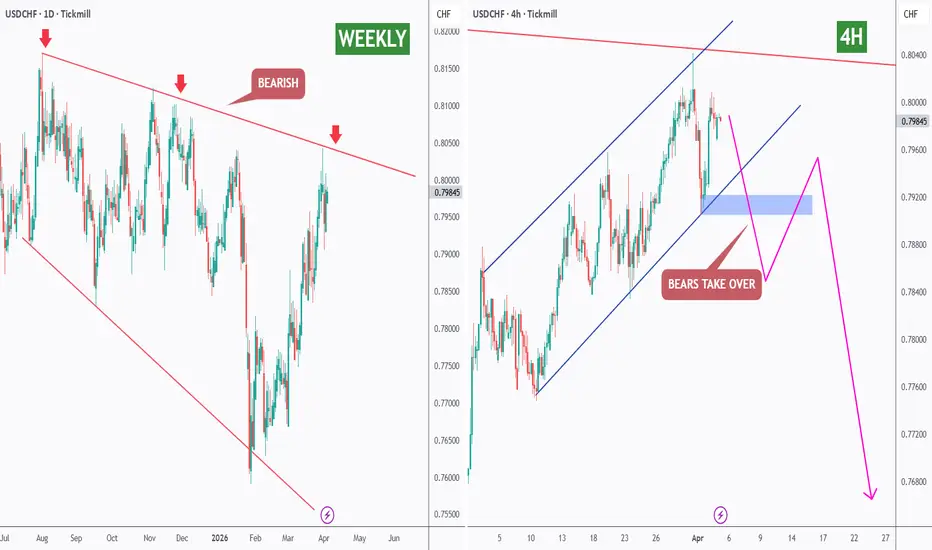
USDCHF - Keeping it simple!USDCHF has been clearly bearish from the weekly timeframe, with price respecting a long-term falling structure.
Now, price is approaching the upper bound of the wedge, a key area where sellers typically step back in.
Zooming into the 4H, the structure shows a potential shift brewing.
For the
USD/CAD: Bullish Breakout Confirmed! Eyes on 1.4100The Dollar is flexing its muscles against the CAD. After a long period of "down-only" macro price action, the structure has shifted, and we are now looking at a clear trend reversal.
The Macro Shift 🗺️
The long-term descending structure that dominated early 2026 has been shattered.
The Breakout: U

EURUSD PUMP!!!EURUSD - ACCUMULATION
Price has failed to take out the spring
We had our test followed with a re test indicating upside on the way
We are in my opinion in the last phases of the accumulation with an expansion pending
I've gone long on EU
I could be wrong but let me know what you think down

See all forex ideas
Trade directly on Supercharts through our supported, fully-verified, and user-reviewed brokers.


