
As of 04/17/2026
Indus: 49,447 +868.71 +1.8%
Trans: 22,422 +609.39 +2.8%
Utils: 1,158 -6.73 -0.6%
Nasdaq: 24,468 +365.78 +1.5%
S&P 500: 7,126 +84.78 +1.2%
|
YTD
+2.9%
+29.2%
+8.4%
+5.3%
+4.1%
|
|
As of 04/17/2026
Indus: 49,447 +868.71 +1.8%
Trans: 22,422 +609.39 +2.8%
Utils: 1,158 -6.73 -0.6%
Nasdaq: 24,468 +365.78 +1.5%
S&P 500: 7,126 +84.78 +1.2%
|
YTD
+2.9%
+29.2%
+8.4%
+5.3%
+4.1%
| |
|
| ||

I show a chart of the S&P 500 index on the daily scale.
The inverted and descending scallop highlighted at AB sees the index climb after it completes. The pattern breaks out upward when the index closes above the top of it.
The index has climbed to post a new high, at C. However, the most recent gap is likely an exhaustion gap. So my guess is the index will retrace and perhaps make a sharp drop.
![]()
The following is a brief review of how the markets performed over time. The numbers refer to the close-to-close move in the Dow industrials.
No options expire this week.
![]()
The following is based on an SFO article in December 2004 by John Seekinger, titled, "Take a two-dimensional approach." He offers these tips.
| Index | S2 | S1 | Pivot | R1 | R2 |
| Dow Industrials (^DJI): Daily | 48,389 | 48,918 | 49,318 | 49,847 | 50,247 |
| Weekly | 46,678 | 48,063 | 48,890 | 50,275 | 51,102 |
| Monthly | 43,414 | 46,430 | 48,074 | 51,091 | 52,735 |
| S&P500 (^GSPC): Daily | 7,043 | 7,085 | 7,116 | 7,158 | 7,189 |
| Weekly | 6,664 | 6,895 | 7,021 | 7,252 | 7,379 |
| Monthly | 6,033 | 6,579 | 6,863 | 7,410 | 7,694 |
| Nasdaq (^IXIC): Daily | 24,192 | 24,330 | 24,425 | 24,563 | 24,658 |
| Weekly | 22,204 | 23,336 | 23,928 | 25,060 | 25,652 |
| Monthly | 19,397 | 21,933 | 23,226 | 25,762 | 27,055 |
Here are the formulas:
![]()
Earnings season is either underway or should be starting soon. The sessions could be more volatile.
Here's a symbol list of 282 chart and candlestick patterns (13 "investment grade" candle patterns) found in today's securities using my version of Patternz: DDD, ACH, ACIW, AYI, ADBE, ADTN, AMD, AES, APD, ALK, ALKS, ALGT, AMZN, DOX, AEE, APH, ANIK, APA, APOG, ARCB, ACGL, AVY, BMI, BAX, BOOT, BRC, BFH, BCO, BMY, BRKR, BLDR, CALM, CX, CENX, CRL, CHKP, CVX, CHD, CSCO, CLNE, CNX, CMCO, COP, CSGP, COTY, CR, CROX, CCK, CSGS, CMI, CW, DVN, ^DJT, ^DJI, EME, EMR, EOG, EPAM, EFX, EG, EVRG, EVH, EXPI, EXPD, FAST, FDX, FLS, FORM, FWRD, FNV, FDP, GME, GAP, GPN, GFS, GL, GS, GGG, GFF, HLIT, HE, HELE, HP, HSIC, HNI, HD, DHI, HOV, HWM, IDXX, IBP, IIIN, ITGR, IBKR, TILE, IPI, KBH, KMT, KEYS, KFRC, KMB, KLAC, LHX, LZB, LH, LAMR, LDOS, LEN, LLY, LNC, RAMP, LOW, LXU, MHO, MGY, MLM, MAS, MTDR, MTRN, MTRX, MRK, MLKN, MS, MUR, NBR, ^IXIC, NFG, NEU, NI, NOC, NOVT, NTNX, NVDA, OXY, OLN, OMCL, ORCL, OR, OUT, PKE, PTEN, PG, PHM, KWR, DGX, RL, RMBS, RRC, RGS, ROK, RCKY, ROG, R, ^GSPC, SAIA, SLB, SCHW, SMTC, SKYW, SGI, SCCO, LUV, SPSC, SXI, SSYS, TPR, TECH, TDOC, TER, TXN, TKR, TSCO, RIG, TZOO, TREX, UGI, UIS, VFC, VLO, VC, VMC, WLK, WSC, WWD, IYC, IYE, IEZ, IHE, DDM, FTEC, QTEC, FXL, FXI, AIQ, BOTZ, QQQ, ICF, IYH, IHF, IXC, MXI, IXN, ILF, SOXX, SLV, IGE, IEO, ITB, EWO, EWK, EWC, ECH, EEM, EWQ, EWG, EWH, EIS, EWJ, EWM, EWS, EZA, EWY, EWD, EWL, EWT, THD, TUR, QLD, PPA, DBA, PBE, PEJ, PJP, SSO, ROBO, XLY, XLP, XLE, GLD, XLV, XHB, XLI, XRT, SPY, XLK, UNG, USO, SMH, VHT, VIS, MGK, VONG. Click this link for details (pattern type, start and end dates).
For a list of small patterns (those a few days wide) click this link.
The below industries were the best (rank 1) or worst performing of those I follow.
|
-- Thomas Bulkowski
![]()
Here's a symbol list of 128 chart and candlestick patterns (13 "investment grade" candle patterns) found in today's securities using my version of Patternz: DDD, ANF, ACIW, AMD, APD, AEE, AVY, AZTA, BAX, BKH, BSX, BRC, BRKR, BLDR, CAL, CE, CX, CRL, CHKP, CINF, CSCO, CLNE, CLX, CNX, CMCO, CAG, CSGP, COTY, DECK, DDS, ELV, EVRG, EXPI, FLEX, FTV, GAP, GIS, GPN, GFS, THG, HE, HNI, HUBG, JBHT, IIIN, JBLU, KMB, LHX, LDOS, LEN, RAMP, MHO, MLM, MLKN, MS, MOS, MUR, ^IXIC, NFLX, NWL, ORI, OMC, ON, OTEX, ORCL, PTEN, PEN, PPG, QTWO, QCOM, RTX, RNG, ROP, RES, SIGI, NOW, LUV, SXI, TDOC, TDY, TEVA, TTD, TJX, TSCO, TDG, RIG, TWLO, UIS, VLO, VRTX, VMC, WLK, WPM, XEL, FXL, FXI, AIQ, QQQ, IEV, IGV, IXC, IGE, IEO, EWY, EWL, QLD, DBA, PBE, PEJ, PXJ, SSO, SPY, XAR, USO. Click this link for details (pattern type, start and end dates).
For a list of small patterns (those a few days wide) click this link.
$ $ $
You can find setups based on a Fibonacci retrace by clicking on the link.
The following patterns were found manually, not using Patternz. Mr. Bulkowski has excluded any securities he owns from appearing in the list. However, he may add any of the securities listed to his portfolio at any time, just as you can.
In the table below, the red and green colors are based on the historical breakout direction for the associated chart pattern. If a high and tight flag appears, the start and end dates highlight the flagpole only and not the flag.
For details about the chart patterns, click here.
-- Thomas Bulkowski
![]()
| Symbol | Chart Pattern | Bullish Bearish | Start | End | Industry |
| DDD | Pipe bottom | 03/30/2026 | 04/06/2026 | Electronics | |
| ALB | Ugly double bottom | 03/20/2026 | 04/06/2026 | Chemical (Diversified) | |
| ALGT | Pipe bottom | 03/09/2026 | 03/16/2026 | Air Transport | |
| AEP | Pipe bottom | 03/16/2026 | 03/23/2026 | Electric Utility (Central) | |
| AMAT | Double Bottom, Adam and Adam | 03/09/2026 | 03/30/2026 | Semiconductor Cap Equip. | |
| AWI | Head-and-shoulders bottom | 03/19/2026 | 04/02/2026 | Building Materials | |
| ARW | Double Bottom, Adam and Adam | 03/20/2026 | 03/30/2026 | Electronics | |
| ATO | Broadening top | 03/02/2026 | 04/09/2026 | Natural Gas (Diversified) | |
| BRC | Double Bottom, Adam and Adam | 03/31/2026 | 04/07/2026 | Chemical (Diversified) | |
| BRKR | Double Bottom, Adam and Adam | 03/16/2026 | 03/27/2026 | Precision Instrument | |
| CAL | Pipe bottom | 03/09/2026 | 03/16/2026 | Shoe | |
| CMCO | Double Bottom, Adam and Eve | 03/19/2026 | 04/07/2026 | Machinery | |
| DVN | Pipe top | 03/23/2026 | 03/30/2026 | Natural Gas (Diversified) | |
| FWRD | Head-and-shoulders bottom | 03/16/2026 | 03/30/2026 | Trucking/Transp. Leasing | |
| FRD | Double Bottom, Adam and Adam | 03/13/2026 | 03/18/2026 | Building Materials | |
| GME | Head-and-shoulders bottom | 03/20/2026 | 04/10/2026 | Retail (Special Lines) | |
| GPN | Pipe bottom | 03/30/2026 | 04/06/2026 | Computer Software and Svcs | |
| HSIC | Triple bottom | 03/19/2026 | 04/02/2026 | Medical Supplies | |
| HNI | Pipe bottom | 03/30/2026 | 04/06/2026 | Furn/Home Furnishings | |
| ILMN | Triple bottom | 03/12/2026 | 04/10/2026 | Biotechnology | |
| IIIN | Dead-cat bounce | 04/16/2026 | 04/16/2026 | Building Materials | |
| ITGR | Triangle, symmetrical | 03/12/2026 | 04/14/2026 | Electronics | |
| KELYA | Double Bottom, Eve and Adam | 03/19/2026 | 04/09/2026 | Human Resources | |
| LEG | Double Bottom, Adam and Eve | 03/20/2026 | 04/02/2026 | Furn/Home Furnishings | |
| M | Pipe bottom | 03/09/2026 | 03/16/2026 | Retail Store | |
| MYGN | Head-and-shoulders bottom | 03/18/2026 | 04/13/2026 | Biotechnology | |
| NOV | Triangle, symmetrical | 02/24/2026 | 04/15/2026 | Oilfield Svcs/Equipment | |
| NWL | Head-and-shoulders bottom | 03/20/2026 | 04/06/2026 | Household Products | |
| OMC | Double Bottom, Adam and Adam | 03/27/2026 | 04/09/2026 | Advertising | |
| ORCL | Double Bottom, Adam and Adam | 03/30/2026 | 04/10/2026 | Computer Software and Svcs | |
| PYPL | Ugly double bottom | 02/12/2026 | 03/20/2026 | Financial Services | |
| RRC | Pipe top | 03/23/2026 | 03/30/2026 | Petroleum (Producing) | |
| RGS | Triangle, ascending | 03/17/2026 | 04/14/2026 | Toiletries/Cosmetics | |
| RNG | Pipe top | 03/02/2026 | 03/09/2026 | Computer Software and Svcs | |
| SCHW | Triple bottom | 02/23/2026 | 04/01/2026 | Securities Brokerage | |
| SAIC | Broadening top | 03/19/2026 | 04/10/2026 | IT Services | |
| SEIC | Double Bottom, Adam and Adam | 03/27/2026 | 04/07/2026 | IT Services | |
| SHOP | Double Bottom, Eve and Adam | 03/27/2026 | 04/10/2026 | E-Commerce | |
| TOL | Double Bottom, Adam and Adam | 03/20/2026 | 03/30/2026 | Homebuilding | |
| WSO | Pipe bottom | 03/23/2026 | 03/30/2026 | Retail Building Supply | |
| WEX | Double Bottom, Adam and Eve | 03/19/2026 | 03/31/2026 | Information Services |
![]()
$ $ $
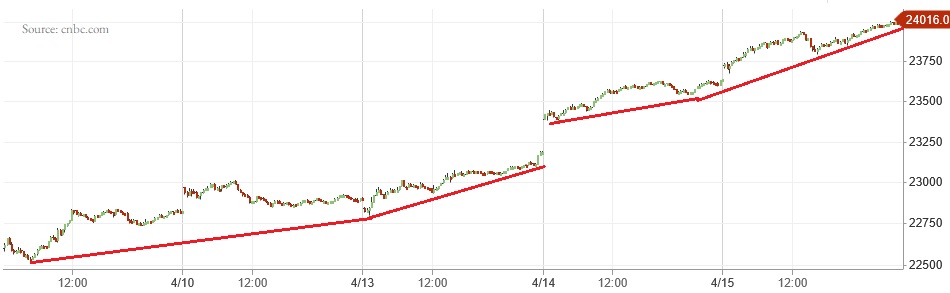
I show a picture of the Nasdaq composite on the 5-minute scale.
I don't see anything of interest. I drew several trendlines connecting the bottoms. It slopes upward as if the index is going exponential.
Other than that, the chart lacks details to comment on individual patterns.
$ $ $
Here's a symbol list of 111 chart and candlestick patterns (13 "investment grade" candle patterns) found in today's securities using my version of Patternz: DDD, ACH, ACIW, ADTN, AMD, ALB, ALKS, APA, APOG, AAPL, ADSK, ADP, BIO, BCO, BMY, BRKR, BBW, BLDR, CPB, CF, CRL, CVX, CLNE, CL, CMCO, CSGS, DVN, EXP, EIX, EOG, EXPI, EZPW, FICO, FISV, FLS, FCX, FDP, GAP, GPN, GFS, HNI, HOV, JBHT, IBKR, TILE, JKHY, LEN, LXU, MHO, MGY, MSFT, MS, MLI, MYGN, ^IXIC, NFLX, NWPX, PETS, PFE, PGR, KWR, RTX, RGS, RNG, RLI, ROST, SAIA, SCHW, TDOC, TDG, TWLO, UIS, VMI, XEL, IYM, IAI, IYE, FTEC, QTEC, FXL, AIQ, IHF, IEV, IXC, MXI, ITB, EWA, EWM, EWL, THD, IBB, XLB, XAR, XLK, USO, VAW, MGK, VONG. Click this link for details (pattern type, start and end dates).
For a list of small patterns (those a few days wide) click this link.
$ $ $
The following table shows where Fibonacci retrace values of the day's high-low range are plus pivot points, calculated on the Nasdaq composite, sorted by value. When several are near each other (small differences), the area might act as support or resistance.
-- Thomas Bulkowski
![]()
| © 2026 ThePatternSite.com Metric | Value | Diff | Close (within 10% of the high-low range for the day)? |
| Monthly S2 | 20,251.16 | ||
| Weekly S2 | 21,478.83 | 1,227.67 | |
| Monthly S1 | 22,133.59 | 654.76 | |
| Monthly Pivot | 22,572.68 | 439.09 | |
| Weekly S1 | 22,747.42 | 174.74 | |
| Weekly Pivot | 22,879.60 | 132.17 | |
| Daily S2 | 23,550.65 | 671.05 | |
| Low | 23,672.26 | 121.61 | |
| Open | 23,688.12 | 15.86 | Yes! The Open is close to the Low. |
| Daily S1 | 23,783.33 | 95.21 | |
| 61.8% Down from Intraday High | 23,807.60 | 24.27 | Yes! The 61.8% Down from Intraday High is close to the Daily S1. |
| 50% Down from Intraday High | 23,849.41 | 41.81 | |
| 38.2% Down from Intraday High | 23,891.22 | 41.81 | |
| Daily Pivot | 23,904.95 | 13.73 | Yes! The Daily Pivot is close to the 38.2% Down from Intraday High. |
| Close | 24,016.02 | 111.07 | |
| High | 24,026.56 | 10.54 | Yes! The High is close to the Close. |
| Daily R1 | 24,137.63 | 111.07 | |
| Weekly R1 | 24,148.19 | 10.56 | Yes! The Weekly R1 is close to the Daily R1. |
| Daily R2 | 24,259.25 | 111.05 | |
| Weekly R2 | 24,280.37 | 21.12 | Yes! The Weekly R2 is close to the Daily R2. |
| Monthly R1 | 24,455.11 | 174.74 | |
| Monthly R2 | 24,894.20 | 439.09 |
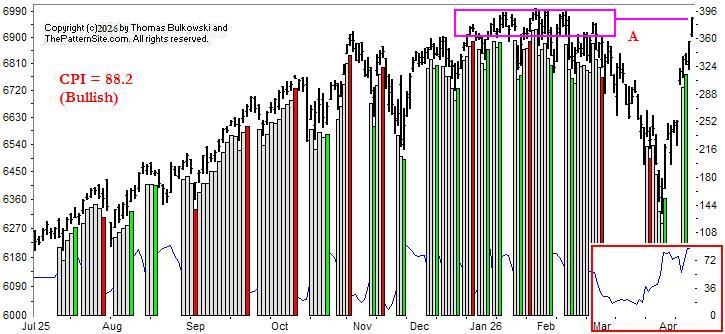
This is a picture of the chart pattern indicator on the daily scale. The indicator is the line chart below a chart of the S&P 500 composite.
There's not a lot going on in this chart. I boxed in magenta overhead resistance created by peaks. The index is bumping up against that resistance. However, it could plow through that resistance . . . or it could drop.
The CPI is at 88 where 100 is the max. Often when it approaches 100, we see a sharp drop in the CPI but maybe not a corresponding drop in the index.
Because much of today's markets are driven by world events, I don't see anything on the chart that offers a clear prediction.
$ $ $
Here's a symbol list of 181 chart and candlestick patterns (13 "investment grade" candle patterns) found in today's securities using my version of Patternz: DDD, ACH, ACIW, AMD, A, AKAM, ALK, AA, ALGT, AMZN, DOX, AMN, APH, APA, ASH, ADSK, BMI, BIO, BKNG, BRKR, BLDR, CENX, CF, CRL, CVX, CLNE, COP, COST, CCRN, DHR, XRAY, DVN, FANG, DDS, ECL, EOG, EG, XOM, EZPW, FAST, FISV, FLS, FMC, FWRD, FNV, FRD, GAP, GE, GPN, GFS, GOOGL, HL, HNI, DHI, ITGR, IPAR, IBKR, IPI, ISRG, IRM, LZB, LEN, LNC, MGY, MAN, MA, MTDR, MRCY, META, MSFT, MS, MUR, MYGN, ^IXIC, NFLX, NTGR, NTAP, NEE, NVDA, OXY, OMC, ASGN, PYPL, PCG, PFG, PSTG, RRC, RTX, RGLD, ^GSPC, SAIA, SCHW, SHW, SHOP, SKYW, SWX, TRGP, TEVA, TDG, TREX, UGI, UIS, VFC, VECO, VRTX, V, WEX, WMB, WWD, XEL, ITA, IAI, IYC, IYE, IEZ, FTEC, FDN, QTEC, FXL, FXI, AIQ, BOTZ, IEV, IXC, MXI, IXN, SLV, IEO, EWA, EWO, EWK, EWZ, EWC, EEM, EWQ, EWG, EIS, EWI, EWJ, EWM, EWY, EWP, EWL, EWT, THD, TUR, EWU, QLD, PPA, DBA, PBE, PEJ, SSO, ROBO, XLY, XLE, SPY, XAR, XLK, USO, SMH, MGK, VONG. Click this link for details (pattern type, start and end dates).
For a list of small patterns (those a few days wide) click this link.
-- Thomas Bulkowski
![]()
$ $ $
I show another slider trading quiz featuring Newport (NEWP) stock.
$ $ $
Here's a symbol list of 207 chart and candlestick patterns (13 "investment grade" candle patterns) found in today's securities using my version of Patternz: MMM, ANF, ABM, ACH, A, ALL, AEO, AXP, AFG, AIG, AMWD, ANET, ARW, AIZ, ADP, AXS, AZTA, BMI, BALL, BAX, BBY, BIO, BA, BAH, BRC, BFH, BCO, BMY, BRKR, BBW, CE, CLS, CNC, CVX, CLF, CGNX, CL, CMTL, GLW, CSGP, CSGS, CMI, CW, DHR, DECK, XRAY, DVN, FANG, ^DJT, ^DJI, DOV, ECL, EL, EZPW, FFIV, FDS, FIVN, FRD, IT, GL, GOOGL, GFF, HELE, HP, HSIC, HSY, HNI, HD, HWM, HUN, ITW, ISRG, JNJ, KALU, KMT, KLAC, LHX, LEG, LDOS, LLY, LMT, LPLA, LXU, MKTX, MTRN, META, MSFT, MCO, MS, MLI, MYGN, NBR, ^IXIC, NFLX, NTGR, ORI, PKE, PTEN, PAYX, PCTY, PYPL, PSTG, DGX, RRC, RJF, REGN, RNG, RLI, ROP, ^GSPC, SIGI, SKYW, LUV, SWX, SSYS, TRGP, TGT, TECH, TDY, TXN, TXT, TMO, TZOO, TREX, UIS, UNH, VMI, VC, WRB, WSO, WU, WMB, WSC, WDAY, ZBRA, ITA, IYC, IYE, FDN, QTEC, FXI, AIQ, BOTZ, QQQ, IHF, IEV, IXN, IEO, IYF, ITB, EWA, EWO, EWK, EWC, ECH, EEM, EIS, EWI, EWJ, EPP, EWS, EWD, EWL, EWT, QLD, PPA, PEJ, PXJ, PHO, SSO, ROBO, XLY, XLF, XHB, XLI, SPY, XLK, VIS, VAW, MGK, VONG. Click this link for details (pattern type, start and end dates).
For a list of small patterns (those a few days wide) click this link.
$ $ $
The following table shows where Fibonacci retrace values of the day's high-low range are plus pivot points, calculated on the Dow industrials, sorted by value. When several are near each other (small differences), the area might act as support or resistance.
-- Thomas Bulkowski
![]()
| © 2026 ThePatternSite.com Metric | Value | Diff | Close (within 10% of the high-low range for the day)? |
| Monthly S2 | 43,933.16 | ||
| Weekly S2 | 45,476.48 | 1,543.32 | |
| Monthly S1 | 46,075.70 | 599.23 | |
| Weekly S1 | 46,847.36 | 771.66 | |
| Monthly Pivot | 47,199.83 | 352.46 | |
| Daily S2 | 47,266.46 | 66.64 | Yes! The Daily S2 is close to the Monthly Pivot. |
| Low | 47,505.97 | 239.50 | |
| Weekly Pivot | 47,585.66 | 79.69 | |
| Open | 47,718.21 | 132.55 | |
| Daily S1 | 47,742.36 | 24.14 | Yes! The Daily S1 is close to the Open. |
| 61.8% Down from Intraday High | 47,779.25 | 36.90 | Yes! The 61.8% Down from Intraday High is close to the Daily S1. |
| 50% Down from Intraday High | 47,863.67 | 84.42 | |
| 38.2% Down from Intraday High | 47,948.09 | 84.41 | |
| Daily Pivot | 47,981.86 | 33.78 | Yes! The Daily Pivot is close to the 38.2% Down from Intraday High. |
| Close | 48,218.25 | 236.39 | |
| High | 48,221.37 | 3.12 | Yes! The High is close to the Close. |
| Daily R1 | 48,457.76 | 236.39 | |
| Daily R2 | 48,697.26 | 239.50 | |
| Weekly R1 | 48,956.54 | 259.28 | |
| Monthly R1 | 49,342.38 | 385.83 | |
| Weekly R2 | 49,694.84 | 352.46 | |
| Monthly R2 | 50,466.50 | 771.66 |

The dominant pattern on the chart is the AB top. It's a double top. It confirms as a valid chart pattern when the index closes below the low set between the two peaks. I show that price level as red line C.
At D, we see a gap but what type is it? The answer is important because if we're correct, we can use the information to trade better.
If it's a continuation gap then we can expect the uptrend to continue (the gap should appear about midway in the uptrend, but that varies). There is evidence to support a continuation with price moving higher over the last two days.
My view is it's an exhaustion gap. Exhaustion gaps can be usually tall (not always), which this one is. When they occur, price often moves in the direction opposite the gap. In this case, that means price should drop fast and perhaps far.
The gap at E is an exhaustion. Notice how prices reverse direction and soars.
![]()
The following is a brief review of how the markets performed over time. The numbers refer to the close-to-close move in the Dow industrials.
Many options expire this week, so traders will be looking to close out their positions, and that suggests increased volatility (large daily price swings).
![]()
The following is based on an SFO article in December 2004 by John Seekinger, titled, "Take a two-dimensional approach." He offers these tips.
| Index | S2 | S1 | Pivot | R1 | R2 |
| Dow Industrials (^DJI): Daily | 47,624 | 47,770 | 48,003 | 48,149 | 48,381 |
| Weekly | 45,376 | 46,646 | 47,485 | 48,755 | 49,594 |
| Monthly | 43,833 | 45,875 | 47,099 | 49,141 | 50,366 |
| S&P500 (^GSPC): Daily | 6,786 | 6,802 | 6,824 | 6,839 | 6,861 |
| Weekly | 6,421 | 6,619 | 6,732 | 6,930 | 7,044 |
| Monthly | 6,131 | 6,474 | 6,660 | 7,003 | 7,189 |
| Nasdaq (^IXIC): Daily | 22,753 | 22,828 | 22,920 | 22,995 | 23,087 |
| Weekly | 21,108 | 22,005 | 22,509 | 23,406 | 23,909 |
| Monthly | 19,880 | 21,392 | 22,202 | 23,713 | 24,523 |
Here are the formulas:
![]()
Earnings season will be starting in about 3 days.
Here's a symbol list of 180 chart and candlestick patterns (13 "investment grade" candle patterns) found in today's securities using my version of Patternz: ANF, ACN, ACIW, ADBE, ADTN, AMD, AFL, AA, AMZN, AEO, AME, AMGN, APH, AON, AMAT, AGO, ADSK, AVY, AXS, BAX, BBY, BAH, BCO, BMY, BRKR, BBW, CALM, CAL, CLS, CNC, CVX, CLF, CGNX, CTSH, CMCO, CMTL, CSGP, DHR, DECK, XRAY, DVN, DDS, D, ELV, EG, EXPI, EZPW, FIVN, FTNT, FTV, FCX, FRD, GD, GILD, GOOGL, THG, HELE, HUM, INTC, IBKR, INTU, JAZZ, JNJ, KSS, LRCX, LDOS, LLY, LPLA, LXU, M, MANH, MKTX, MDT, META, NBR, ^IXIC, NFLX, NWL, NTNX, NVDA, OLN, ASGN, PANW, PAYX, PFE, PG, KWR, DGX, RMBS, RRC, REGN, RHI, ROP, R, CRM, SBH, SMTC, SHW, SCCO, LUV, SPSC, SXI, TGT, TDOC, TDY, TFX, TDC, TTD, TWLO, UNH, VECO, VEEV, V, VC, WRB, WSO, WSM, WSC, WWD, WDAY, ITA, IYE, IHE, FDN, QTEC, AIQ, BOTZ, ICF, IYH, IHF, IAT, IYZ, MXI, IXN, ILF, SOXX, IEO, IHI, EWA, EWO, EWK, EWZ, EWC, EIS, EWM, EWL, EWT, THD, TUR, QLD, IBB, PJP, PHO, SSO, ROBO, XLV, XLK, SMH, VHT, VAW, MGK. Click this link for details (pattern type, start and end dates).
For a list of small patterns (those a few days wide) click this link.
The below industries were the best (rank 1) or worst performing of those I follow.
|
-- Thomas Bulkowski
![]()
Here's a symbol list of 132 chart and candlestick patterns (13 "investment grade" candle patterns) found in today's securities using my version of Patternz: ABM, ACN, ADBE, AA, AEO, AXP, BKH, BA, BAH, BFH, BLDR, CAL, CNC, CHKP, CVX, CLX, CMTL, GLW, CSGP, COST, CR, DHR, DECK, DVN, EMN, EL, EG, EZPW, FFIV, FICO, FIVN, FMC, FWRD, FRD, GME, GAP, GE, GOOGL, GFF, HQY, HELE, INTU, JNJ, KALU, KELYA, KMT, KFRC, LEG, LOW, LPLA, LXU, M, MANH, MKTX, META, MS, MUR, MYGN, NBR, NWL, NOVT, NUS, NTNX, ASGN, OTEX, ORCL, PANW, PAYX, PCTY, POR, QTWO, RRC, RTX, RNG, RCKY, CRM, SBH, SPSC, TDY, TDC, TXN, MZTI, TOL, TG, TWLO, UGI, UNH, VRSN, WSO, WU, WSC, WDAY, IYC, IYE, FDN, QTEC, AIQ, QQQ, IHF, IXN, ILF, SOXX, IEO, EWK, ECH, EIS, EWI, EPP, EWT, QLD, SSO, XLY, XRT, SPY, XLK, XLU, UNG, MGK. Click this link for details (pattern type, start and end dates).
For a list of small patterns (those a few days wide) click this link.
$ $ $
You can find setups based on a Fibonacci retrace by clicking on the link.
The following patterns were found manually, not using Patternz. Mr. Bulkowski has excluded any securities he owns from appearing in the list. However, he may add any of the securities listed to his portfolio at any time, just as you can.
In the table below, the red and green colors are based on the historical breakout direction for the associated chart pattern. If a high and tight flag appears, the start and end dates highlight the flagpole only and not the flag.
For details about the chart patterns, click here.
-- Thomas Bulkowski
![]()
| Symbol | Chart Pattern | Bullish Bearish | Start | End | Industry |
| AYI | Diamond bottom | 03/23/2026 | 04/09/2026 | Furn/Home Furnishings | |
| AEIS | Pipe bottom | 03/02/2026 | 03/09/2026 | Semiconductor | |
| APD | Triangle, ascending | 02/12/2026 | 04/08/2026 | Chemical (Diversified) | |
| ALL | Head-and-shoulders bottom | 03/19/2026 | 04/01/2026 | Insurance (Prop/Casualty) | |
| AMZN | Double Bottom, Eve and Adam | 02/17/2026 | 03/27/2026 | Internet | |
| AEO | Pipe bottom | 03/23/2026 | 03/30/2026 | Apparel | |
| AIG | Double Bottom, Adam and Adam | 03/19/2026 | 03/27/2026 | Insurance (Prop/Casualty) | |
| AME | Double Bottom, Adam and Adam | 03/20/2026 | 03/30/2026 | Industrial Services | |
| AAPL | Triple bottom | 03/20/2026 | 04/07/2026 | Computers and Peripherals | |
| AMAT | Pipe bottom | 03/02/2026 | 03/09/2026 | Semiconductor Cap Equip. | |
| ATR | Double Bottom, Eve and Adam | 03/20/2026 | 03/30/2026 | Packaging and Container | |
| AVNT | Pipe bottom | 03/16/2026 | 03/23/2026 | Chemical (Specialty) | |
| AXS | Triple bottom | 03/12/2026 | 03/27/2026 | Insurance (Prop/Casualty) | |
| AZTA | Double Bottom, Eve and Adam | 03/20/2026 | 03/27/2026 | Semiconductor Cap Equip. | |
| BCPC | Double Bottom, Adam and Adam | 03/20/2026 | 03/25/2026 | Chemical (Specialty) | |
| BALL | Double Bottom, Eve and Adam | 03/20/2026 | 03/30/2026 | Packaging and Container | |
| BAX | Head-and-shoulders bottom | 03/20/2026 | 04/02/2026 | Medical Supplies | |
| BZH | Double Bottom, Adam and Adam | 03/20/2026 | 03/31/2026 | Homebuilding | |
| BIIB | Double Top, Adam and Eve | 03/11/2026 | 03/26/2026 | Biotechnology | |
| CNC | Pipe bottom | 03/23/2026 | 03/30/2026 | Medical Services | |
| CVX | Pipe top | 03/23/2026 | 03/30/2026 | Petroleum (Integrated) | |
| CCRN | Triangle, symmetrical | 03/10/2026 | 04/09/2026 | Human Resources | |
| CCK | Double Bottom, Adam and Adam | 03/20/2026 | 03/30/2026 | Packaging and Container | |
| CMI | Double Bottom, Adam and Adam | 03/09/2026 | 03/30/2026 | Machinery | |
| CW | Double Bottom, Adam and Adam | 03/13/2026 | 03/30/2026 | Machinery | |
| DHR | Pipe bottom | 03/23/2026 | 03/30/2026 | Medical Services | |
| DECK | Pipe bottom | 03/23/2026 | 03/30/2026 | Shoe | |
| EIX | Double Bottom, Adam and Adam | 03/09/2026 | 03/20/2026 | Electric Utility (West) | |
| EME | Double Bottom, Adam and Adam | 03/09/2026 | 03/30/2026 | Industrial Services | |
| EG | Head-and-shoulders bottom | 03/12/2026 | 03/27/2026 | Insurance (Prop/Casualty) | |
| EZPW | Pipe bottom | 03/23/2026 | 03/30/2026 | Financial Services | |
| FTV | Double Bottom, Eve and Eve | 03/17/2026 | 03/30/2026 | Industrial Services | |
| GAP | Ugly double bottom | 03/09/2026 | 03/30/2026 | Apparel | |
| GD | Diamond bottom | 03/20/2026 | 04/09/2026 | Aerospace/Defense | |
| GNW | Head-and-shoulders bottom | 03/13/2026 | 03/31/2026 | Insurance (Life) | |
| GFS | Triple bottom | 03/12/2026 | 03/30/2026 | Semiconductor | |
| GS | Head-and-shoulders bottom | 03/09/2026 | 03/19/2026 | Securities Brokerage | |
| GOOGL | Pipe bottom | 03/23/2026 | 03/30/2026 | Internet | |
| GGG | Head-and-shoulders bottom | 03/20/2026 | 04/06/2026 | Machinery | |
| HIG | Head-and-shoulders bottom | 03/12/2026 | 03/27/2026 | Insurance (Prop/Casualty) | |
| HON | Triple bottom | 03/20/2026 | 04/07/2026 | Aerospace/Defense | |
| DHI | Double Bottom, Adam and Adam | 03/20/2026 | 03/31/2026 | Homebuilding | |
| HOV | Broadening bottom | 03/23/2026 | 04/09/2026 | Homebuilding | |
| HUN | Pipe bottom | 03/16/2026 | 03/23/2026 | Chemical (Specialty) | |
| HURC | Triple bottom | 03/13/2026 | 03/30/2026 | Machinery | |
| IEX | Double Bottom, Adam and Adam | 03/20/2026 | 03/30/2026 | Machinery | |
| ITW | Double Bottom, Adam and Eve | 03/20/2026 | 03/31/2026 | Metal Fabricating | |
| INCY | Head-and-shoulders bottom | 03/16/2026 | 03/30/2026 | Drug | |
| IBKR | Roof, inverted | 03/10/2026 | 04/07/2026 | Securities Brokerage | |
| TILE | Triple bottom | 03/20/2026 | 04/02/2026 | Furn/Home Furnishings | |
| IRM | Head-and-shoulders bottom | 03/20/2026 | 04/02/2026 | Industrial Services | |
| JBLU | Head-and-shoulders complex bottom | 03/09/2026 | 03/30/2026 | Air Transport | |
| KEYS | Double Bottom, Adam and Adam | 03/09/2026 | 03/30/2026 | Precision Instrument | |
| LZB | Double Bottom, Adam and Adam | 03/20/2026 | 04/02/2026 | Furn/Home Furnishings | |
| LRCX | Pipe bottom | 03/02/2026 | 03/09/2026 | Semiconductor Cap Equip. | |
| LAMR | Double Bottom, Adam and Eve | 03/20/2026 | 03/31/2026 | Advertising | |
| L | Double Bottom, Adam and Adam | 03/19/2026 | 03/27/2026 | Insurance (Prop/Casualty) | |
| LPLA | Triple bottom | 03/16/2026 | 04/02/2026 | Securities Brokerage | |
| LXU | Head-and-shoulders top | 03/12/2026 | 04/02/2026 | Building Materials | |
| MKTX | Pipe bottom | 03/23/2026 | 03/30/2026 | Securities Brokerage | |
| MAS | Triple bottom | 03/20/2026 | 04/02/2026 | Building Materials | |
| META | Pipe bottom | 03/23/2026 | 03/30/2026 | E-Commerce | |
| MCO | Double Bottom, Adam and Eve | 03/12/2026 | 03/27/2026 | Information Services | |
| MLI | Double Bottom, Adam and Eve | 03/20/2026 | 03/30/2026 | Metal Fabricating | |
| MUR | Double Top, Eve and Adam | 03/30/2026 | 04/07/2026 | Petroleum (Integrated) | |
| NFG | Triangle, symmetrical | 03/11/2026 | 04/09/2026 | Natural Gas (Diversified) | |
| ORI | Pipe bottom | 03/16/2026 | 03/23/2026 | Insurance (Prop/Casualty) | |
| ON | Double Bottom, Adam and Adam | 03/09/2026 | 03/30/2026 | Semiconductor | |
| PANW | Pipe bottom | 03/23/2026 | 03/30/2026 | Computer Software and Svcs | |
| PKE | Triple bottom | 03/13/2026 | 03/31/2026 | Chemical (Specialty) | |
| PATK | Double Bottom, Adam and Adam | 03/20/2026 | 03/30/2026 | Retail Building Supply | |
| PAYX | Pipe top | 03/02/2026 | 03/09/2026 | IT Services | |
| PHM | Triple bottom | 03/20/2026 | 04/07/2026 | Homebuilding | |
| KWR | Double Bottom, Adam and Adam | 03/20/2026 | 04/06/2026 | Chemical (Specialty) | |
| RMBS | Double Bottom, Adam and Adam | 03/09/2026 | 03/30/2026 | Semiconductor Cap Equip. | |
| RGA | Head-and-shoulders bottom | 03/09/2026 | 03/27/2026 | Insurance (Life) | |
| RCKY | Double Bottom, Eve and Eve | 03/26/2026 | 04/02/2026 | Shoe | |
| SAIA | Pipe bottom | 03/09/2026 | 03/23/2026 | Trucking/Transp. Leasing | |
| SSYS | Big W | 03/20/2026 | 03/30/2026 | Electronics | |
| TDY | Pipe bottom | 03/23/2026 | 03/30/2026 | Aerospace/Defense | |
| TER | Pipe bottom | 03/02/2026 | 03/09/2026 | Semiconductor Cap Equip. | |
| TXN | Double Bottom, Eve and Adam | 03/19/2026 | 03/30/2026 | Semiconductor | |
| TKR | Head-and-shoulders bottom | 03/09/2026 | 03/30/2026 | Metal Fabricating | |
| TZOO | Head-and-shoulders top | 02/26/2026 | 03/19/2026 | Internet | |
| TG | Head-and-shoulders bottom | 03/12/2026 | 03/27/2026 | Chemical (Specialty) | |
| UGI | Head-and-shoulders bottom | 03/06/2026 | 04/01/2026 | Natural Gas (Distributor) | |
| UPS | Double Bottom, Adam and Adam | 03/19/2026 | 03/27/2026 | Air Transport | |
| UNH | Pipe bottom | 03/23/2026 | 03/30/2026 | Medical Services | |
| VMI | Double Bottom, Adam and Adam | 03/30/2026 | 04/02/2026 | Metal Fabricating | |
| WMT | Head-and-shoulders bottom | 03/05/2026 | 04/08/2026 | Retail Store | |
| WAT | Double Bottom, Eve and Adam | 03/13/2026 | 03/27/2026 | Precision Instrument | |
| WSC | Double Bottom, Adam and Eve | 03/19/2026 | 03/30/2026 | Industrial Services | |
| WWW | Broadening bottom | 03/09/2026 | 04/08/2026 | Shoe |
![]()
$ $ $

I show a picture of the Nasdaq composite on the 5-minute scale.
There's not a lot to say about this chart. The two sets of parallel red lines are rectangle top chart patterns. A holiday shows no trading and it connects the two rectangles.
A head-and-shoulders bottom shows on the chart as LS (left shoulder), H (head), and RS (right shoulder). A blue neckline connects the armpits and it serves as confirmation when the index closes above it. Once confirmed, it means the pattern is valid and price will rise, which it does.
A double bottom appears at A and its inverse, a double top appears at B. Both confirm as valid chart patterns, with B saying price will fall and A saying it will rise.
The double bottom suggests more of an up move is coming. I agree until the Iran ceasefire ends and chaos resumes.
$ $ $
Here's a symbol list of 354 chart and candlestick patterns (13 "investment grade" candle patterns) found in today's securities using my version of Patternz: ANF, ABM, ACIW, AYI, ADTN, AEIS, AMD, AES, A, APD, ALRM, ALK, ALKS, AMZN, AEE, AEO, AXP, AME, AMGN, APH, AR, AON, APOG, AAPL, ARCB, ACGL, ANET, ARW, ASH, AGO, AVY, BCPC, BALL, BSET, BZH, BIO, BA, BKNG, BAH, BFH, BCO, BRKR, CBT, CLS, CX, CNC, CNP, CRL, CHKP, CVX, CHD, CIEN, CTAS, CSCO, CLF, CNO, CNX, CMCO, COP, GLW, CSGP, COST, COTY, CRH, CROX, CCRN, CTS, CMI, CW, DHR, DECK, DVN, FANG, DDS, DSGR, ^DJT, ^DJI, EMN, ECL, EME, EMR, EOG, XOM, EZPW, FFIV, FICO, FAST, FDX, FLEX, FLS, FMC, FORM, FTV, FWRD, FNV, FCX, FRD, GME, GNW, GILD, GFS, GL, GS, GOOGL, HLIT, HTLD, HELE, HP, HD, HON, DHI, HUBG, JBHT, HUN, IDA, IDXX, NSP, IBP, IIIN, ITGR, INTC, IBKR, IRM, JBLU, KALU, KBH, KEYS, KMB, KLAC, KSS, KLIC, LHX, LZB, LAMR, LPLA, LXU, MHO, MTSI, M, MGY, MANH, MKTX, MLM, MAS, MA, MTRN, MTRX, MRK, META, MLKN, MCO, MS, MOS, MLI, NBR, ^IXIC, NTAP, NWPX, NUS, NTNX, NVDA, OXY, OMCL, ASGN, ON, OUT, OXM, PANW, PKE, PATK, PTEN, PYPL, PLXS, PPL, PFG, PG, PRU, PHM, QTWO, RL, RMBS, RRC, RTX, RNG, ROK, RCKY, ROG, RGLD, RES, R, ^GSPC, SAIA, SBH, SLB, SCHW, SEIC, SMTC, SHW, SHOP, SKYW, SGI, SO, SCCO, SPSC, SSYS, TPR, TRGP, TDY, TDC, TER, TXN, TXT, TMO, TSCO, TDG, TZOO, TG, TREX, TWLO, UHAL, UNH, UNM, VFC, VECO, VRTX, V, VC, VMC, WMT, WAT, WSO, WERN, WPM, WMB, WSM, WSC, WWD, ZBRA, ITA, IYM, IAI, IYC, IYE, IHE, DDM, FTEC, FDN, QTEC, FXL, AIQ, QQQ, ICF, IYH, IHF, IAT, IYZ, IEV, IGV, MXI, IXN, ILF, SOXX, IEO, IYF, ITB, EWA, EWO, EWK, EWZ, EWC, ECH, EEM, EWQ, EWG, EWH, EIS, EWI, EWJ, EWW, EPP, EWS, EZA, EWP, EWD, EWL, EWT, THD, EWU, QLD, PPA, PEJ, PXJ, PHO, SSO, ROBO, XLP, XLF, XLV, XHB, XLI, XLB, XRT, SPY, XAR, XLK, UNG, USO, SMH, VHT, VIS, VAW, MGK, VONG. Click this link for details (pattern type, start and end dates).
For a list of small patterns (those a few days wide) click this link.
$ $ $
The following table shows where Fibonacci retrace values of the day's high-low range are plus pivot points, calculated on the Nasdaq composite, sorted by value. When several are near each other (small differences), the area might act as support or resistance.
-- Thomas Bulkowski
![]()
| © 2026 ThePatternSite.com Metric | Value | Diff | Close (within 10% of the high-low range for the day)? |
| Monthly S2 | 19,860.85 | ||
| Weekly S2 | 20,476.62 | 615.77 | |
| Monthly S1 | 21,247.92 | 771.30 | |
| Weekly S1 | 21,555.80 | 307.88 | |
| Weekly Pivot | 21,769.44 | 213.63 | |
| Monthly Pivot | 22,077.32 | 307.88 | |
| Daily S2 | 22,332.56 | 255.24 | |
| Daily S1 | 22,483.78 | 151.21 | |
| Low | 22,501.28 | 17.50 | Yes! The Low is close to the Daily S1. |
| 61.8% Down from Intraday High | 22,623.49 | 122.21 | |
| Close | 22,634.99 | 11.50 | Yes! The Close is close to the 61.8% Down from Intraday High. |
| Daily Pivot | 22,652.49 | 17.50 | Yes! The Daily Pivot is close to the Close. |
| 50% Down from Intraday High | 22,661.24 | 8.75 | Yes! The 50% Down from Intraday High is close to the Daily Pivot. |
| 38.2% Down from Intraday High | 22,699.00 | 37.75 | |
| Daily R1 | 22,803.71 | 104.71 | |
| Open | 22,821.21 | 17.50 | Yes! The Open is close to the Daily R1. |
| High | 22,821.21 | 0.00 | Yes! The High is close to the Open. |
| Weekly R1 | 22,848.62 | 27.41 | Yes! The Weekly R1 is close to the High. |
| Daily R2 | 22,972.42 | 123.80 | |
| Weekly R2 | 23,062.26 | 89.83 | |
| Monthly R1 | 23,464.39 | 402.13 | |
| Monthly R2 | 24,293.79 | 829.40 |

This is a picture of the chart pattern indicator on the daily scale. The indicator is the line chart below a chart of the S&P 500 composite.
I show when Trump started the war with Iran. Notice that the markets were slumping for about a month before it started. However, once the bombs started dropping (a week before, really), the CPI turned bearish. It might be finding some footing here, but I have my doubts.
I am reminded of the movie, "The Money Pit" where Tom Hanks is told that to fix his house, it'll take two weeks (it took many months). That was a joke but whenever he asked the contractor for a completion estimate, the answer was always two weeks. Reminds me of what Trump says.
Today, the CPI is bullish (at 66.7) but just barely above a neutral reading of 65. I expect this to transition to bearish as more war news arrives. Circled in the inset is the latest downturn. Again, I expect that downtrend to continue.
$ $ $
Here's a symbol list of 140 chart and candlestick patterns (13 "investment grade" candle patterns) found in today's securities using my version of Patternz: DDD, ACH, AYI, ADTN, AEIS, AES, DOX, AEE, AEO, AMN, ANIK, ANET, AVY, BCPC, CNC, CNP, CENX, CVX, CLNE, CNX, CAG, COP, GLW, COST, DHR, DECK, DVN, FANG, D, EMN, ELV, EOG, EXC, EXPD, XOM, EZPW, FICO, FISV, FORM, FTNT, GME, GOOGL, HELE, HOV, HUM, IDA, IBP, ITGR, IPI, JAZZ, KEYS, LH, LPLA, LXU, MGY, MANH, MKTX, META, MSFT, MOS, MUR, NBR, NOV, NTAP, NI, NTNX, OXY, OXM, PANW, PKE, PTEN, PLXS, POR, PPG, PPL, PEG, QTWO, DGX, RRC, RES, SAIA, SLB, SAIC, SEE, SEIC, SRE, SMTC, SHOP, SO, SR, TGT, TDY, RIG, TWLO, UIS, UNH, VLO, VRSN, VC, WSO, WSC, IYK, IYE, IEZ, IHE, IDU, FDN, QTEC, AIQ, BOTZ, QQQ, IHF, IYZ, IXC, IXN, IGE, IEO, EIS, EWY, QLD, SSO, XLK, USO, MGK, VONG. Click this link for details (pattern type, start and end dates).
For a list of small patterns (those a few days wide) click this link.
-- Thomas Bulkowski
![]()
$ $ $
I show another slider trading quiz featuring Noven Pharmaceutical: NOVN (actual trade).
$ $ $
Here's a symbol list of 74 chart and candlestick patterns (13 "investment grade" candle patterns) found in today's securities using my version of Patternz: ACH, AES, AEE, AEP, AIG, AMWD, AAPL, ADP, AVNT, BMI, BCPC, BKNG, BOOT, BFH, CPB, CNP, CIEN, CSCO, CXW, CR, DECK, DSGR, ECL, EIX, EL, EXC, FFIV, FISV, GNW, GFF, HLIT, HSY, HOLX, HWM, HUN, IDA, ILMN, IPI, KALU, LRCX, MHO, NFLX, NTGR, NEU, NI, NUS, ORI, OLN, ON, OXM, PKE, PETS, PPL, RNG, ROP, CRM, SEE, SCI, SO, SR, TEVA, MZTI, TJX, UHAL, WMB, IYM, ILF, IGE, TUR, PEJ, VAW. Click this link for details (pattern type, start and end dates).
For a list of small patterns (those a few days wide) click this link.
$ $ $
The following table shows where Fibonacci retrace values of the day's high-low range are plus pivot points, calculated on the Dow industrials, sorted by value. When several are near each other (small differences), the area might act as support or resistance.
-- Thomas Bulkowski
![]()
| © 2026 ThePatternSite.com Metric | Value | Diff | Close (within 10% of the high-low range for the day)? |
| Monthly S2 | 42,923.22 | ||
| Weekly S2 | 44,430.76 | 1,507.54 | |
| Monthly S1 | 44,796.55 | 365.79 | |
| Weekly S1 | 45,550.32 | 753.77 | |
| Weekly Pivot | 46,176.84 | 626.52 | |
| Daily S2 | 46,229.16 | 52.32 | |
| Low | 46,354.95 | 125.79 | |
| Daily S1 | 46,449.52 | 94.57 | |
| Open | 46,472.20 | 22.68 | Yes! The Open is close to the Daily S1. |
| 61.8% Down from Intraday High | 46,487.18 | 14.98 | Yes! The 61.8% Down from Intraday High is close to the Open. |
| 50% Down from Intraday High | 46,528.02 | 40.84 | |
| 38.2% Down from Intraday High | 46,568.87 | 40.85 | |
| Daily Pivot | 46,575.31 | 6.44 | Yes! The Daily Pivot is close to the 38.2% Down from Intraday High. |
| Close | 46,669.88 | 94.57 | |
| High | 46,701.10 | 31.22 | Yes! The High is close to the Close. |
| Daily R1 | 46,795.67 | 94.57 | |
| Daily R2 | 46,921.46 | 125.79 | |
| Monthly Pivot | 46,930.61 | 9.15 | Yes! The Monthly Pivot is close to the Daily R2. |
| Weekly R1 | 47,296.40 | 365.79 | |
| Weekly R2 | 47,922.92 | 626.52 | |
| Monthly R1 | 48,803.94 | 881.02 | |
| Monthly R2 | 50,938.00 | 2,134.06 |
Here's a symbol list of 113 chart and candlestick patterns (13 "investment grade" candle patterns) found in today's securities using my version of Patternz: ACH, ACIW, ADBE, ADTN, AES, AFL, APD, AKAM, ALRM, AEE, AEP, AMN, ANIK, ANET, AIZ, AVNT, AZTA, BMI, BCPC, BIO, BKH, BOOT, BRKR, BBW, BG, CALM, CPB, CLS, CRL, CTAS, CNA, ED, CXW, COTY, ^DJU, DOV, EPAM, EG, EXC, FMC, FTNT, FDP, GME, GNW, HLIT, HQY, HSIC, HUN, IDA, INCY, IPI, IRM, KALU, LRCX, LAMR, RAMP, LXU, MRTN, NFG, NOV, NFLX, NKE, NI, NTNX, NVDA, ORI, ASGN, OXM, PKG, PANW, PYPL, POR, PG, ROG, RES, CRM, SEIC, SO, SR, TRV, TZOO, UHAL, UGI, UNH, WRB, WAT, WERN, WEX, WDAY, IYM, FDN, IYZ, IYF, PEJ, PXJ, XLP, UNG, USO, VAW. Click this link for details (pattern type, start and end dates).
For a list of small patterns (those a few days wide) click this link.
$ $ $
You can find setups based on a Fibonacci retrace by clicking on the link.
The following patterns were found manually, not using Patternz. Mr. Bulkowski has excluded any securities he owns from appearing in the list. However, he may add any of the securities listed to his portfolio at any time, just as you can.
In the table below, the red and green colors are based on the historical breakout direction for the associated chart pattern. If a high and tight flag appears, the start and end dates highlight the flagpole only and not the flag.
For details about the chart patterns, click here.
-- Thomas Bulkowski
![]()
| Symbol | Chart Pattern | Bullish Bearish | Start | End | Industry |
| ANF | Double Bottom, Eve and Adam | 03/24/2026 | 03/30/2026 | Apparel | |
| AMD | Rectangle bottom | 02/04/2026 | 04/02/2026 | Semiconductor | |
| AA | Double Bottom, Adam and Eve | 03/09/2026 | 03/24/2026 | Aerospace/Defense | |
| AFG | Head-and-shoulders bottom | 03/12/2026 | 03/27/2026 | Insurance (Prop/Casualty) | |
| AVA | Head-and-shoulders bottom | 03/11/2026 | 04/01/2026 | Electric Utility (West) | |
| BCPC | Pipe bottom | 03/16/2026 | 03/23/2026 | Chemical (Specialty) | |
| BKH | Double Bottom, Eve and Adam | 03/20/2026 | 03/31/2026 | Electric Utility (West) | |
| CPB | Pipe bottom | 03/16/2026 | 03/23/2026 | Food Processing | |
| CNA | Double Bottom, Adam and Adam | 03/20/2026 | 03/27/2026 | Insurance (Prop/Casualty) | |
| CNO | Triangle, symmetrical | 03/10/2026 | 03/30/2026 | Insurance (Diversified) | |
| CNX | Head-and-shoulders top | 03/02/2026 | 03/17/2026 | Natural Gas (Diversified) | |
| COST | Double Bottom, Adam and Eve | 03/06/2026 | 03/24/2026 | Retail Store | |
| XRAY | Triangle, symmetrical | 03/17/2026 | 04/02/2026 | Medical Supplies | |
| BOOM | Double Bottom, Eve and Eve | 03/13/2026 | 03/20/2026 | Metal Fabricating | |
| EZPW | Double Bottom, Adam and Eve | 03/06/2026 | 03/31/2026 | Financial Services | |
| FMC | Triple bottom | 02/23/2026 | 03/20/2026 | Chemical (Basic) | |
| GL | Double Bottom, Adam and Eve | 03/20/2026 | 03/27/2026 | Insurance (Life) | |
| THG | Double Bottom, Adam and Adam | 03/19/2026 | 03/27/2026 | Insurance (Prop/Casualty) | |
| HE | Head-and-shoulders bottom | 03/09/2026 | 04/01/2026 | Electric Utility (West) | |
| HUM | Triple bottom | 03/12/2026 | 03/30/2026 | Medical Services | |
| HURC | Triangle, descending | 03/12/2026 | 04/02/2026 | Machinery | |
| INTU | Double Top, Eve and Eve | 03/06/2026 | 03/17/2026 | Computer Software and Svcs | |
| KALU | Pipe bottom | 03/16/2026 | 03/23/2026 | Metals and Mining (Div.) | |
| LH | Head-and-shoulders complex bottom | 03/12/2026 | 03/31/2026 | Medical Services | |
| MTRN | Head-and-shoulders bottom | 03/13/2026 | 03/30/2026 | Metals and Mining (Div.) | |
| MRK | Double Bottom, Eve and Eve | 03/06/2026 | 03/20/2026 | Drug | |
| NEU | Pipe bottom | 03/09/2026 | 03/16/2026 | Chemical (Specialty) | |
| NOC | Double Bottom, Adam and Adam | 03/24/2026 | 03/30/2026 | Aerospace/Defense | |
| NUS | Triangle, descending | 03/09/2026 | 03/31/2026 | Toiletries/Cosmetics | |
| OXM | Pipe bottom | 03/16/2026 | 03/23/2026 | Apparel | |
| PKE | Triangle, descending | 02/27/2026 | 04/02/2026 | Chemical (Specialty) | |
| PAYX | Diamond bottom | 03/18/2026 | 03/31/2026 | IT Services | |
| PCTY | Pipe top | 03/02/2026 | 03/09/2026 | E-Commerce | |
| PFE | Head-and-shoulders bottom | 02/20/2026 | 03/24/2026 | Drug | |
| PCG | Double Bottom, Adam and Adam | 03/23/2026 | 03/27/2026 | Electric Utility (West) | |
| PFG | Head-and-shoulders bottom | 03/13/2026 | 03/27/2026 | Insurance (Diversified) | |
| PGR | Head-and-shoulders complex top | 02/05/2026 | 03/24/2026 | Insurance (Prop/Casualty) | |
| PRU | Triple bottom | 03/13/2026 | 03/27/2026 | Insurance (Life) | |
| RHI | Double Bottom, Adam and Eve | 02/25/2026 | 03/16/2026 | Human Resources | |
| ROK | Double Bottom, Eve and Eve | 03/17/2026 | 03/30/2026 | Diversified Co. | |
| SAIA | Double Bottom, Adam and Adam | 03/13/2026 | 03/19/2026 | Trucking/Transp. Leasing | |
| SIGI | Double Bottom, Adam and Adam | 03/20/2026 | 03/25/2026 | Insurance (Prop/Casualty) | |
| SRE | Double Bottom, Adam and Adam | 03/09/2026 | 03/20/2026 | Electric Utility (West) | |
| SMTC | Double Bottom, Eve and Eve | 03/19/2026 | 03/30/2026 | Semiconductor Cap Equip. | |
| SNPS | Head-and-shoulders top | 02/10/2026 | 03/05/2026 | Computer Software and Svcs | |
| TPR | Falling wedge | 03/09/2026 | 04/02/2026 | Apparel | |
| TEVA | Broadening top, right-angled and ascending | 03/13/2026 | 04/02/2026 | Drug | |
| UHAL | Pipe bottom | 03/16/2026 | 03/23/2026 | Trucking/Transp. Leasing | |
| VMC | Double Bottom, Adam and Adam | 03/12/2026 | 03/19/2026 | Cement and Aggregates |
![]()

Invest for Two-Comma Wealth, Second Edition is a plain English, no nonsense guide to investing and personal finance, written for people who want to understand how the stock market actually works before risking their savings.
Whether you’re just starting out, rebuilding after mistakes, or planning for retirement, this book walks you through the core ingredients of wealth-building—clearly, honestly, and with real-world examples.
What You’ll Learn
Why This Book Is Different
Unlike flashy investing books that promise fast riches, this guide:
Who This Book Is For
If you want a clear path to becoming a millionaire the boring—but reliable—way, this book belongs on your shelf.
![]()
$ $ $

I show a picture of the Nasdaq composite on the 5-minute scale.
At A, we see a chart pattern called a triple bottom. In this case, the index didn't rise far (to B) before reversing and tumbling.
I drew trendline C to see how the peaks lined up. When the index crosses the down trendline (the green one), it signals an upward move, one of three conditions to set a new trend. However, the upward move might not last long.
I drew trendline D to line up the bottoms, this time to see when the uptrend changes to down. We see that the index is following the trendline higher. It might plunge through the trendline or it could bounce off it and rise. Take your pick.
$ $ $
Here's a symbol list of 135 chart and candlestick patterns (13 "investment grade" candle patterns) found in today's securities using my version of Patternz: DDD, ABT, ACH, ACIW, AEE, AEP, AVNT, AVA, BMI, BCPC, BIO, BAH, BFH, BMY, BBW, CPB, CX, CRL, CHD, CIEN, CNX, CMCO, GLW, CSGP, CR, ^DJU, DTE, DUK, EXP, EVRG, EXC, EZPW, FNV, FCX, GD, GPN, GS, GOOGL, HL, HSY, HUN, IDA, IPAR, IPI, KALU, LRCX, LEN, LMT, LPLA, MRTN, META, MCO, MOS, NFLX, NTGR, NWPX, ORI, OR, OXM, PKG, PKE, PYPL, PNW, POR, RLI, ROG, RGLD, SAIA, SCHW, SAIC, SEE, SEIC, SRE, SO, SCCO, SR, TEVA, TKR, TG, UHAL, UNM, VEEV, VRSN, V, WLK, WPM, WMB, IYM, IYK, IHE, IYH, IEV, MXI, ILF, IYF, EWA, EWO, EWK, EWC, EWQ, EWG, EWI, EWJ, EWM, EWW, EPP, EWS, EZA, EWY, EWP, EWD, EWL, EWT, EWU, IBB, PBE, PJP, ROBO, GLD, UNG, VHT, VAW. Click this link for details (pattern type, start and end dates).
For a list of small patterns (those a few days wide) click this link.
$ $ $
The following table shows where Fibonacci retrace values of the day's high-low range are plus pivot points, calculated on the Nasdaq composite, sorted by value. When several are near each other (small differences), the area might act as support or resistance.
-- Thomas Bulkowski
![]()
| © 2026 ThePatternSite.com Metric | Value | Diff | Close (within 10% of the high-low range for the day)? |
| Monthly S2 | 19,713.77 | ||
| Weekly S2 | 20,367.33 | 653.56 | |
| Monthly S1 | 20,777.36 | 410.03 | |
| Weekly S1 | 21,104.14 | 326.78 | |
| Daily S2 | 21,589.90 | 485.76 | |
| Weekly Pivot | 21,646.74 | 56.84 | |
| Daily S1 | 21,715.42 | 68.68 | |
| Low | 21,723.72 | 8.30 | Yes! The Low is close to the Daily S1. |
| Open | 21,742.79 | 19.07 | Yes! The Open is close to the Low. |
| 61.8% Down from Intraday High | 21,822.79 | 80.00 | |
| Close | 21,840.95 | 18.16 | Yes! The Close is close to the 61.8% Down from Intraday High. |
| Daily Pivot | 21,849.25 | 8.30 | Yes! The Daily Pivot is close to the Close. |
| 50% Down from Intraday High | 21,853.39 | 4.15 | Yes! The 50% Down from Intraday High is close to the Daily Pivot. |
| 38.2% Down from Intraday High | 21,884.00 | 30.60 | |
| Monthly Pivot | 21,973.52 | 89.52 | |
| Daily R1 | 21,974.77 | 1.25 | Yes! The Daily R1 is close to the Monthly Pivot. |
| High | 21,983.07 | 8.30 | Yes! The High is close to the Daily R1. |
| Daily R2 | 22,108.60 | 125.53 | |
| Weekly R1 | 22,383.55 | 274.95 | |
| Weekly R2 | 22,926.15 | 542.60 | |
| Monthly R1 | 23,037.11 | 110.96 | |
| Monthly R2 | 24,233.27 | 1,196.16 |
Here's the link to the 2026 market forecast update, presented in slider format.
$ $ $
Here's a symbol list of 262 chart and candlestick patterns (13 "investment grade" candle patterns) found in today's securities using my version of Patternz: DDD, MMM, ACIW, AYI, AES, ALRM, ALK, ALKS, ALGT, AMZN, DOX, AEO, AEP, AME, AMGN, AMN, APH, AR, APOG, AWI, ASH, ATO, ADP, AVY, AVNT, AVA, BCPC, BALL, BAX, BIO, BMRN, BA, BAH, BSX, BRC, BCO, BBW, BLDR, CACI, CDNS, CPB, COR, CRL, CHD, CLX, CNX, CL, CMCO, CMTL, COP, COTY, CR, CRH, CCK, CTS, CMI, XRAY, DVN, DDS, ^DJT, ^DJI, DOV, DUK, EXP, EBAY, ELV, EME, EMR, EPAM, EXC, EXPD, FDS, FAST, FDX, FTV, FWRD, GME, GS, GOOGL, GGG, GFF, HD, HON, DHI, HOV, HWM, HUN, HURC, IEX, IDXX, INCY, IIIN, ITGR, IBKR, TILE, IPI, ISRG, IRM, JAZZ, KALU, KBH, KELYA, KSS, LH, LRCX, LAMR, LEG, LLY, LNC, MHO, M, MGY, MLM, MAS, MTDR, MSFT, MS, MLI, MUR, NBR, ^IXIC, NFLX, NJR, NWL, NKE, NWPX, NOVT, NUS, ORI, OMCL, ON, ORCL, OR, OUT, OXM, PKG, PKE, PTEN, PEN, PGR, PHM, QCOM, DGX, RL, RRC, RJF, ROK, ROST, RGLD, RES, R, ^GSPC, SBH, SLB, SHW, SHOP, SLGN, SKYW, SGI, SO, SCCO, LUV, SR, SXI, SSYS, TPR, TEVA, TXN, TTD, TKR, TJX, TOL, RIG, TZOO, TREX, UHAL, UPS, VFC, VMI, VC, WMT, WSO, WERN, WSM, WSC, WWW, WWD, IYM, IAI, IYC, IHE, DDM, FTEC, FDN, QTEC, FXL, FXI, AIQ, BOTZ, QQQ, ICF, IYH, IHF, IAT, IEV, IGV, MXI, IXN, ILF, SLV, IEO, ITB, IHI, EWA, EWO, EWK, EWZ, EWC, ECH, EWQ, EWH, EIS, EWI, EWJ, EWM, EPP, EWS, EZA, EWP, EWD, EWT, THD, TUR, EWU, QLD, PEJ, PJP, PHO, SSO, ROBO, XLY, XLV, XHB, XLI, XRT, SPY, VHT, VIS, VAW, MGK, VONG. Click this link for details (pattern type, start and end dates).
For a list of small patterns (those a few days wide) click this link.
-- Thomas Bulkowski
![]()
Support this site! Clicking any of the books (below) takes you to
Amazon.com If you buy ANYTHING while there, they pay for the referral.
Legal notice for paid links: "As an Amazon Associate I earn from qualifying purchases."
|
My Stock Market Books
|
My Novels
Orb Foresight Rewrite Coming!
|