
As of 04/15/2026
Indus: 48,464 -72.27 -0.1%
Trans: 20,948 -316.12 -1.5%
Utils: 1,157 -13.84 -1.2%
Nasdaq: 24,016 +376.94 +1.6%
S&P 500: 7,023 +55.57 +0.8%
|
YTD
+0.8%
+20.7%
+8.3%
+3.3%
+2.6%
|
|
As of 04/15/2026
Indus: 48,464 -72.27 -0.1%
Trans: 20,948 -316.12 -1.5%
Utils: 1,157 -13.84 -1.2%
Nasdaq: 24,016 +376.94 +1.6%
S&P 500: 7,023 +55.57 +0.8%
|
YTD
+0.8%
+20.7%
+8.3%
+3.3%
+2.6%
| |
|
| ||
Recent Headlines |

|
Older Headlines |
Archives |
$ $ $
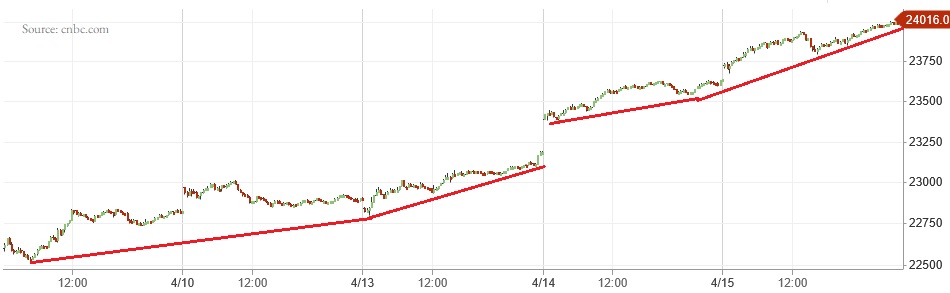
I show a picture of the Nasdaq composite on the 5-minute scale.
I don't see anything of interest. I drew several trendlines connecting the bottoms. It slopes upward as if the index is going exponential.
Other than that, the chart lacks details to comment on individual patterns.
$ $ $
Here's a symbol list of 111 chart and candlestick patterns (13 "investment grade" candle patterns) found in today's securities using my version of Patternz: DDD, ACH, ACIW, ADTN, AMD, ALB, ALKS, APA, APOG, AAPL, ADSK, ADP, BIO, BCO, BMY, BRKR, BBW, BLDR, CPB, CF, CRL, CVX, CLNE, CL, CMCO, CSGS, DVN, EXP, EIX, EOG, EXPI, EZPW, FICO, FISV, FLS, FCX, FDP, GAP, GPN, GFS, HNI, HOV, JBHT, IBKR, TILE, JKHY, LEN, LXU, MHO, MGY, MSFT, MS, MLI, MYGN, ^IXIC, NFLX, NWPX, PETS, PFE, PGR, KWR, RTX, RGS, RNG, RLI, ROST, SAIA, SCHW, TDOC, TDG, TWLO, UIS, VMI, XEL, IYM, IAI, IYE, FTEC, QTEC, FXL, AIQ, IHF, IEV, IXC, MXI, ITB, EWA, EWM, EWL, THD, IBB, XLB, XAR, XLK, USO, VAW, MGK, VONG. Click this link for details (pattern type, start and end dates).
For a list of small patterns (those a few days wide) click this link.
$ $ $
The following table shows where Fibonacci retrace values of the day's high-low range are plus pivot points, calculated on the Nasdaq composite, sorted by value. When several are near each other (small differences), the area might act as support or resistance.
-- Thomas Bulkowski
![]()
| © 2026 ThePatternSite.com Metric | Value | Diff | Close (within 10% of the high-low range for the day)? |
| Monthly S2 | 20,251.16 | ||
| Weekly S2 | 21,478.83 | 1,227.67 | |
| Monthly S1 | 22,133.59 | 654.76 | |
| Monthly Pivot | 22,572.68 | 439.09 | |
| Weekly S1 | 22,747.42 | 174.74 | |
| Weekly Pivot | 22,879.60 | 132.17 | |
| Daily S2 | 23,550.65 | 671.05 | |
| Low | 23,672.26 | 121.61 | |
| Open | 23,688.12 | 15.86 | Yes! The Open is close to the Low. |
| Daily S1 | 23,783.33 | 95.21 | |
| 61.8% Down from Intraday High | 23,807.60 | 24.27 | Yes! The 61.8% Down from Intraday High is close to the Daily S1. |
| 50% Down from Intraday High | 23,849.41 | 41.81 | |
| 38.2% Down from Intraday High | 23,891.22 | 41.81 | |
| Daily Pivot | 23,904.95 | 13.73 | Yes! The Daily Pivot is close to the 38.2% Down from Intraday High. |
| Close | 24,016.02 | 111.07 | |
| High | 24,026.56 | 10.54 | Yes! The High is close to the Close. |
| Daily R1 | 24,137.63 | 111.07 | |
| Weekly R1 | 24,148.19 | 10.56 | Yes! The Weekly R1 is close to the Daily R1. |
| Daily R2 | 24,259.25 | 111.05 | |
| Weekly R2 | 24,280.37 | 21.12 | Yes! The Weekly R2 is close to the Daily R2. |
| Monthly R1 | 24,455.11 | 174.74 | |
| Monthly R2 | 24,894.20 | 439.09 |
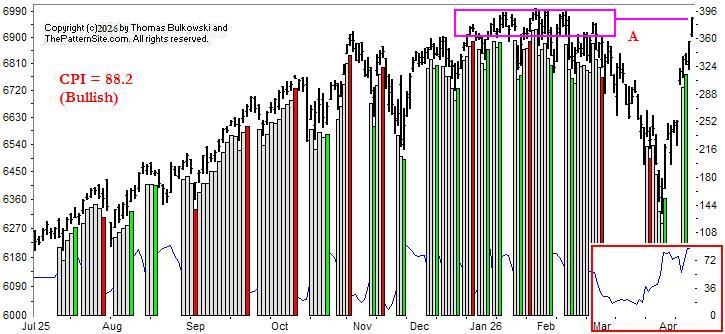
This is a picture of the chart pattern indicator on the daily scale. The indicator is the line chart below a chart of the S&P 500 composite.
There's not a lot going on in this chart. I boxed in magenta overhead resistance created by peaks. The index is bumping up against that resistance. However, it could plow through that resistance . . . or it could drop.
The CPI is at 88 where 100 is the max. Often when it approaches 100, we see a sharp drop in the CPI but maybe not a corresponding drop in the index.
Because much of today's markets are driven by world events, I don't see anything on the chart that offers a clear prediction.
$ $ $
Here's a symbol list of 181 chart and candlestick patterns (13 "investment grade" candle patterns) found in today's securities using my version of Patternz: DDD, ACH, ACIW, AMD, A, AKAM, ALK, AA, ALGT, AMZN, DOX, AMN, APH, APA, ASH, ADSK, BMI, BIO, BKNG, BRKR, BLDR, CENX, CF, CRL, CVX, CLNE, COP, COST, CCRN, DHR, XRAY, DVN, FANG, DDS, ECL, EOG, EG, XOM, EZPW, FAST, FISV, FLS, FMC, FWRD, FNV, FRD, GAP, GE, GPN, GFS, GOOGL, HL, HNI, DHI, ITGR, IPAR, IBKR, IPI, ISRG, IRM, LZB, LEN, LNC, MGY, MAN, MA, MTDR, MRCY, META, MSFT, MS, MUR, MYGN, ^IXIC, NFLX, NTGR, NTAP, NEE, NVDA, OXY, OMC, ASGN, PYPL, PCG, PFG, PSTG, RRC, RTX, RGLD, ^GSPC, SAIA, SCHW, SHW, SHOP, SKYW, SWX, TRGP, TEVA, TDG, TREX, UGI, UIS, VFC, VECO, VRTX, V, WEX, WMB, WWD, XEL, ITA, IAI, IYC, IYE, IEZ, FTEC, FDN, QTEC, FXL, FXI, AIQ, BOTZ, IEV, IXC, MXI, IXN, SLV, IEO, EWA, EWO, EWK, EWZ, EWC, EEM, EWQ, EWG, EIS, EWI, EWJ, EWM, EWY, EWP, EWL, EWT, THD, TUR, EWU, QLD, PPA, DBA, PBE, PEJ, SSO, ROBO, XLY, XLE, SPY, XAR, XLK, USO, SMH, MGK, VONG. Click this link for details (pattern type, start and end dates).
For a list of small patterns (those a few days wide) click this link.
-- Thomas Bulkowski
![]()
$ $ $
I show another slider trading quiz featuring Newport (NEWP) stock.
$ $ $
Here's a symbol list of 207 chart and candlestick patterns (13 "investment grade" candle patterns) found in today's securities using my version of Patternz: MMM, ANF, ABM, ACH, A, ALL, AEO, AXP, AFG, AIG, AMWD, ANET, ARW, AIZ, ADP, AXS, AZTA, BMI, BALL, BAX, BBY, BIO, BA, BAH, BRC, BFH, BCO, BMY, BRKR, BBW, CE, CLS, CNC, CVX, CLF, CGNX, CL, CMTL, GLW, CSGP, CSGS, CMI, CW, DHR, DECK, XRAY, DVN, FANG, ^DJT, ^DJI, DOV, ECL, EL, EZPW, FFIV, FDS, FIVN, FRD, IT, GL, GOOGL, GFF, HELE, HP, HSIC, HSY, HNI, HD, HWM, HUN, ITW, ISRG, JNJ, KALU, KMT, KLAC, LHX, LEG, LDOS, LLY, LMT, LPLA, LXU, MKTX, MTRN, META, MSFT, MCO, MS, MLI, MYGN, NBR, ^IXIC, NFLX, NTGR, ORI, PKE, PTEN, PAYX, PCTY, PYPL, PSTG, DGX, RRC, RJF, REGN, RNG, RLI, ROP, ^GSPC, SIGI, SKYW, LUV, SWX, SSYS, TRGP, TGT, TECH, TDY, TXN, TXT, TMO, TZOO, TREX, UIS, UNH, VMI, VC, WRB, WSO, WU, WMB, WSC, WDAY, ZBRA, ITA, IYC, IYE, FDN, QTEC, FXI, AIQ, BOTZ, QQQ, IHF, IEV, IXN, IEO, IYF, ITB, EWA, EWO, EWK, EWC, ECH, EEM, EIS, EWI, EWJ, EPP, EWS, EWD, EWL, EWT, QLD, PPA, PEJ, PXJ, PHO, SSO, ROBO, XLY, XLF, XHB, XLI, SPY, XLK, VIS, VAW, MGK, VONG. Click this link for details (pattern type, start and end dates).
For a list of small patterns (those a few days wide) click this link.
$ $ $
The following table shows where Fibonacci retrace values of the day's high-low range are plus pivot points, calculated on the Dow industrials, sorted by value. When several are near each other (small differences), the area might act as support or resistance.
-- Thomas Bulkowski
![]()
| © 2026 ThePatternSite.com Metric | Value | Diff | Close (within 10% of the high-low range for the day)? |
| Monthly S2 | 43,933.16 | ||
| Weekly S2 | 45,476.48 | 1,543.32 | |
| Monthly S1 | 46,075.70 | 599.23 | |
| Weekly S1 | 46,847.36 | 771.66 | |
| Monthly Pivot | 47,199.83 | 352.46 | |
| Daily S2 | 47,266.46 | 66.64 | Yes! The Daily S2 is close to the Monthly Pivot. |
| Low | 47,505.97 | 239.50 | |
| Weekly Pivot | 47,585.66 | 79.69 | |
| Open | 47,718.21 | 132.55 | |
| Daily S1 | 47,742.36 | 24.14 | Yes! The Daily S1 is close to the Open. |
| 61.8% Down from Intraday High | 47,779.25 | 36.90 | Yes! The 61.8% Down from Intraday High is close to the Daily S1. |
| 50% Down from Intraday High | 47,863.67 | 84.42 | |
| 38.2% Down from Intraday High | 47,948.09 | 84.41 | |
| Daily Pivot | 47,981.86 | 33.78 | Yes! The Daily Pivot is close to the 38.2% Down from Intraday High. |
| Close | 48,218.25 | 236.39 | |
| High | 48,221.37 | 3.12 | Yes! The High is close to the Close. |
| Daily R1 | 48,457.76 | 236.39 | |
| Daily R2 | 48,697.26 | 239.50 | |
| Weekly R1 | 48,956.54 | 259.28 | |
| Monthly R1 | 49,342.38 | 385.83 | |
| Weekly R2 | 49,694.84 | 352.46 | |
| Monthly R2 | 50,466.50 | 771.66 |
Support this site! Clicking any of the books (below) takes you to
Amazon.com If you buy ANYTHING while there, they pay for the referral.
Legal notice for paid links: "As an Amazon Associate I earn from qualifying purchases."
|
My Stock Market Books
|
My Novels
Orb Foresight Rewrite Coming!
|